I. INTRODUCTION
It is a global technological challenge to develop highly efficient electrochemical devices, with the help of solid polymer electrolytes (SPEs), as it offers safer and easier handling in a manufacturing process. SPE has attracted wide attraction due to its applications in lithium ion batteries,Reference Costa, Lavall, Borges, Rieumont, Silva and Ribeiro1 fuel cells,Reference Lee, Nohira and Hagiwara2 and potential commercial application in electrochromic devices in displays.Reference Brazier, Appetecchi, Passerini, Vuk, Orel, Donsanti and Decker3
Among many different types of polymer used in the research field of SPE, poly(vinylidene fluoride-hexafluoropropylene) [P(VdF-HFP)] seems to be more appealing than others. The combination of crystalline polyvinylidene fluoride and amorphous polyhexafluoropropylene allows it to have two opposing properties, which are high ionic conductivity and excellent mechanical strength, simultaneously. P(VdF-HFP)-based electrolytes have already been shown to have high ionic conductivity at ambient temperature and used in dye-sensitized solar cells in combination with room temperature ionic liquids (RTILs) showing good conversion efficiencies.Reference Lee, Suryanarayanan and Ho4
Introduction of RTILs to the international research arena is mainly due to the detrimental effects on the environmental and human health concerns from the evaporation of highly volatile organic solvents.Reference Forsyth and MacFarlane5 RTILs are literally salts that remain in liquid state over a wide range of temperature, including room temperature. They have gained interests owing to their exceptional properties including nonvolatility, nonflammability, low viscosity, and chemical and electrochemical stability.Reference Wang, Zhang, Liu and He6 Nowadays, the majority of ionic liquid research has concentrated in 1-3-dialkyl imidazolium salts.Reference Keskin, Kayrak-Talay, Akman and Hortaçsu7 It is the most popularly used and widely investigated class of RTIL, as the imidazolium cation produces salts which have relatively low melting points.
In this study, we endeavor to study the effect of 1-butyl-3-methylimidazolium trifluoromethanesulfonate (BMIMTf) content in the P(VdF-HFP)–lithium triflate salt-based SPE system, from low to high amount of incorporation, by employing impedance spectroscopy, scanning electron microscopy (SEM), and thermogravimetric analysis (TGA).
II. EXPERIMENTAL
A. Materials
P(VdF-HFP) with average Mw = 455,000 was obtained from Sigma-Aldrich (St. Louis, MO). Lithium trifluoromethanesulfonate (LiTf) salt was obtained from Acros (Morris Plains, NJ). BMIMTf was obtained from Agro Organics (Cape Town, South Africa) and dried at 100 °C for 1 h to eliminate trace amounts of water in the material, prior to the preparation of SPEs. Acetone of analytical reagent grade was obtained from J.T. Baker (Phillipsburg, NJ). All the chemicals were used as received.
B. Preparation of thin films
Several polymer electrolyte complexes were prepared as in the compositions according to its content of ionic liquid in part by weight (pbw), ranging from 25 to 100 pbw, with fixed amount of polymer and lithium salt, which is 60/40 pbw. In this study, solution casting technique was used to obtain thin film samples with acetone as solvent. The thoroughly stirred mixture was then cast on a Petri dish and allowed to evaporate slowly inside a fume hood. This procedure yields mechanically stable and free-standing thin films. The resulting thin films were labeled as from LB-0 to LB-100 to designate the amount of BMIMTf in pbw doped into each sample. The thickness of thin films was measured using a micrometer screw gauge.
C. Instrumentation
The samples were cut out resembling the shape of stainless steel-blocking electrodes used in this study and sandwiched between them. A Hioki 3532-50 LCR Hi-Tester (Nagano, Japan) was used to perform the impedance measurements for each SPE over the frequency range of 50 Hz–1 MHz. The equation σ = l/R bA is used to calculate the ionic conductivity of thin film sample, where σ is conductivity in siemens per centimeter, l is thickness of thin film sample in centimeter, R b is bulk resistance in Ω obtained from Cole–Cole impedance plot, and A is surface area of stainless steel blocking electrodes in square centimeter. The same measurement was also performed for selected samples from 30 to 80 °C. The SPEs were then subjected to SEM, with the model Leica S440 (Wetzlar, Germany). All the SEM micrographs share a common magnification factor of 5000×. TGA and differential thermogravimetric (DTG) analysis were performed with a Mettler Toledo analyzer that consists of a TGA/SDTA851e main unit and STARe software with 10 °C min−1 heat rate between 30 and 500 °C under a nitrogen atmosphere.
III. RESULTS AND DISCUSSION
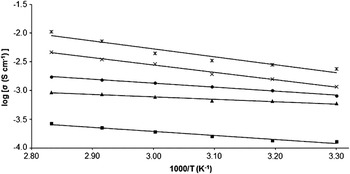
Figure 1 depicts the variation of ionic conductivity when different amounts of BMIMTf are doped into the P(VdF-HFP) –LiTf-based SPE system. Surprisingly, LB-25, SPE sample with 25 pbw of BMIMTf incorporated in it, shows lowest ionic conductivity among all the samples, with 1.3 × 10⁻⁴ S·cm−1 at 30 °C. On the other hand, LB-100, SPE sample with 100 pbw of BMIMTf incorporation, achieves highest ionic conductivity in this series, with 2.4 × 10⁻³ S·cm−1 at the same temperature. It is necessary to point out that both samples with such ionic conductivity are adequate for lithium battery applications; however, it is the trend of ionic conductivity that makes this SPE system quite interesting.
Variation of log ionic conductivity as a function of inverse absolute temperature of LB-0 (▲), LB-25 (■), LB-50 (●), LB-75 (×), and LB-100 (*).

As seen from Fig. 1, ionic conductivity drops when the first 25 pbw of BMIMTf is added into the system, then it goes back to slightly higher than LB-0, sample without ionic liquid, and increases consistently with the further addition of BMIMTf. This is not so unusual, as ionic conductivity is expected to be enhanced instantaneously with the inclusion of ionic liquid. Both anion and cation in LiTf and BMIMTf can be conducting species with their dissociative ionic form in this system. In LB-25, it can be assumed that Li+ and BMIM+ compete with each other to reassociate with Tf−, as there is only one sort of anion. Li+ is obviously far smaller in size and taking into consideration of the bonding structure, it can achieve more stable form of neutral ion pair with Tf− as compared to BMIM+. When BMIMTf is first introduced into the system, Li+ wins the battle as it outnumbers the amount of BMIM+ and thus lowers the ionic conductivity. This may imply molecular level blending of BMIMTf with P(VdF-HFP), as the ionic conductivity would not be decreased to such an extent if the blending was at microscopic rather than molecular level.Reference Xu, Ye and Huang8 However, when the number of BMIM+ increases, that is when 50, 75, and 100 pbw of BMIMTf is added into the system, it starts functioning as plasticizer as to transform the crystalline region of polymer host to amorphous and helps in ionic dissociation of LiTf. Also, both the BMIM+ and Tf− ions are mobile and can be contributing to the overall ionic conductivity of the SPE.Reference Singh, Kim and Rhee9 Other than that, BMIMTf used in this study has low viscosity. It has been reported that the ionic conductivity is more dependant on the mobility of free ions and tortuosity of the ion conduction pathway rather than the number of free mobile ions, once the polymer electrolyte reaching a high ionic conductivity region.Reference Choi, Lee, Lee, Lee and Park10 All the factors make ionic conductivity increases again with the presence of higher amount of ionic liquid.
Figure 1 also depicts the variation of ionic conductivity with respect to temperature changes. The ionic conductivity of all SPEs is measured at different temperatures, from 30 to 80 °C, to evaluate the ionic conduction mechanism in them. In general, ionic conductivity of the samples increases with increasing temperature, which is typical, as the molecular mobility in the system increases with temperature, which in turn increases the mobility of conducting species and thus improves the ionic conductivity.Reference Tiyapiboonchaiya, Pringle, Sun, Byrne, Howlett, Macfarlane and Forsyth11 According to computational calculation, regression values of all samples appear to be quite close to unity, indicating that the temperature-dependent ionic conductivity for this SPE system obeys Arrhenius rule. According to Arrhenius behavior, the nature of cation transport can be described to be similar to those in ionic crystals, where ions hoping back and forth the neighboring vacant sites.Reference Ramesh and Chai12 The motion of ions in SPEs is a liquid-like mechanism; the segmental motion either permits the ions to hop from one site to another or in other words, provides a pathway for ions to move.Reference Chiang, Shen, Reddy and Chu13 The increase of heat energy also provides greater potential and mechanical energies to facilitate the dynamic segmental motion of the polymer chain. Bond rotations produce segmental motion and thus the degree of ionic conductivity becomes higher by the free paths.Reference Kumar, Kim, Kim, Nahm and Elizabeth14 All these seem normal enough for a polymer electrolyte system, except the gradient of each plotted line and activation energy calculated from them.
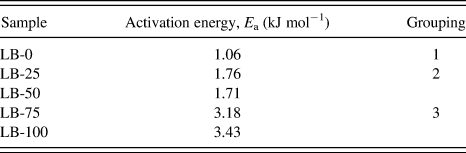
Activation energy of selected samples has been calculated from the Arrhenius equation,  , where σ is ionic conductivity, σ o is the pre-exponential factor, E a is the apparent activation energy, R is universal gas constant, and T is the absolute temperature. The activation energy calculated for each sample is tabulated in Table I. Common observation in temperature-dependent ionic conductivity is when the ionic conductivity increases, the associated activation energy decreases, as the ionic conduction mechanism becomes easier. It may be related to the easy transformation of the polymer conformation.Reference Gregorio and Borges15 Conversely, what we obtain here is completely diverse from this well-known observation, in which the gradient of plotted line getting lower when the ionic conductivity increases. When the content of BMIMTf increases, gradient of the plotted straight line becomes steeper as well. This kind of results is quite similar to that reported in the literatureReference Marcilla, Alcaide, Sardon, Pomposo, Pozo-Gonzalo and Mecerreyes16; however, the authors did not provide any explanation on this observation. It indicates some kind of thermal-assisted ionic conduction mechanism. Systems containing high concentration of ions such as ionic liquids are more sensitive concerning influence of temperature on the ionic conductivity and possibly also on viscosity.Reference Reiter, Vondrák, Michálek and Mička17 As this sort of graphs are plotted based on its internal energy, namely activation energy for ionic conduction, the SPEs in this study can be grouped into three types, judging from the steepness of gradients. Simply put, LB-0 as first kind with lowest E a among all SPEs, LB-25 and LB-50 as second kind with intermediate E a, and LB-75 and LB-100 as third kind with the highest E a. The activation energy calculated for LB-25 and LB-50, which belong to the second group is much higher as compared to that of LB-0 in the first group. As for the LB-75 and LB-100 in the third group, the activation energy calculated is even twice as much of those in second group. Although LB-100 exhibits the highest activation energy among other samples, it is still considered much lower as compared to a similar systemReference Ferrari, Quartarone, Mustarelli, Magistris, Fagnoni, Protti, Gerbaldi and Spinella18 which employs similar kind of lithium salt and ionic liquid (0.095 eV), presumably due to larger ionic size of lithium salt and ionic liquid in that particular system. This suggests there might be different ionic conduction mechanisms in these SPEs of our study. Perhaps this bizarre behavior is related to the structural changes of P(VdF-HFP), as E a in polymer electrolytes is normally associated with the energy needed for ionic conduction mechanism. This is why we also perform the study of SPE’s morphology with SEM, which appears to be quite revealing.
Calculated activation energy for samples LB-0, LB-25, LB-50, LB-75, and LB-100 using Arrhenius’s equation and hypothetical grouping based on activation energies.

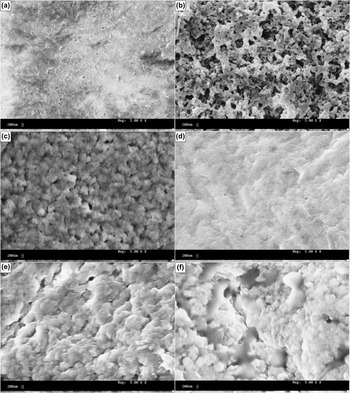
Depending on the type and amount of additives present in the polymer matrix, the morphology of the polymer electrolyte will vary and greatly influence its properties.Reference Abbrent, Plestil, Hlavata, Lindgren, Tegenfeldt and Wendsjö19 Morphological examination of this study is carried out to study the morphological changes of the pure polymer and the resulting SPE samples, after the addition of BMIMTf. SEM micrographs of (a) pure P(VdF-HFP), samples (b) LB-0, (c) LB-25, (d) LB-50, (e) LB-75, and (f) LB-100 have been presented in Fig. 2. We understand that the morphological features may not represent the bulk properties of the SPE, but it may offer us some insights to explain such curious behaviors of SPE in temperature-dependence ionic conductivity described earlier.
Scanning electron micrographs of (a) pure poly(vinylidene fluoride-hexafluoropropylene) [P(VdF-HFP)], samples (b) LB-0, (c) LB-25, (d) LB-50, (e) LB-75, and (f) LB-100.

Very distinguishable changes can be observed from pure P(VdF-HFP) to undopped, low, intermediate, and high concentrations of BMIMTf. Pure P(VdF-HFP) shows normal porous surface with uniform small pore size. The morphology changes, when 40 pbw of LiTf is incorporated into 60 pbw of P(VdF-HFP), to become spheroidal,Reference Elmér, Wesslén, Sommer-Larsen, West, Hassender and Jannasch20 an open pore structure of the polymer electrolyte matrix is essential for ionic conductivity across the thin film.Reference Aravindan and Vickraman21 This type of open porous structure has already been identified to be providing enough channels for the migration of ions, accounting for the increased ionic conductivityReference Li, Zhang, Zhang, Yang and Wu22 and also low E a in this study.
As soon as 25 pbw of BMIMTf is added into the system, the polymer morphology appears to resemble that of LB-0, but swollen and the pores become seemingly smaller as well. This can be due to the absorption of BMIMTf into the polymer matrix at molecular level. When two additional 25 pbw of BMIMTf are added, the morphological changes have become more prominent, from Figs. 2(c) to 2(d) and 2(e). In Fig. 2(d), it seems like the spheroidal structure has transformed into a slightly rough but poreless surface, indicating a different type of ionic conduction mechanism from LB-0. This swollen spheroidal and poreless structure may be responsible for the SPEs to have higher E a before any doping.
The surface roughness of sample becomes more apparent and turns cloudy when it comes to LB-75. Though, LB-100 is considered to have more uneven morphological feature, namely cloudy structure, as compared to LB-75. It is clear that the ionic conduction mechanism must have changed considerably from all the previous samples. Lack of porous structure in polymer electrolyte may imply more complex ionic conduction mechanism and thus leads to higher E a.
From these micrographs, it can be observed that the polymer structure is having drastic alteration with respect to the amount of BMIMTf, from spheroidal to swollen spheroidal, roughness, and cloudiness. These morphological changes may or may not correlate to the peculiar observation we observe in the temperature-dependant ionic conductivity, but it can be an indication of structural changes and different ionic conduction mechanism that takes place in the polymer matrix, which might lead to the results obtained in temperature-dependant ionic conductivity. Uneven cloudy structure observed in the sample LB-100 suggests some kind of phase separation. To further investigate this speculation, TGA and DTG methods are used.
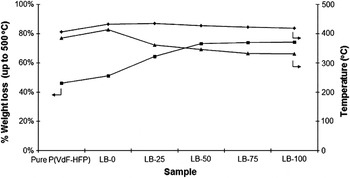
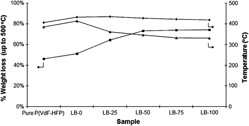
The weight loss of the pure P(VdF-HFP) and all samples has been examined by subjecting to TGA in nitrogen atmosphere, to study their thermal stability. Figure 3 illustrates weight loss percentages, decomposition temperatures, and onset temperatures of decomposition of all samples. It shows that no major weight loss has been observed below 330 °C. This is highly desirable for its potential applications in electrochemical devices, which are often operated at elevated temperatures.
Weight loss percentages (■), decomposition temperatures (◆), and onset temperatures of decomposition (▲) of pure P(VdF-HFP), samples LB-0, LB-25, LB-50, LB-75, and LB-100 obtained from thermogravimetric analysis (TGA) thermograms.

From Fig. 3, decomposition temperature and corresponding onset temperature of decomposition increase upon addition of LiTf into the polymer. This can be explained by the presence of high level of Li+, which makes the sample to require higher energy to be thermally decomposed. However, as soon as BMIMTf is added into the system, both decomposition temperature and corresponding onset temperature of decomposition are affected, particularly the latter. Decrease of onset temperature of decomposition maybe due to the increasing amount of BMIM+, which is not as thermally stable as other ions. Decomposition temperatures seem to be affected at a slighter degree, owing to the consistent amount of Li+ present in the system.
On the other hand, weight loss percentages of different samples up to 500 °C observed in this analysis seem to be quite appealing. The weight loss percentage increases upon the addition of LiTf, due to the presence of Tf−, which can be burnt off as carbon oxides, sulfur oxides, and hydrogen fluoride at high temperature. After that, this inclination continues as 25 pbw of BMIMTf is added into this system. This is quite ordinary, as ionic liquid has the lowest onset temperature of decomposition and highest rate to be burnt off, as compared to other components in the polymer electrolytes, which is shown in DTG thermograms elsewhere. However, it doesn’t follow the same trend as before when another 25 pbw of BMIMTf is included into the system. It seems that when the amount of BMIMTf approaches or exceeds 50 pbw or so, the samples tend to have the same weight loss percentage, regardless of the increasing amount of BMIMTf. Although it is not clear the possible causes yet, nevertheless this observation can be good for the actual application, as we found in the previous section that higher amount of ionic liquid increases the ionic conductivity, but it also remains the same weight when subjected to high temperatures. This suggests BMIMTf may only be physically absorbed into the pores of P(VdF-HFP) polymer matrix, without any significant interaction with the matrix itself.Reference Sirisopanaporn, Fernicola and Scrosati23 As for now, we realized that the “turning point” of this exceptional phenomenon lays around 50 pbw of BMIMTf concentration. More analyses and samples with smaller difference of BMIMTf concentration are needed to find out what happens when this concentration of BMIMTf is added into the system. Perhaps analysis of DTG thermograms shown below, which are directly differentiated from the TGA thermograms above, may be able to provide some insights on the subject of this issue.
Thermogravimetry method allow experimenters to detect and record quantitatively the variation of sample weights continuously during the course of heating. As a consequence of the possible overlapping of the decomposition temperatures during heating, DTG is preferred, which records directly the first derivative of TGA thermograms by plotting the weight differences per time unit or simply rate of weight loss, as a function of temperature. This is, of course, quite convenient as the rate of thermal decomposition is proportional to the volatilization or mass loss rate. One of the main roles of DTG is in mechanistic studies. For example, it is the best indicator of the temperatures at which the various stages of thermal decomposition take place and the order in which they occur. However, we did not perform chemical and infrared analyses of the residues of thermal decomposition withdrawn at different temperatures from the reaction system as that would require different instrument setup from ours.
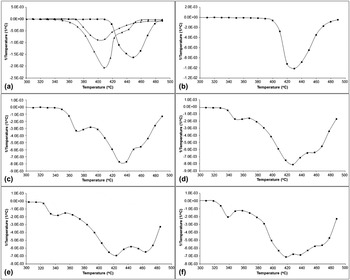
Figure 4(a) shows the DTG thermograms of pure P(VdF-HFP), LiTf, and BMIMTf. As can be seen from the figure, LiTf is clearly the most thermally stable and only shows a peak at around 450 °C, presumable due to Tf−, as Li+ requires much high temperature than that. It is then followed by BMIMTf at around 410 °C and slightly lower for P(VdF-HFP). When P(VdF-HFP) mixes with LiTf, as in LB-0 in Fig. 4(b), the sample only shows a single peak at 430 °C, which is in between the two peaks shown by the two individual constituents. This suggests good compatibility of the two chemicals. If two components are not as compatible, it would show two overlapped peaks with somewhat unaffected peaks from their respective individual DTG runs.
Differential thermogravimetric thermograms of (a) pure P(VdF-HFP) (◆), lithium trifluoromethanesulfonate (■), and 1-butyl-3-methylimidazolium trifluoromethanesulfonate (▲), (b) LB-0, (c) LB-25, (d) LB-50, (e) LB-75, and (f) LB-100 differentiated from TGA thermograms.

Things start to change when BMIMTf comes into the picture. In Fig. 4(c), when 25 pbw of BMIMTf is added into the system, the first distinctive change would be the appearance of a new peak at around 370 °C, which is not observed in any of the three individual chemicals. So it must be assumed that the new peak is caused by the newly added BMIMTf, presumably BMIM+, as it is less thermally stable compared to Tf−. Another new peak at around 460 °C, which seems like being separated from the original peak at 430 °C, maybe due to the increased amount of Tf− contributed by BMIMTf. However, in Fig. 4(a), the pure BMIMTf only shows a small flat peak at 460 °C, as compared to an intense peak of LiTf. We believe that Tf− is more thermally stable in LiTf than BMIMTf due to the highly asymmetrical features of BMIM+ that makes the bonding loose and therefore appearance in liquid state.
The DTG thermogram presents an interesting trend when more and more BMIMTf is added into the system. The new small peak at 370 °C shown in Fig. 4(c) continues to shift to lower temperatures, such as 350 °C at LB-50 and 340 °C at LB-75 and LB-100. This can be due to the positive charge repulsion among BMIM+ itself and again, its asymmetrical structure. On the contrary, not only change has been noted for BMIM+, but also the two peaks at 430 and 460 °C regions have been noted. When content of BMIMTf increases, peak at 430 °C moves to a slightly lower temperature, down to approximately 420 °C, whereas the peak at 460 °C changes to slightly higher temperature, up to approximately 470 °C. This can be an indication of incompatibility of constituents leading to phase separation, as what is observed from the SEM images described earlier. As for the peak corresponding to Tf−, the increasing temperature of decomposition suggests that it has become more thermally stable, possibly attributable to the fact that anion in the ionic liquid as well as in polymer electrolytes is not bound to lattice, but generally presents near the positively charged cations and loosely bound.Reference Singh, Hundal, Park, Park, Lee, Kim, Yamada and Sekhon24 Thus, the presence of a high amount of positively charged BMIM+ ion may somewhat contribute stability to the negatively charged Tf− ion, even though the BMIM+ ion is being “kicked out” as suggested above. Increased amorphous domain of polymer host by addition of ionic liquid also very likely to make it more stabilized in the system. From the observations above, we conclude that the amount of BMIMTf in P(VdF-HFP)/LiTf-based polymer electrolytes strongly affects its thermal properties as a whole in that system, most probably due to the chemical and physical natures of BMIM+, even though it is coupled with Tf− to improve its chemical compatibility with existing components in the system.
IV. CONCLUSION
The presence of BMIM+ in this system seems like a double-bladed sword. The observations in temperature dependence may be beneficial for the application of battery devices as ionic conductivity increases with increasing temperature. However, the indication of a certain degree of phase separation may be detrimental to the electrical appliances. All the changes seem to be happening when 50 pbw of BMIMTf is added into the system. More analyses and samples with smaller difference of BMIMTf concentration around 50 pbw of BMIMTf are needed to find out the optimum amount of BMIMTf needed to improve the ionic conductivity, morphological properties, and thermal stability, and at the same time not to show signs of phase separation.
ACKNOWLEDGMENT
This work was supported by the Fundamental Research Grant Scheme from the Ministry of Higher Education, Malaysia (FP009/2010B) and Universiti Malaya Research Grant (RG140-11AFR).