1 Introduction
This paper is concerned with the wide issue of how particles affect the transition to turbulence in a pipe flow. Besides the fundamental interest of this canonical problem, several industrial sectors have seen a growing need to accurately measure flow rates or volume fractions in complex fluid mixtures flowing through pipes. Examples range from the precise determination of the volume fraction of oil in the oil–water–sand–gas mixture that is extracted from offshore wells, to needs in the food processing industry (Ismail et al. Reference Ismail, Gamio, Bukhari and Yang2005), and flows of molten metal carrying impurities during recycling processes (Kolesnikov, Karcher & Thess Reference Kolesnikov, Karcher and Thess2011). Each of these examples requires dedicated flow metering technologies, most of which rely on a priori knowledge of the nature of the flow inside the pipe or the duct and in particular whether it is turbulent or not (Wang & Baker Reference Wang and Baker2014). Although none of these examples could satisfactorily be modelled as a single fluid phase carrying one type of particle, the ideal problem of the particulate pipe flow constitutes an elementary building block. As such it is a good starting point from which to infer the basic mechanisms governing the transition to turbulence.
Adding particles opens a number of possibilities associated with different physical mechanisms: particles can be buoyant or not, of different sizes and shapes and also mono- or polydisperse. As a first step in studying the transition to turbulence in particulate pipe flows, we shall focus on the simpler case of neutrally buoyant, monodisperse spherical particles. Whether the effect of particles on the transition to turbulence in general is a stabilising or destabilising one mostly depends on the size and volume fraction of particles. Early experiments on the transition to turbulence in a pipe highlighted a critical volume fraction of particles below which they favoured the transition at a lower Reynolds number. At higher volume fractions than this critical value, in contrast, the effect was reversed (Matas, Morris & Guazzelli Reference Matas, Morris and Guazzelli2003). Recent numerical simulations based on accurate modelling of individual solid particles recovered this phenomenology for pipe flows (Yu et al. Reference Yu, Wu, Shao and Lin2013) and channel flows (Wang, Abbas & Climent Reference Wang, Abbas and Climent2018).
The non-trivial nature of the influence of particles is further supported by the numerical study of individual perturbations introduced in a channel: whilst below a critical volume fraction, particles lower the critical energy beyond which perturbations trigger the transition to turbulence, the transition takes place longer after the perturbation was introduced in the presence of particles if the perturbation takes the form of streamwise vortices (Klinkenberg et al. Reference Klinkenberg, Sardina, De Lange and Brandt2013). At high volume fraction, the critical energy is increased. Linear stability analysis in the same configuration provides a hint on the origin of this non-monotonic effect of volume fraction: it reveals the existence of an optimal stabilisation regime due to a maximum in the Stokes drag, when the particle relaxation time (i.e. the time for a particle at rest to accelerate to the velocity of the surrounding fluid), coincides with the period of the streamwise oscillation (Klinkenberg, de Lange & Brandt Reference Klinkenberg, de Lange and Brandt2011).
Single phase pipe flow is governed by the a sole parameter, the non-dimensional flow rate or Reynolds number. While for low flow rates the problem remains laminar, it is known to transition to a turbulent regime when the flow rate is increased. This transition poses a classical problem in fluid dynamics as the base (laminar) flow remains linearly stable even at much higher flow rates (Meseguer & Trefethen Reference Meseguer and Trefethen2003). The observed turbulence, therefore, must be initiated by finite amplitude disturbances. The inclusion of particles complicates the problem, but also allows for the possibility of entirely new forms of transition.
Adding particles to the pipe flow raises the question of how particles shall be distributed in the pipe, at least in some initial state. While a homogeneous spatial distribution may first come to mind as the simplest possible, neutrally buoyant particles in pipes are known to aggregate near a specific radius greater than 65 % of the pipe radius (Segré & Silberberg Reference Segré and Silberberg1962), increasing slowly with the Reynolds number. The underlying mechanism is driven by the radial variations of the lift force experienced by particles rotating due to the background shear (Repetti & Leonard Reference Repetti and Leonard1964). The dependence of the aggregation radius (often called the Segré–Silberberg radius) on the Reynolds number can be explained by means of asymptotic theory, introducing the particle Reynolds number as the small parameter in the expression of the lift force (Schonberg & Hinch Reference Schonberg and Hinch1989; Hogg Reference Hogg1994; Asmolov Reference Asmolov1999).
While this dependence is well recovered in experiments at moderate Reynolds numbers, a second equilibrium position appears at a lower radius (Matas, Morris & Guazzelli Reference Matas, Morris and Guazzelli2004b
) for
 $Re>600$
. Although this transition coincides with a change in the concavity of the radial profile of the lift force, the detailed mechanisms driving this effect remain to be found, and the authors left open the question of whether this equilibrium is stable or not. Han et al. (Reference Han, Kim, Kim and Lee1999) note that the main effect of particle concentration on this phenomenology is to disperse the particle distribution around the equilibrium annulus. However, higher concentrations can also lead to the formation of trains of particles aligned with the stream (Matas et al.
Reference Matas, Glezer, Morris and Guazzelli2004a
). In the context of the transition to turbulence, the natural tendency of particles to aggregate around specific radii at different Reynolds numbers raises the question of the critical Reynolds at which these annuli of particles break-up and whether this break-up plays any role in the triggering of turbulence.
The variety of phenomena observed in particulate flows illustrates the numerous aspects of its transition to turbulence (starting with the difficulty of even distinguishing turbulent fluctuations from particle-induced ones). As such, our purpose in the context of the pipe flow shall be limited to the first step of investigating the linear stability of the particulate pipe flow to infinitesimal perturbations. Tackling this question requires the choice of a strategy to model particles (see Maxey (Reference Maxey2017) for a review on current methods). While the most accurate method consists of modelling particles as individual solids (Uhlmann Reference Uhlmann2005), this approach is the most computationally expensive and may not allow for consideration of a long enough pipe to cover long-wave instabilities. Cost-effective alternatives exist based on individual point-particle models (Squires & Eaton Reference Squires and Eaton1991; Ferrante & Elghobashi Reference Ferrante and Elghobashi2003) that can incorporate various levels of complexity (one- or two-way interaction, rotation of particles, particle interaction etc.). Another approach for the description of particulate flow is the averaging method, defining a suitable weighting function depending on the distance to the particle so that the particles variables can be expressed through a continuous function while the macro-scale properties of the particulate flow are preserved (Jackson Reference Jackson2000; Zhu & Yu Reference Zhu and Yu2002). This makes it possible, ideally, to simplify the problem while conserving all relevant information. The averaged system of equations is however not closed, so that a closure model is necessary; a wide array of closure problems have been developed to account for the flow characteristics and the nature of the problem (Elghobashi Reference Elghobashi1994; Jackson Reference Jackson2000). However, in the spirit of simplicity of this first step, we shall follow the even simpler option of modelling particles as a second fluid phase whose interaction with the fluid phase is limited to the drag forces that each phase exerts on the other (Saffman Reference Saffman1962; Klinkenberg et al. Reference Klinkenberg, de Lange and Brandt2011; Boronin Reference Boronin2012). Within this framework we address the questions of whether particulate pipe flow is stable for either homogeneous or inhomogeneous distributions of particles; which distributions of particles most adversely effect stability; and whether the distributions are realistic in comparison with experiments. The paper is organised as follow: in § 2, we shall introduce the model and the assumptions it relies on as well as the numerical methods used. We shall then start by considering the simplest case of a homogeneous particle distribution in the pipe (§ 3), before studying the linear stability of particles normally distributed around a radius, paying particular attention on how the standard deviation and the value of this radius influence the flow stability (§ 4). We then compare our findings to the experiments of Segré & Silberberg (Reference Segré and Silberberg1962) and Matas et al. (Reference Matas, Morris and Guazzelli2004b ) (§ 5), where localisation was observed before discussing the possible implications of our results for the transition to turbulence (§ 6).
2 Model and governing equations
In order to avoid the heavy computational cost incurred when accounting for particles as individual solids, we describe the particulate flow using the ‘two-fluid’ model first derived by Saffman (Reference Saffman1962). Particles are described as a continuous field rather than as discrete entities with a finite size. This model does not take into account effects due to particle–particle interactions, such as collisions or clustering, or the deflection of the flow around the particles. It is therefore valid for lower concentrations and in the limit where particles are sufficiently smaller than the characteristic scale of the flow.
We consider the flow of a fluid (density
 $\unicode[STIX]{x1D70C}_{f}$
, dynamic viscosity
 $\unicode[STIX]{x1D707}$
) through a straight pipe with constant circular cross-section of radius
 $r_{0}$
and driven by a constant pressure gradient. The fluid carries particles of radius
 $a$
. To describe the problem we adopt the model proposed by Saffman (Reference Saffman1962) and studied by Klinkenberg et al. (Reference Klinkenberg, de Lange and Brandt2011) and Boronin (Reference Boronin2012) in the context of channel flow, and Boronin & Osiptsov (Reference Boronin and Osiptsov2014) in a boundary layer.
The particles are considered as a continuous field with spatially varying number density
 $N$
, their motion coupled to the fluid solely via Stokes drag,
 $6\unicode[STIX]{x03C0}a\unicode[STIX]{x1D707}(\boldsymbol{u}_{\boldsymbol{p}}-\boldsymbol{u})$
. Other forces commonly considered (virtual mass, buoyancy, the Magnus force, the Saffman force and the Basset history) are all quadratic or above in particle radius and so can in general be neglected with the exception of the Saffman force, which may become significant if the background shear is large rather than
 $O(1)$
as here (Boronin & Osiptsov Reference Boronin and Osiptsov2008). Jackson (Reference Jackson2000) gives more details on the relative importance of the forces affecting the particles, it is argued that in the framework of an averaging method, the forces can be partitioned between the buoyancy forces and other forces, and that the pressure term needs to be modified to account for the pressure term. The Stokes drag however does not require a pressure compensation. In the limit of very small particles buoyancy and gravity can be neglected as they scale with
 $a^{3}$
whereas the Stokes drag scales with
 $a$
and dominates all other forces. Consequently, in the absence of buoyancy and gravity forces there is no need for a modification of the pressure gradient. In this context the model used in this work can be seen as a simplified version of Jackson’s approach in the limit of small particles where the partition of forces reduces to the part that does not include buoyancy (or gravity). The continuous model assumes small, heavy particles in a dilute suspension. While the model is ill suited to the study of turbulent flows since collisions and clustering are not taken into account, it retains validity for laminar flows and their perturbation and has been previously used to study the stability of shear flows (Boffetta et al.
Reference Boffetta, Celani, De Lillo and Musacchio2007; Boronin & Osiptsov Reference Boronin and Osiptsov2008; Klinkenberg et al.
Reference Klinkenberg, de Lange and Brandt2011). Details of a scaling argument outlining the conditions in which this approach is consistent are given in appendix A.
We take coordinates
 $(r,\unicode[STIX]{x1D703},z)$
with respective velocities
 $\boldsymbol{u}=(u,v,w)$
. Where relevant, we distinguish those quantities associated with the particles from those associated with the fluid by means of a subscript
 $p$
. After non-dimensionalising by the centreline velocity,
 $U_{0}$
, the pipe radius
 $r_{0}$
and the fluid density
 $\unicode[STIX]{x1D70C}_{f}$
we have the equations
 $$\begin{eqnarray}\displaystyle & \displaystyle \unicode[STIX]{x2202}_{t}\boldsymbol{u}+(\boldsymbol{u}\boldsymbol{\cdot }\unicode[STIX]{x1D735})\boldsymbol{u}=-\unicode[STIX]{x1D735}\boldsymbol{p}+\frac{1}{Re}\unicode[STIX]{x1D6FB}^{2}\boldsymbol{u}+\frac{f\hspace{0.2pt}N}{SRe}(\boldsymbol{u}_{\boldsymbol{p}}-\boldsymbol{u}), & \displaystyle\end{eqnarray}$$
 $$\begin{eqnarray}\displaystyle & \displaystyle \unicode[STIX]{x2202}_{t}\boldsymbol{u}_{\boldsymbol{p}}+(\boldsymbol{u}_{\boldsymbol{p}}\boldsymbol{\cdot }\unicode[STIX]{x1D735})\boldsymbol{u}_{\boldsymbol{p}}=\frac{1}{SRe}(\boldsymbol{u}-\boldsymbol{u}_{\boldsymbol{p}}), & \displaystyle\end{eqnarray}$$
 $$\begin{eqnarray}\displaystyle & \unicode[STIX]{x2202}_{t}N=-\unicode[STIX]{x1D735}\boldsymbol{\cdot }(N\boldsymbol{u}_{\boldsymbol{p}}), & \displaystyle\end{eqnarray}$$
 $$\begin{eqnarray}\displaystyle & \unicode[STIX]{x1D735}\boldsymbol{\cdot }\boldsymbol{u}=0. & \displaystyle\end{eqnarray}$$
Non-dimensional governing parameters are the Reynolds number
 $Re=U_{0}r_{0}\unicode[STIX]{x1D70C}_{f}/\unicode[STIX]{x1D707}$
, the dimensionless relaxation time
 $S=2a^{2}\unicode[STIX]{x1D70C}_{p}/9r_{0}^{2}\unicode[STIX]{x1D70C}_{f}$
and mass concentration
 $f=m_{p}/m_{f}$
, the ratio between the particle and fluid mass over the entire pipe. Here
 $N$
is normalised so that
 $\int \,\text{d}V=1$
. For a given position
 $\boldsymbol{x}$
,
 $N(\boldsymbol{x})>1$
implies than the local concentration of particles is higher than the pipe average,
 $N(\boldsymbol{x})<1$
implies the opposite. These equations are augmented with an impermeable and no-slip boundary condition for the fluid
 $$\begin{eqnarray}\boldsymbol{u}|_{r=1}=0\end{eqnarray}$$
and a no-penetration boundary condition for the radial velocity of the particles
 $$\begin{eqnarray}u_{p}|_{r=1}=0.\end{eqnarray}$$
The stability of the flow is studied through the addition of a small perturbation to the steady solution (
 $\boldsymbol{U}=\boldsymbol{U}_{p}=(1-r^{2})\hat{\boldsymbol{z}}$
)
 $$\begin{eqnarray}\boldsymbol{u}=\boldsymbol{U}+\boldsymbol{u}^{\prime },\quad \boldsymbol{u}_{\boldsymbol{ p}}=\boldsymbol{U}+\boldsymbol{u}_{\boldsymbol{p}}^{\prime },\quad p=P+p^{\prime },\quad N=N_{0}+N^{\prime }.\end{eqnarray}$$
Linearising (2.1)–(2.4) around this base state and dropping the primes gives
 $$\begin{eqnarray}\displaystyle & \displaystyle \unicode[STIX]{x2202}_{t}\boldsymbol{u}+\boldsymbol{U}\boldsymbol{\cdot }\unicode[STIX]{x1D735}\boldsymbol{u}+\boldsymbol{u}\boldsymbol{\cdot }\unicode[STIX]{x1D735}\boldsymbol{U}=-\unicode[STIX]{x1D735}\boldsymbol{p}+\frac{1}{Re}\unicode[STIX]{x1D6FB}^{2}\boldsymbol{u}+\frac{f\hspace{0.2pt}N_{0}}{SRe}(\boldsymbol{u}_{\boldsymbol{p}}-\boldsymbol{u}), & \displaystyle\end{eqnarray}$$
 $$\begin{eqnarray}\displaystyle & \displaystyle \unicode[STIX]{x2202}_{t}\boldsymbol{u}_{\boldsymbol{p}}+\boldsymbol{u}_{\boldsymbol{p}}\boldsymbol{\cdot }\unicode[STIX]{x1D735}\boldsymbol{U}+\boldsymbol{U}\boldsymbol{\cdot }\unicode[STIX]{x1D735}\boldsymbol{u}_{\boldsymbol{p}}=\frac{1}{SRe}(\boldsymbol{u}-\boldsymbol{u}_{\boldsymbol{p}}), & \displaystyle\end{eqnarray}$$
 $$\begin{eqnarray}\displaystyle & \unicode[STIX]{x2202}_{t}N=-N_{0}\unicode[STIX]{x1D735}\boldsymbol{\cdot }\boldsymbol{u}_{\boldsymbol{p}}-\boldsymbol{u}_{\boldsymbol{p}}\boldsymbol{\cdot }\unicode[STIX]{x1D735}N_{0}-\boldsymbol{U}\boldsymbol{\cdot }\unicode[STIX]{x1D735}N, & \displaystyle\end{eqnarray}$$
 $$\begin{eqnarray}\displaystyle & \unicode[STIX]{x1D735}\boldsymbol{\cdot }\boldsymbol{u}=0. & \displaystyle\end{eqnarray}$$
The boundary conditions for the perturbation are the same as for the full flow. We note that (2.8) is only dependent on
 $N_{0}$
, so that (2.10) is decoupled from the rest of the problem.
2.1 Numerical method
Given the streamwise and azimuthal invariance of the problem, we consider perturbations of the form
 $$\begin{eqnarray}g(r,\unicode[STIX]{x1D703},z,t)=\mathop{\sum }_{n=0}^{N}g_{n}T_{n}(r)\exp \{\text{i}(\unicode[STIX]{x1D6FC}z+m\unicode[STIX]{x1D703}-\unicode[STIX]{x1D714}t)\},\end{eqnarray}$$
 $T_{n}$
is the
 $n$
th Chebyshev polynomial,
 $\unicode[STIX]{x1D6FC}$
and
 $m$
are the streamwise and azimuthal wavenumbers respectively and
 $g$
is any of the fields of interest. Substituting this into (2.8)–(2.11) and boundary conditions (2.5) and (2.6) leads, after collocation, to a generalised eigenvalue problem
 $$\begin{eqnarray}\text{i}\unicode[STIX]{x1D714}\boldsymbol{A}\unicode[STIX]{x1D719}=\boldsymbol{B}\unicode[STIX]{x1D719},\end{eqnarray}$$
which can be solved using LAPACK for the eigenvalue
 $\unicode[STIX]{x1D714}$
and coefficients
 $g_{n}$
.
The code was validated for the case of non-particulate pipe flow against Meseguer & Trefethen (Reference Meseguer and Trefethen2003) and for particulate flow in a channel against Klinkenberg et al. (Reference Klinkenberg, de Lange and Brandt2011). With 100 Chebyshev polynomials per field, the relative error remains below
 $10^{-7}$
for the various tested combinations of values of
 $\unicode[STIX]{x1D6FC}\leqslant 1$
,
 $m\leqslant 1$
and
 $Re<10^{4}$
. With the addition of particles, the precision dropped to
 $10^{-6}$
for
 $S=10^{-3}$
and down to
 $10^{-5}$
for
 $S=0.1$
, with as many as 200 polynomials.
To further test all cases, we created a linear simulation code based on the non-particulate direct numerical simulation code of Willis (Reference Willis2017). This code uses Fourier modes in the axial and azimuthal directions, and finite differences radially. This allowed us to check the leading eigenvalue of each different Fourier mode for any given configuration. Accuracy between the methods was confirmed to be within 1 %.
3 Uniform particle distribution
Previous work on this model (Klinkenberg et al.
Reference Klinkenberg, de Lange and Brandt2011) has made the assumption that the initial distribution of particles is uniform throughout the domain. This simplifies the governing equations as
 $\unicode[STIX]{x1D735}N_{0}=0$
, removing a term from (2.10). We consider values of
 $f$
ranging from 0 to 0.1, since the particles considered are much heavier than the fluid, this implies that the maximal volume concentration is below 1 % so that the particulate flow is dilute. The values of
 $S$
used in this work range from
 $S=10^{-4}$
to
 $S=10^{-1}$
, assuming the density ratio between the particles and fluid
 $\unicode[STIX]{x1D70C}_{p}/\unicode[STIX]{x1D70C}_{f}$
to be 1600 (corresponding to the ratio between air and sand) as an example. This corresponds to particle/pipe ratio ranging from approximately
 $5\times 10^{-4}$
to
 $1.5\times 10^{-2}$
, with the majority of the results obtained for
 $S=10^{-3}$
corresponding to a size ratio
 $a\approx 1.5\times 10^{-3}$
. The ranges of volume ratio and particle size considered in this work fall within the assumptions of dilute suspension with small particles made by the model.
3.1 Modified eigenvalue spectrum
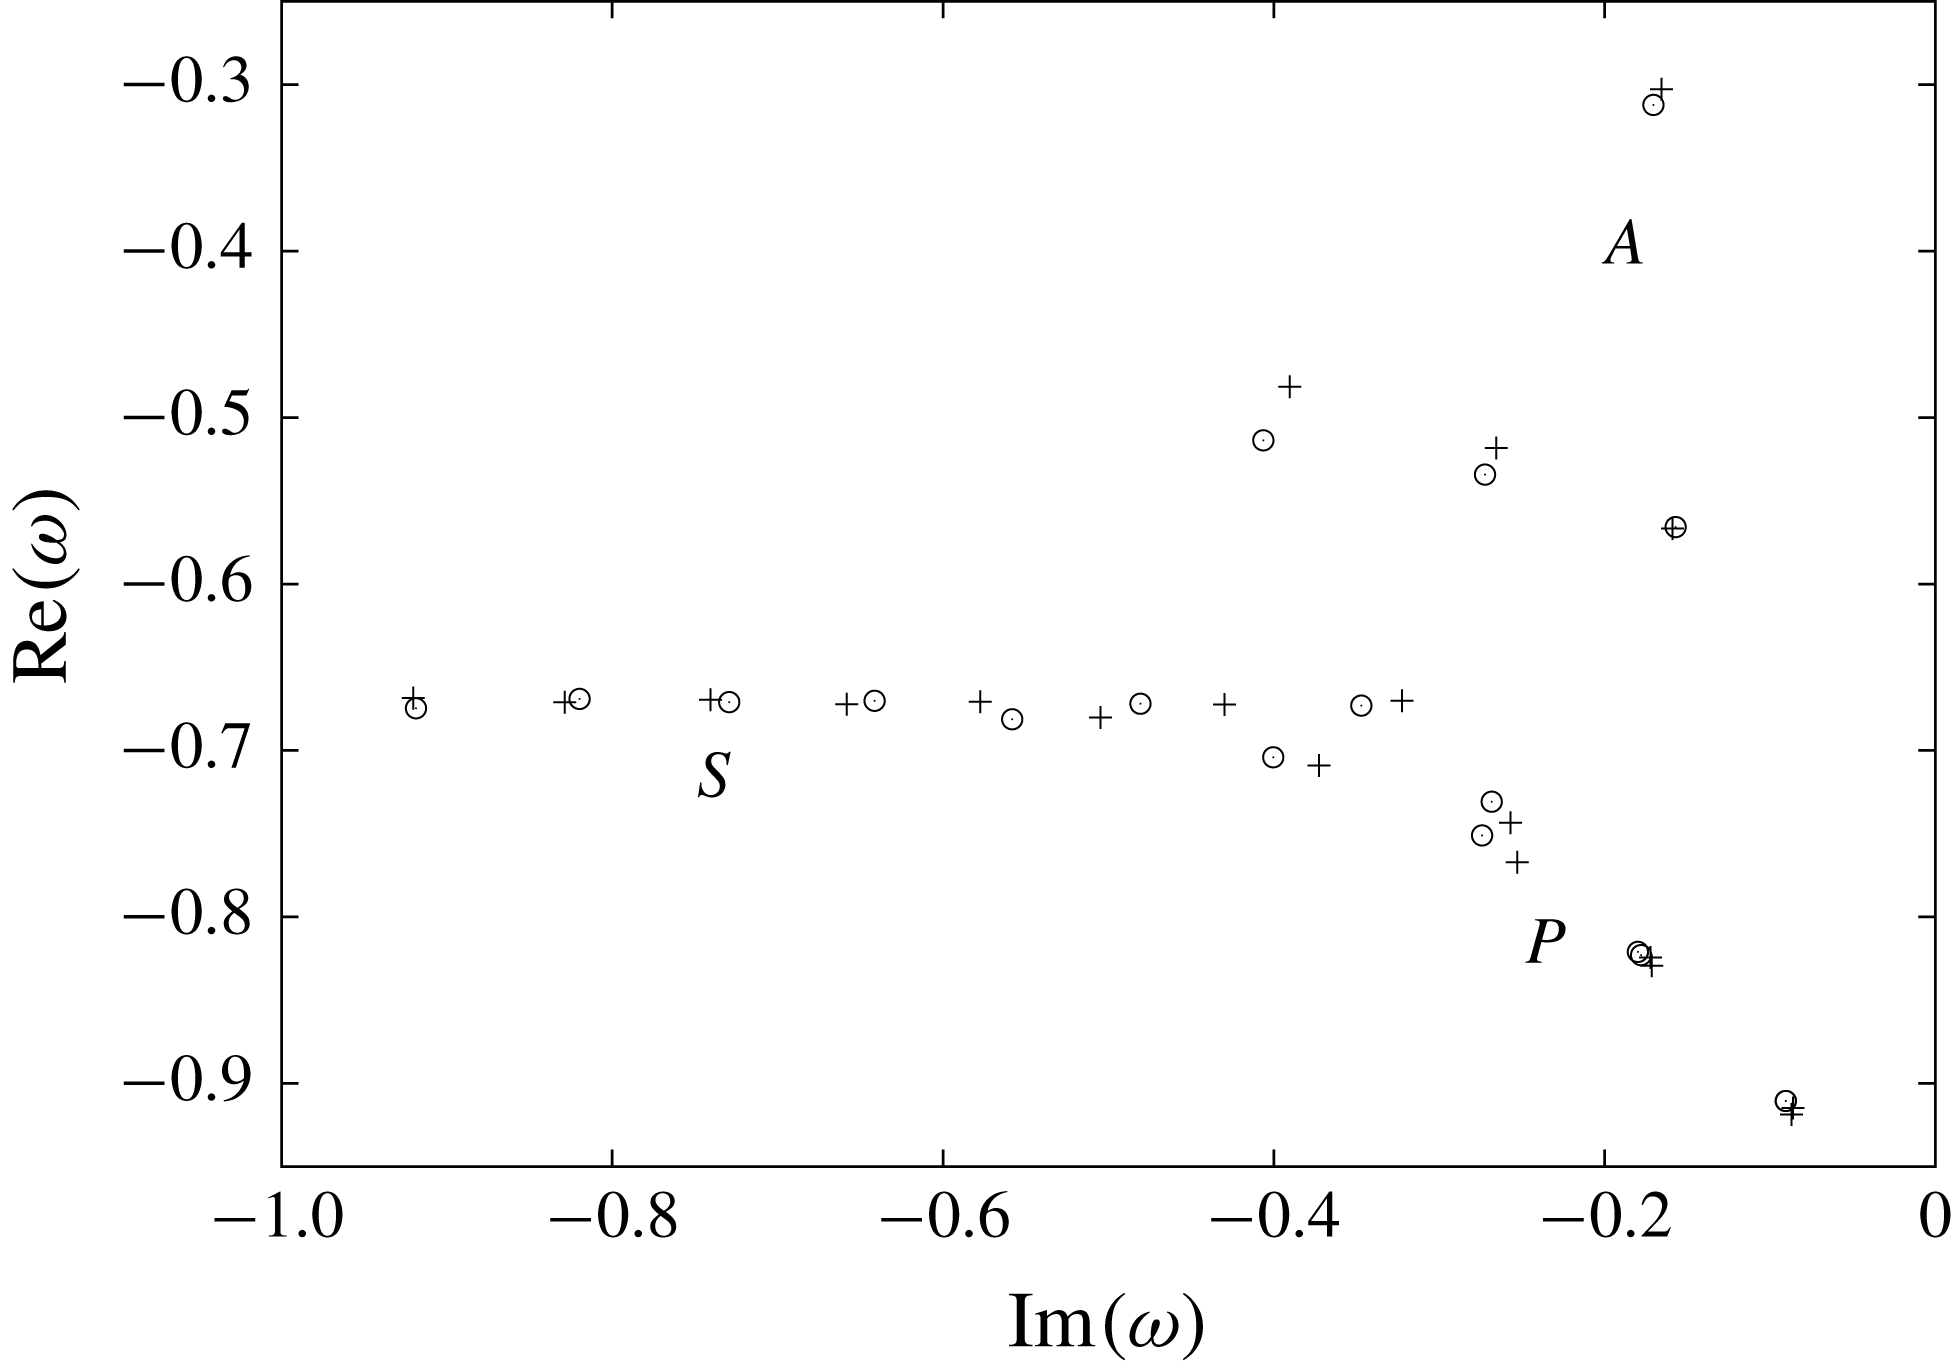
The addition of uniformly distributed particles does not lead to large changes in the stability problem of pipe flow. Figure 1 compares the eigenvalue spectra of the particulate and non-particulate problems for one typical case. The overall shape of the spectrum is qualitatively unchanged, maintaining three branches, the location of the leading eigenvalue being at the tip of the ‘P’-branch (Mack Reference Mack1976).
Eigenvalue spectra for the generalised eigenvalue problem (2.13) for
 $Re=1000$
,
 $S=10^{-3}$
,
 $\unicode[STIX]{x1D6FC}=1$
,
 $f=0.1$
. The classical single phase eigenvalues are marked ‘
 $+$
’ while the eigenvalues for the particulate flow are marked ‘○’. The three branches of the eigenspectrum are labelled
 $A$
,
 $P$
and
 $S$
in accordance with the notation of Mack (Reference Mack1976).

We quantify the change in the eigenvalue spectrum by tracking the normalised growth rate
 $$\begin{eqnarray}\unicode[STIX]{x1D706}_{p}^{\prime }(Re,\unicode[STIX]{x1D6FC},m,f,S)=\frac{\text{Im}\{\unicode[STIX]{x1D714}_{p}(Re,\unicode[STIX]{x1D6FC},m,f,S)\}}{\text{Im}\{\unicode[STIX]{x1D714}_{f}(Re,\unicode[STIX]{x1D6FC},m)\}},\end{eqnarray}$$
where
 $\unicode[STIX]{x1D714}_{p}$
and
 $\unicode[STIX]{x1D714}_{f}$
are the leading eigenvalues in the particulate and non-particulate problems. From the definition (2.12) the growth rate is the imaginary part of the eigenvalue. As the pure-fluid problem is linearly stable (meaning
 $\text{Im}\{\unicode[STIX]{x1D714}_{f}\}$
is always negative),
 $\unicode[STIX]{x1D706}_{p}^{\prime }>1$
is indicative of the particles stabilising the flow while
 $\unicode[STIX]{x1D706}_{p}^{\prime }<1$
corresponds to them destabilising the flow. The critical value
 $\unicode[STIX]{x1D706}_{p}^{\prime }=0$
would indicate the particulate problem crossing the neutral stability threshold, however this was never observed for any parameter combination with a uniform distribution of particles.
The parameter space is simplified by the observation that the role of
 $f$
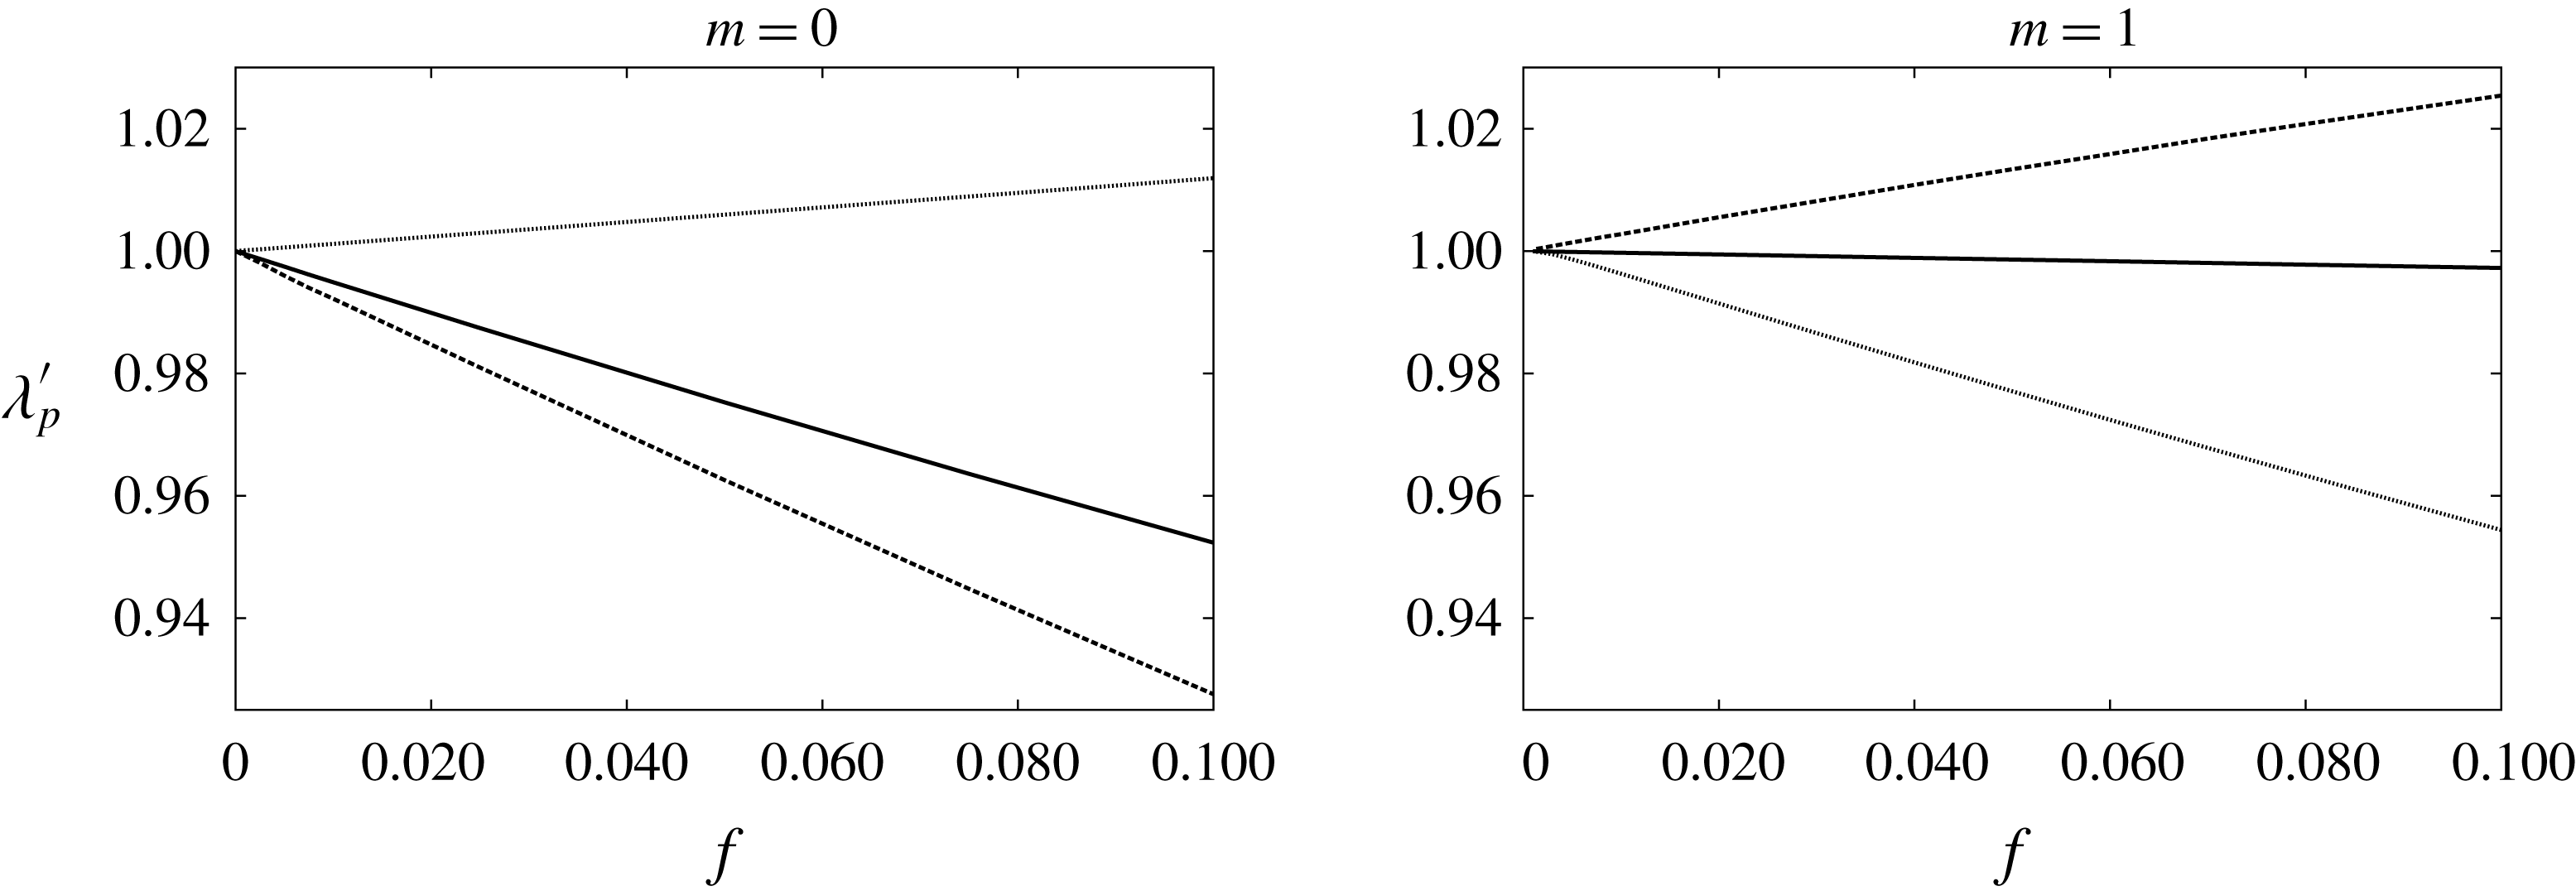
, the concentration, seems to be secondary. Figure 2 shows
 $\unicode[STIX]{x1D706}_{p}^{\prime }$
as a function of
 $f$
and in all cases the concentration serves simply to amplify the underlying result almost linearly. Consequently, in the analysis of the uniform particle distribution problem we fix
 $f=0.01$
in the knowledge that trends could be exacerbated further by increasing the quantity.
Normalised growth rate,
 $\unicode[STIX]{x1D706}_{p}^{\prime }$
, as a function of
 $f$
for
 $S=10^{-3}$
(line),
 $S=10^{-2}$
(dots),
 $S=10^{-1}$
(dashed) with
 $Re=1000$
,
 $\unicode[STIX]{x1D6FC}=1$
. In all cases examined,
 $\unicode[STIX]{x1D706}_{p}^{\prime }$
is very close to being proportional to
 $f$
, suggesting that this parameter simply serves to amplify the underlying result linearly.

3.2 Influence of the dimensionless relaxation time
The dimensionless relaxation time
 $S$
reflects the inertia, and hence size of the particles. It is most easily understood in terms of its limiting values. In the ballistic limit,
 $S\rightarrow \infty$
the large particles become independent of the flow. In the other extreme,
 $S\rightarrow 0$
, the particles are passive tracers. In neither case do the particles unduly influence the flow. In the former, they fully decouple and one recovers the pure-fluid results. In the latter case, the particles act as one with the fluid, only changing the effective density of the total suspension. This rescales the effective Reynolds number as
 $Re^{\prime }=(1+f)Re$
(Klinkenberg et al.
Reference Klinkenberg, de Lange and Brandt2011).
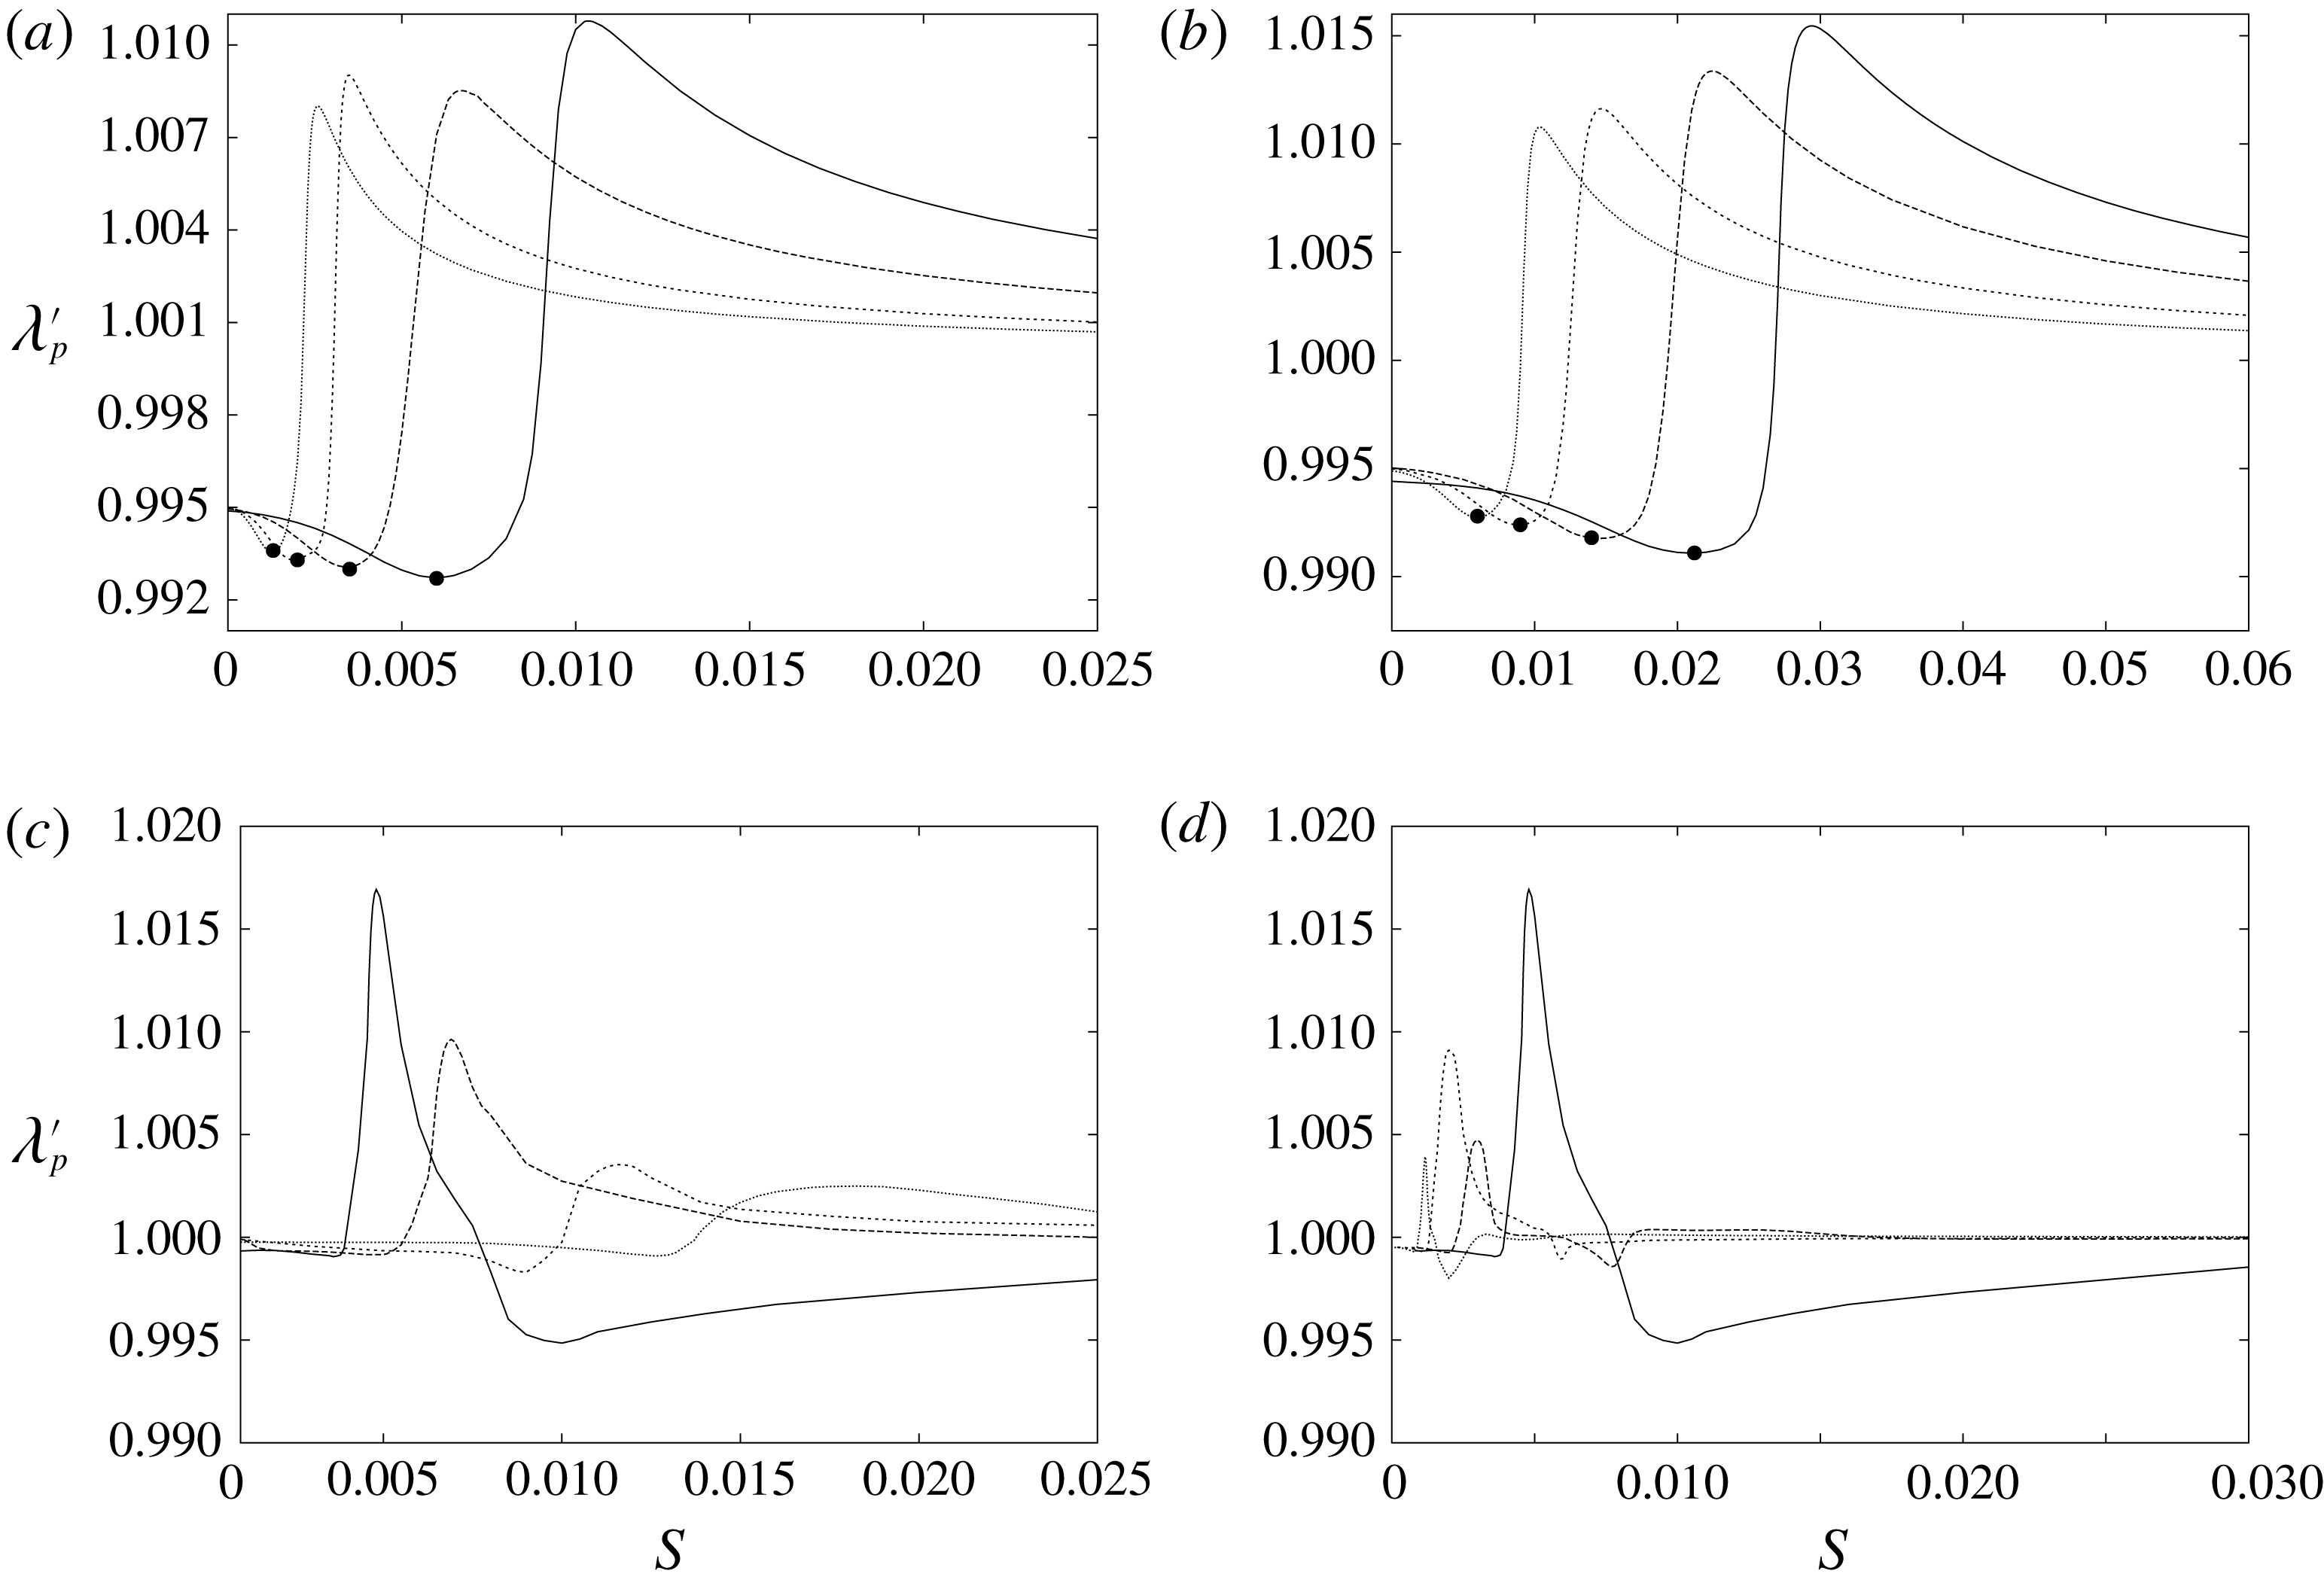
Between these two extreme limits, non-trivial changes occur to the leading eigenvalue. For
 $m=0$
the behaviour is readily described. In figure 3(a,c),
 $\unicode[STIX]{x1D706}_{p}^{\prime }$
smoothly varies from less stable (
 $\unicode[STIX]{x1D706}_{p}^{\prime }\simeq 0.995$
for
 $S=0$
) to unaffected (
 $\unicode[STIX]{x1D706}_{p}^{\prime }=1$
for
 $S\rightarrow \infty$
), it does not do so monotonically. In particular, it initially decreases the stability of the flow, then over stabilises the flow past the level of a pure fluid before it subsides to the particle-free result. This occurs for all
 $Re$
and
 $\unicode[STIX]{x1D6FC}$
considered.
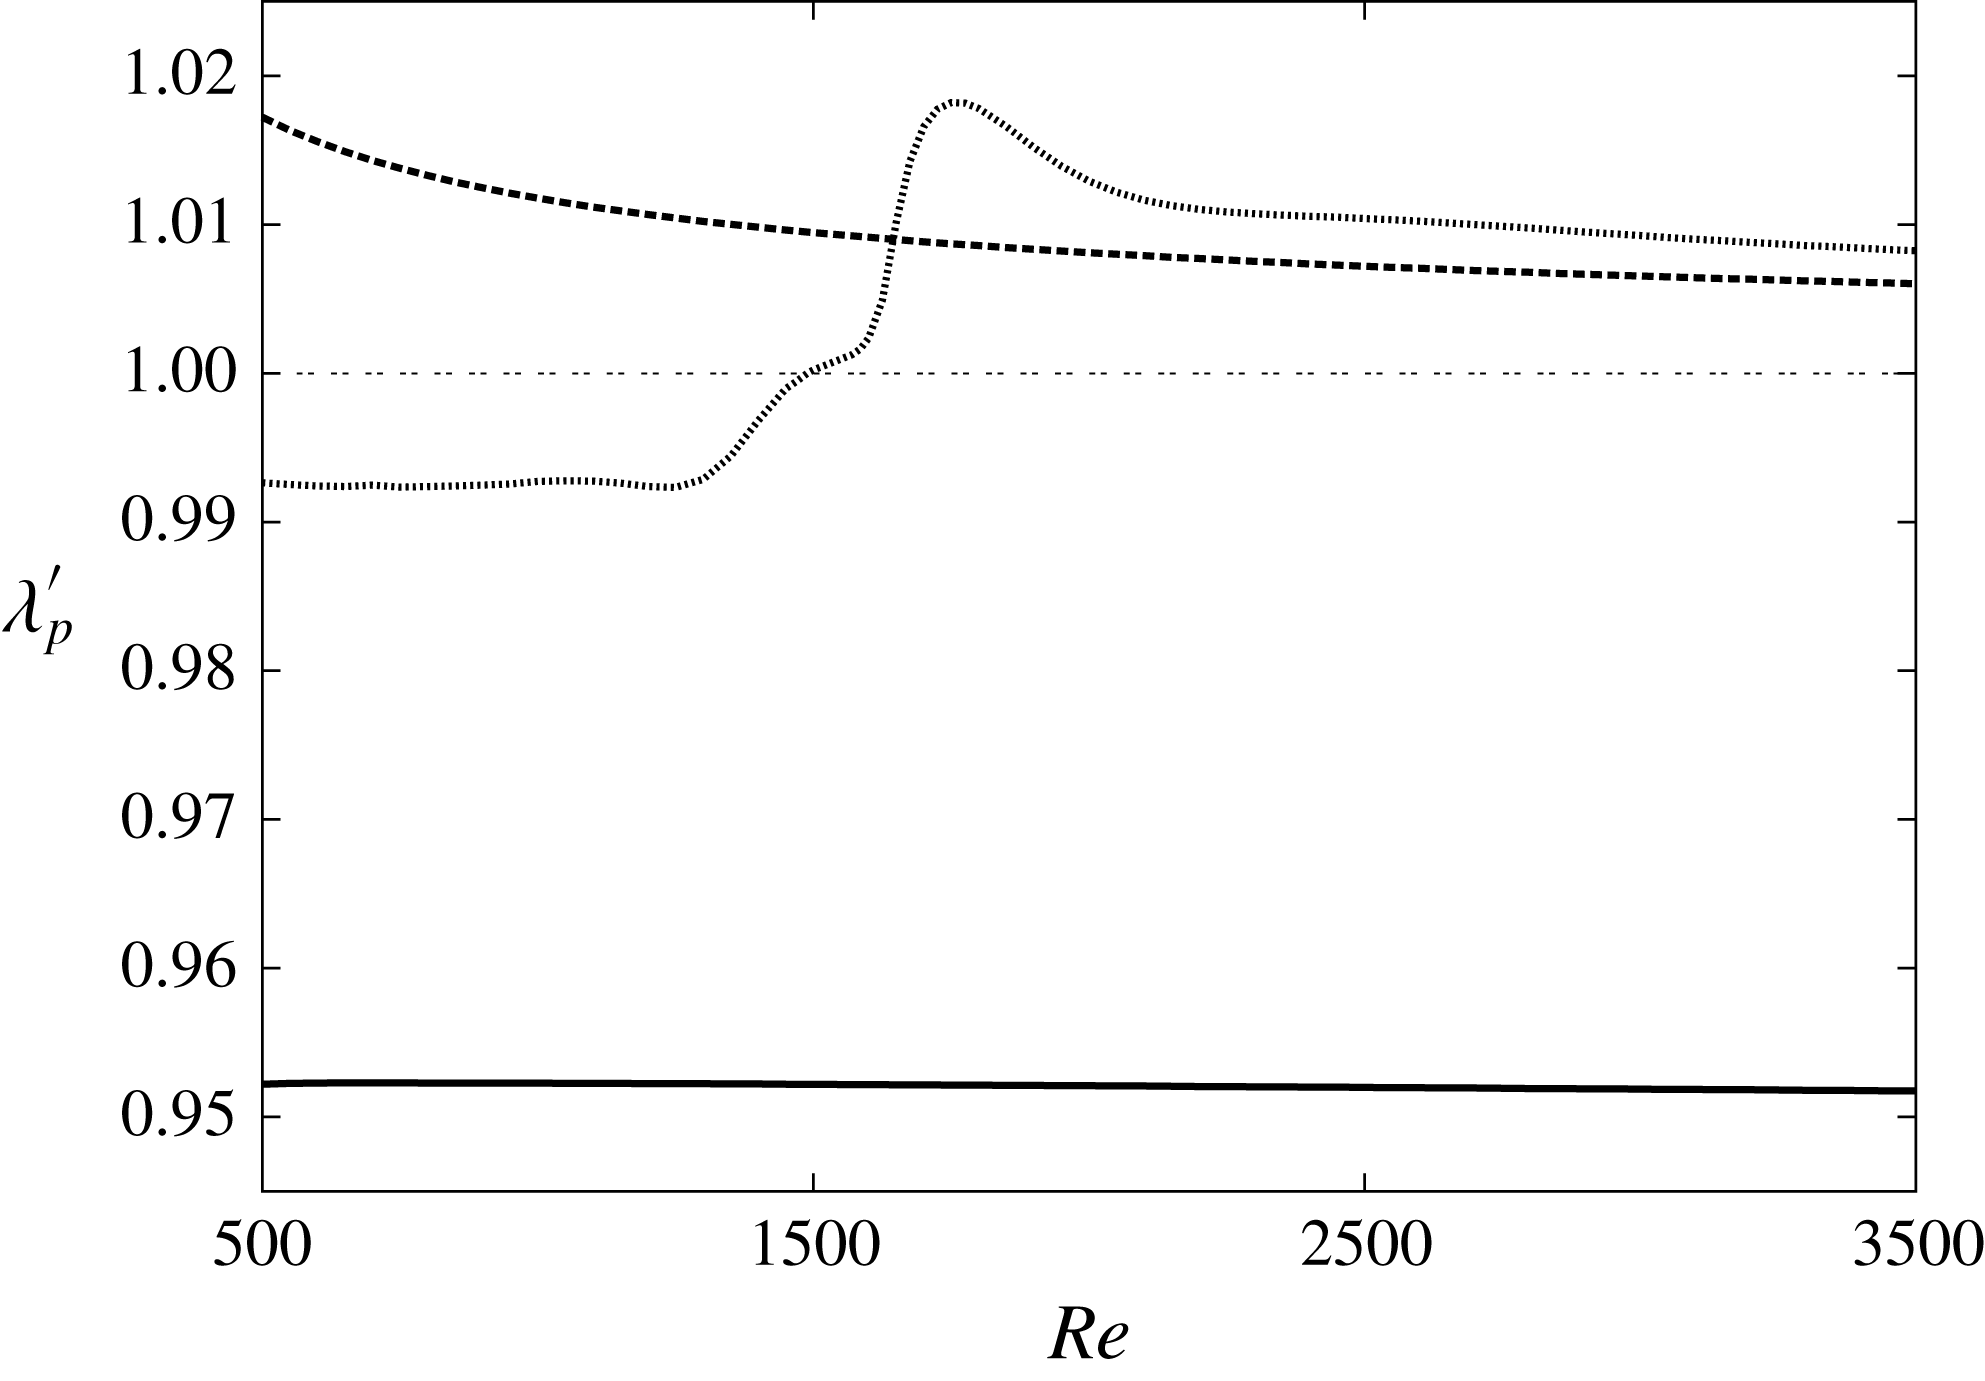
This result is clarified further by fixing
 $S$
and varying
 $Re$
, as in figure 4. For low values of
 $S$
(here
 $10^{-3}$
) the stability remains effectively unchanged at these Reynolds numbers with the particles remaining as passive tracers. For large dimensionless relaxation times (
 $S=0.1$
) there is some variation of
 $\unicode[STIX]{x1D706}_{p}^{\prime }$
with
 $Re$
, but it is relatively benign as the particles decouple from the flow. It is only at intermediate relaxation times (
 $S=0.01$
) that we see non-trivial behaviour for moderate Reynolds number.
Normalised leading growth rate,
 $\unicode[STIX]{x1D706}_{p}^{\prime }$
, as a function of
 $S$
while keeping
 $f=0.01$
. (a,b) is
 $m=0$
, (c,d) is
 $m=1$
. In all cases we see that for low dimensionless relaxation times we recover the result of a single fluid, albeit of larger effective density. For large
 $S$
the particulate eigenvalue tends towards that of the non-particulate case and hence
 $\unicode[STIX]{x1D706}_{p}^{\prime }\rightarrow 1$
. For
 $m=0$
, in each case there is a clearly defined
 $S^{m}$
(marked ●) for which
 $\unicode[STIX]{x1D706}_{p}^{\prime }$
is minimised and the flow is least stable. (a,c) Fixed
 $\unicode[STIX]{x1D6FC}=2$
and
 $Re=1000$
(line), 3000 (dashed), 10 000 (short dashed), 20 000 (dots). There is no qualitative change in behaviour, but the value of
 $S$
for which the effect of the particles changes from destabilising to stabilising reduces with
 $Re$
. (b,d) Fixed
 $Re=1000$
and
 $\unicode[STIX]{x1D6FC}=0.2$
(line), 0.4 (dashed), 1 (short dashed), 2 (dots). Again there is no qualitative change with
 $\unicode[STIX]{x1D6FC}$
but the region of
 $S$
where the effect changes from destabilising to stabilising decreases with
 $\unicode[STIX]{x1D6FC}$
.

Normalised leading growth rate,
 $\unicode[STIX]{x1D706}_{p}^{\prime }$
for
 $m=0$
as a function of
 $Re$
, for
 $S=10^{-3}$
(line),
 $S=10^{-2}$
(dots),
 $S=10^{-1}$
(dashed) with
 $f=0.01$
,
 $\unicode[STIX]{x1D6FC}=1$
. While the largest and smallest values of
 $S$
present straightforward, monotonic behaviour, the intermediate value
 $S=0.01$
presents non-trivial variation with the Reynolds number.

The case of
 $m=1$
is more complex (figure 3,c,d). The limiting cases of very large or very small
 $S$
still behave as expected (although now even smaller values of
 $S$
must be considered to recover the limiting case) but the intermediate behaviour is more involved. The particles can either stabilise or destabilise the flow depending on the precise parameters chosen. For a given
 $Re$
and
 $\unicode[STIX]{x1D6FC}$
, increasing
 $S$
can lead to the flow switching between one and the other.
We conclude this section by noting that the behaviour of the relative growth rate for
 $m=0$
suggests we may be able to isolate a simple scaling law. To identify the region in which particles have the most significant effect on the flow, we define
 $S^{m}$
to be the dimensionless relaxation time for which the flow is most destabilised and
 $\unicode[STIX]{x1D706}_{p}^{\prime }$
is minimised. Least squares fitting suggests a clear scaling of
 $S^{m}$
with both
 $Re$
and
 $\unicode[STIX]{x1D6FC}$
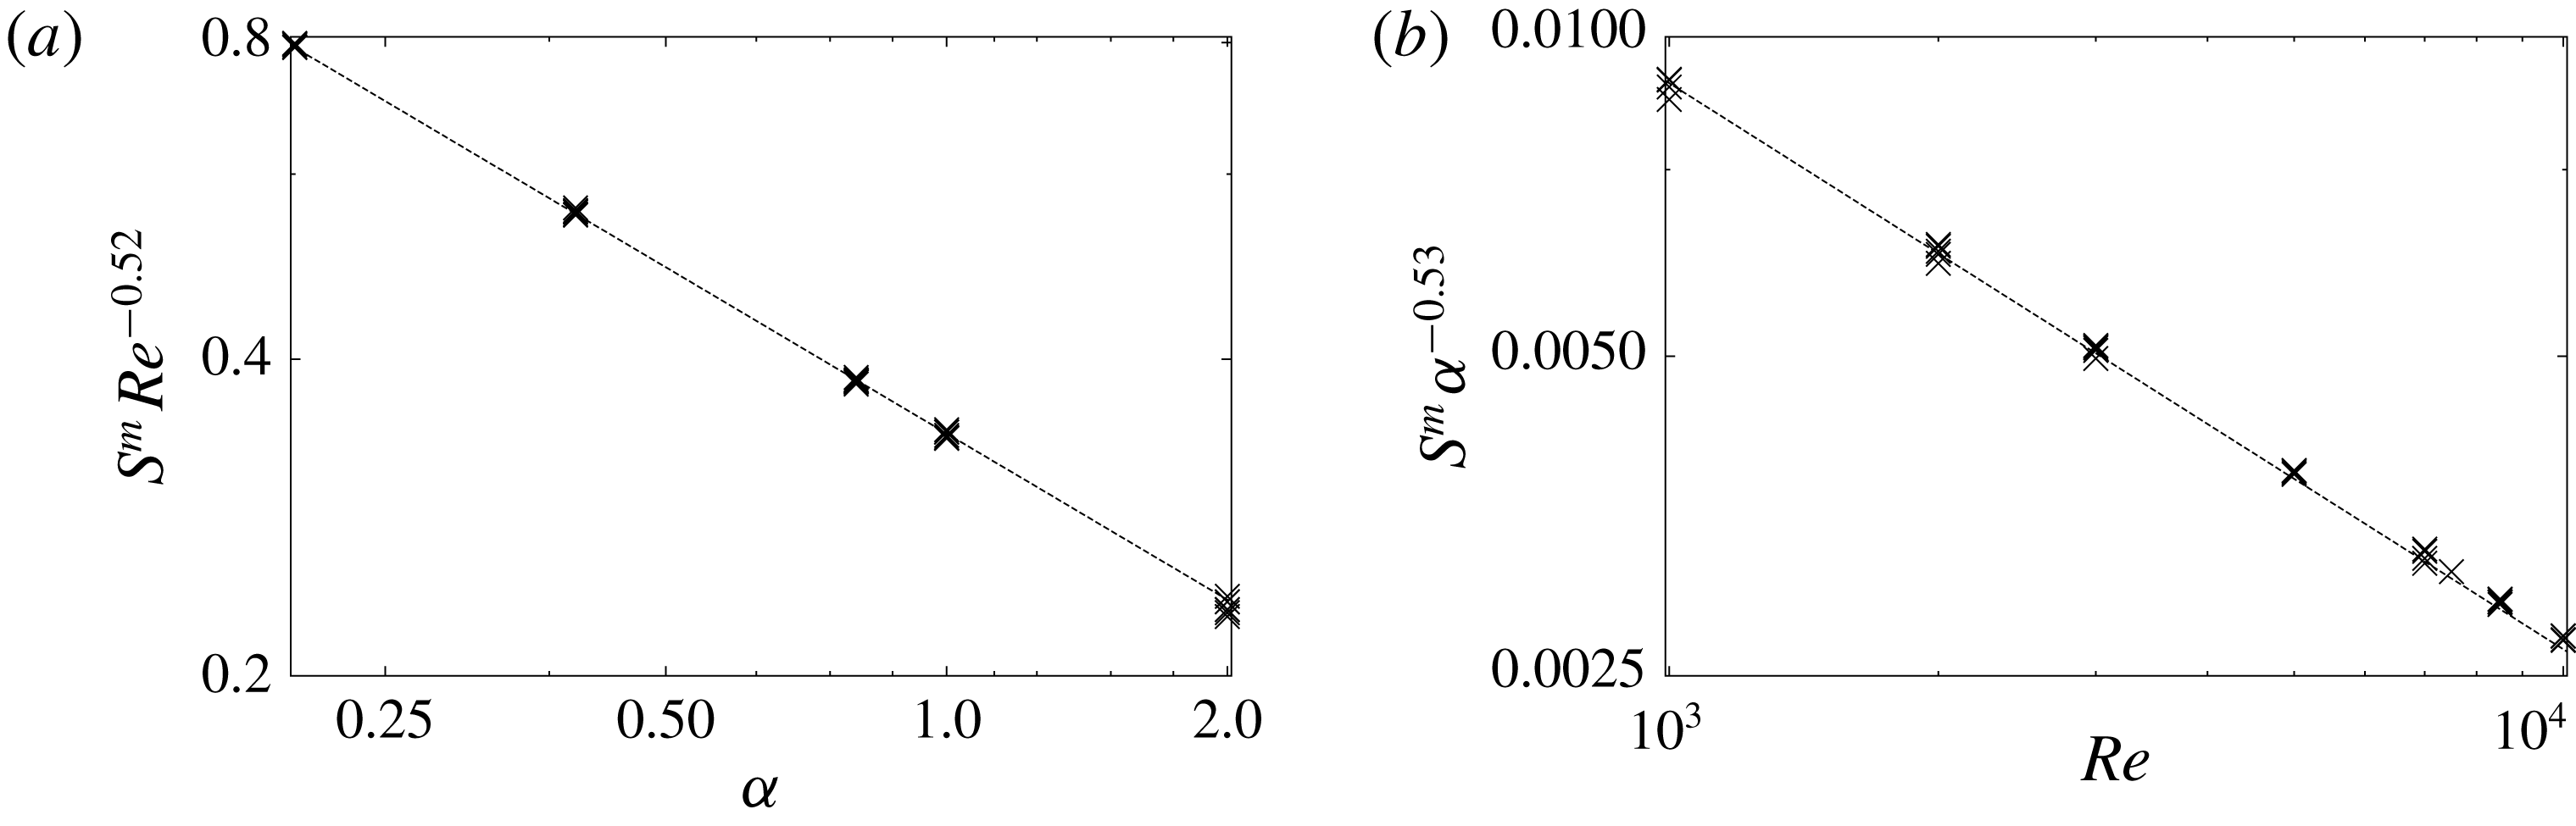
as shown in figure 5. No such scaling was observed for
 $m=1$
.
While the influence of particles is somewhat unsurprisingly amplified at larger Reynolds number, it mostly concerns longer wavelengths and remains limited in amplitude in all cases (we never found an increase of growth rate more than 2 % higher than the single-fluid case).
Variations of
 $S^{m}$
with
 $Re$
and
 $\unicode[STIX]{x1D6FC}$
. The data can be collapsed onto a single line by using an appropriate rescaling. (a)
 $S^{m}Re^{-0.52}$
(exponent given to two significant figures) as a function of
 $\unicode[STIX]{x1D6FC}$
. The collapse of the data onto close to a single line suggests
 $S^{m}\propto Re^{0.52}$
. (b)
 $S^{m}\unicode[STIX]{x1D6FC}^{-0.53}$
as a function of
 $Re$
. The data again collapse onto a single line, although not as cleanly as for the scaling in
 $Re$
. Nonetheless, this suggests
 $S^{m}\propto \unicode[STIX]{x1D6FC}^{-0.53}$
.

4 Non-uniform particle distributions
There is nothing inherent in the model which requires the initial distribution of particles to be uniform (Boronin Reference Boronin2012). Relaxing this assumption allows us to consider a more general problem. As discussed in the introduction, experimental work suggests that for low to moderate Reynolds numbers neutrally buoyant particles congregate at a particular radius forming an annulus from their distribution centred in the region
 $r=0.5{-}0.8$
. In this section we capture the essence of this by considering distributions of the form
 $$\begin{eqnarray}N_{0}(r)={\tilde{N}}\exp \{-(r-r_{d})^{2}/2\unicode[STIX]{x1D70E}^{2}\},\end{eqnarray}$$
with
 ${\tilde{N}}$
chosen such that
 $\int _{0}^{1}N_{0}(r)\,\text{d}r=1$
.
Throughout this section we keep
 $S=10^{-3}$
,
 $f=0.1$
and
 $m=1$
fixed to reduce the space of parameters being considered. The first two of these are consistent with experimentally realisable parameters (see § 5) while
 $m=1$
is the only azimuthal wavenumber for which we observed instability.
4.1 The onset of instability
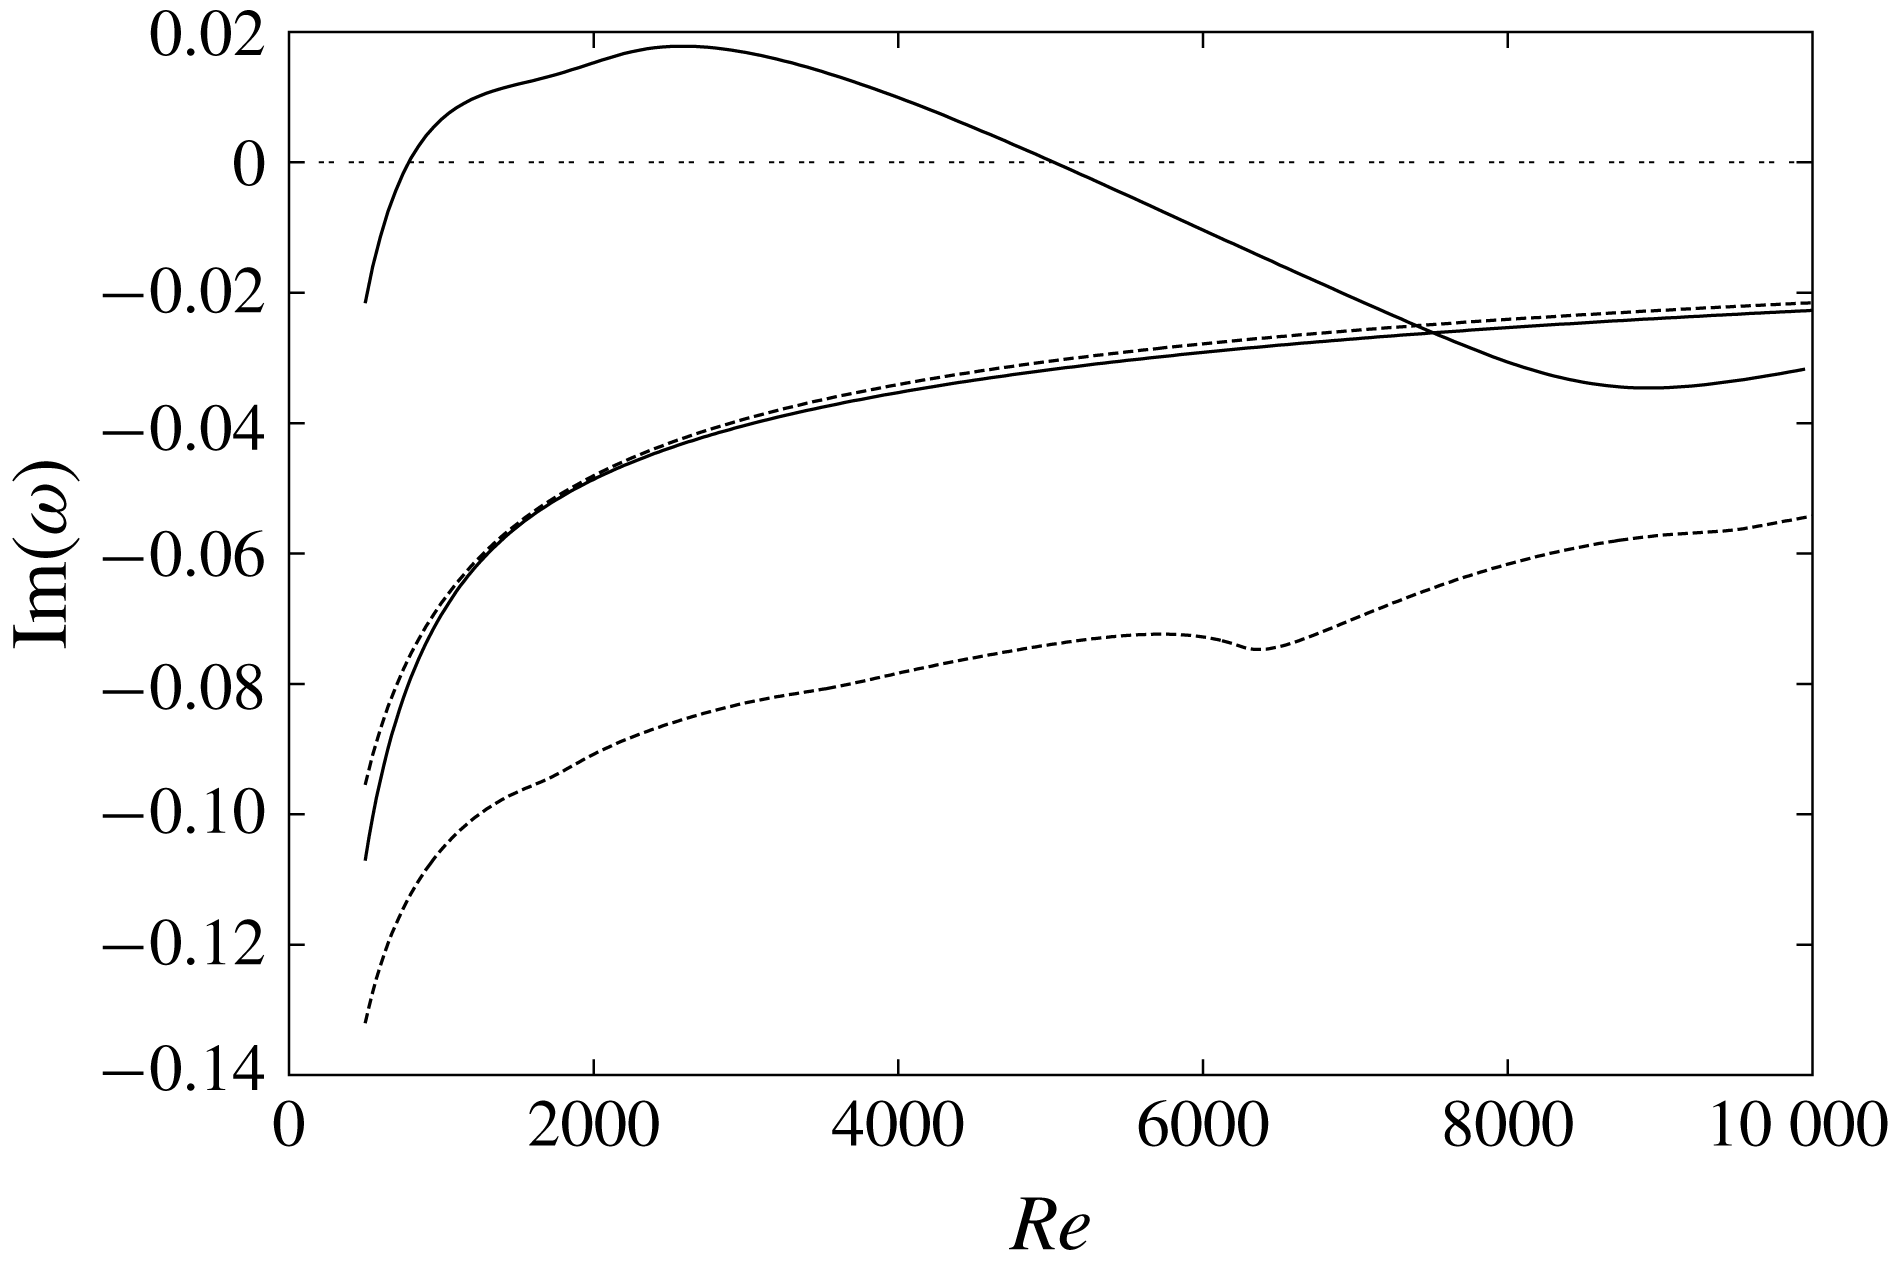
As soon as the assumption of uniform particle distribution is relaxed we see a linear instability occurring. Figure 6 shows the leading eigenvalues for a localised distribution of particles compared with the uniform distribution result. Whereas the latter of these remains stable for all
 $Re$
, the non-uniform distribution is unstable. Of particular note is that we see instability for moderate Reynolds number, but not for either high or low
 $Re$
. This initially surprising observation that the flow restabilises as
 $Re$
increases is a recurrent observation. For very large
 $Re$
, there is no coupling between the fields and everything is stable. For low
 $Re$
, viscous diffusion dominates and imposes stability. Only in the middle is instability possible.
The leading eigenvalues for uniform (dashed) and non-uniform particle distributions, centred at
 $r=0.6$
(solid). The uniform distribution is stable for all
 $Re$
, but the non-uniform distribution is unstable for a range of
 $Re$
. For higher
 $Re$
the leading eigenmode switches between A and P branches for the non-uniform distributions at
 $Re\simeq 7500$
.

For higher
 $Re$
, after the flow has restabilised we observe a switching of the leading eigenmode (at around
 $Re=6000{-}8000$
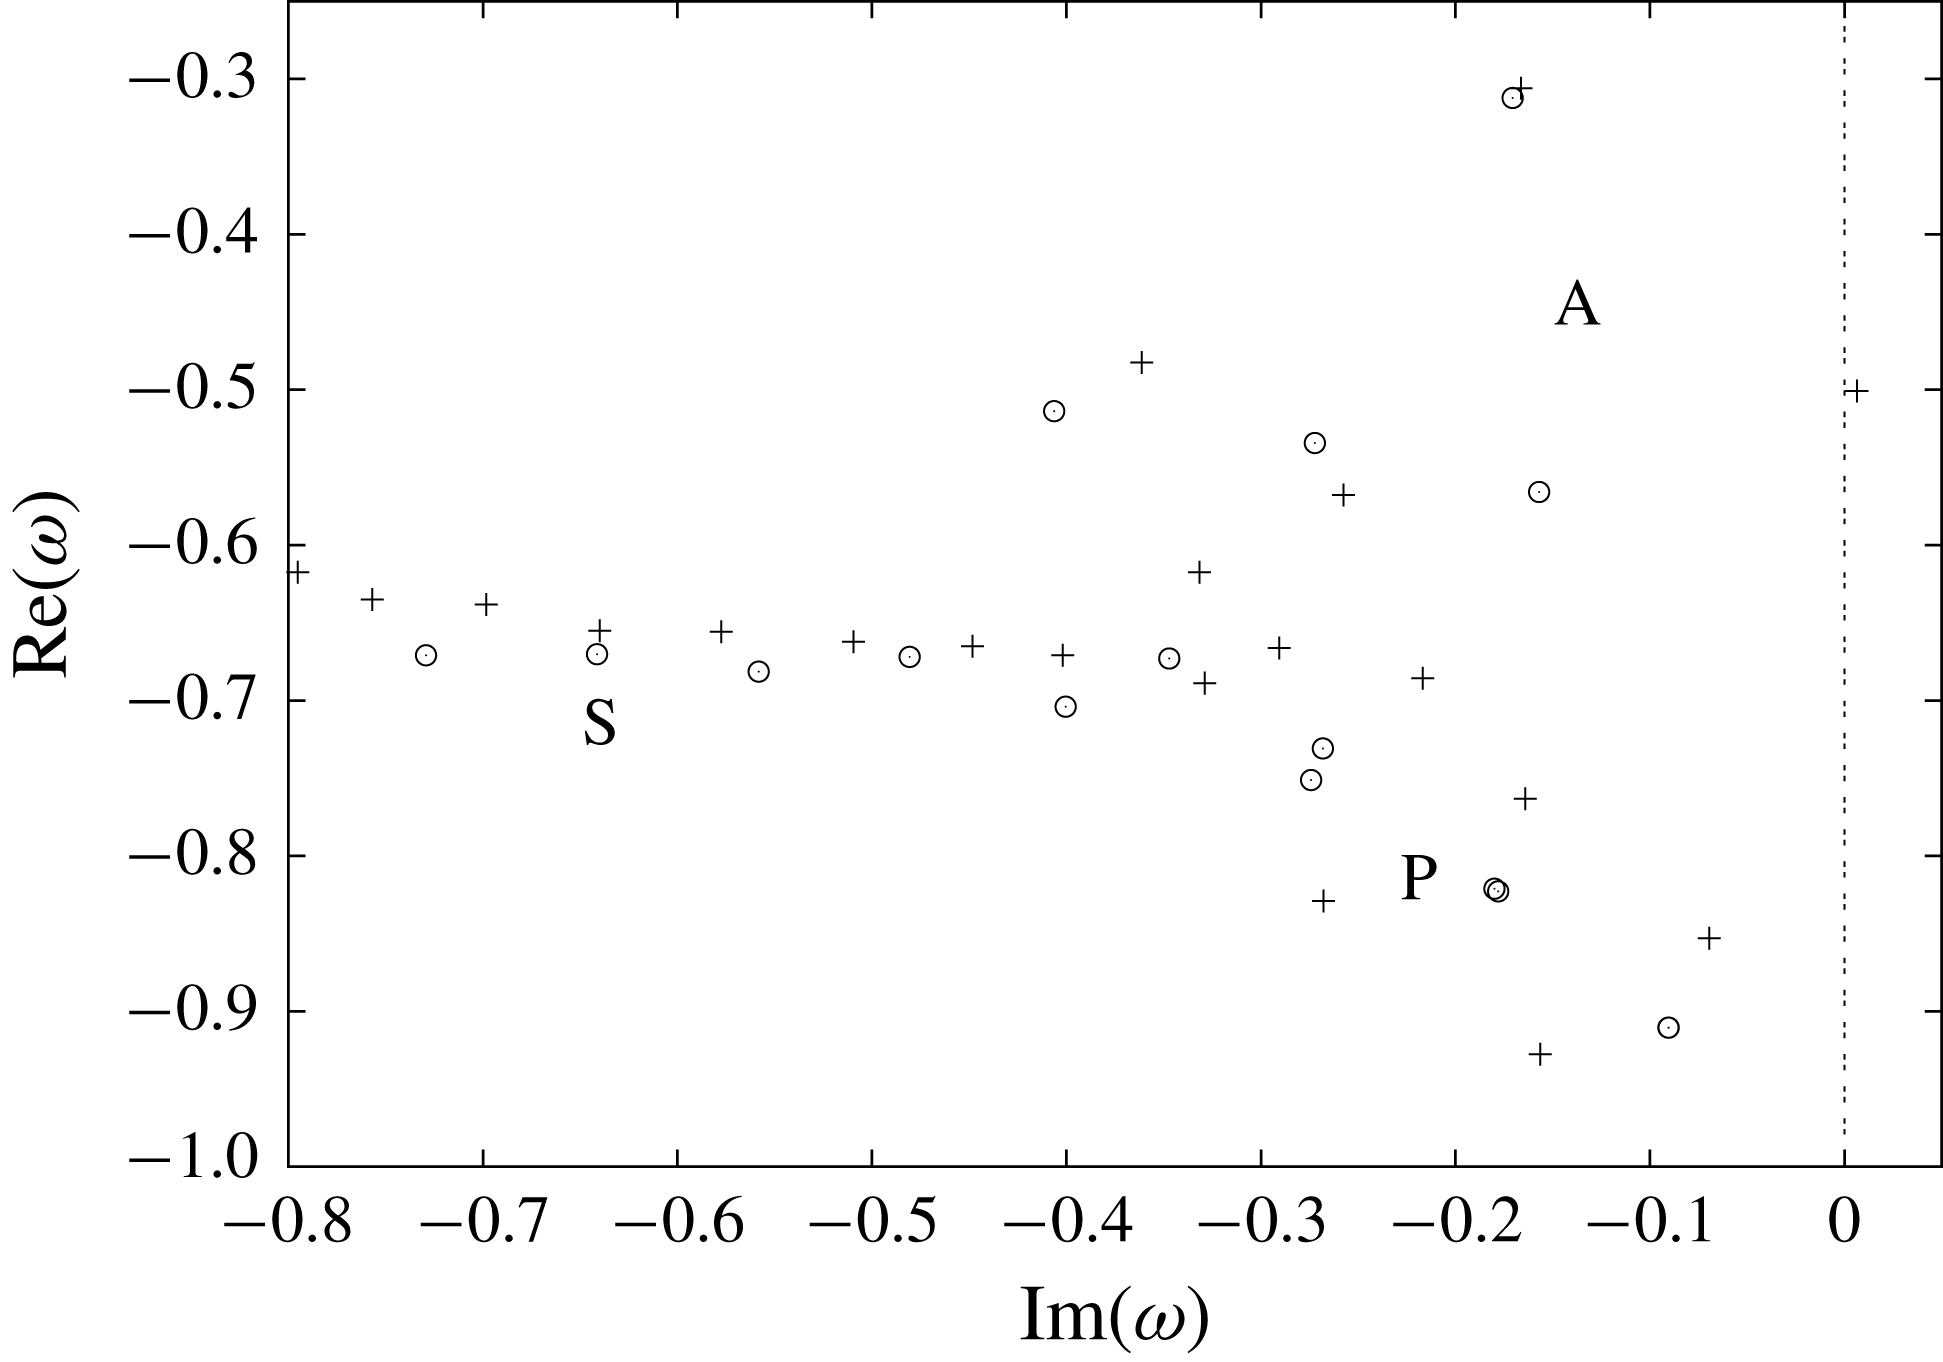
), after which the dominant eigenmode appears to be the same as for the uniform problem. Closer examination of the eigenvalue spectrum (figure 7) reveals that for an unstable configuration, the leading eigenvalue is now in the A-branch of the spectrum, rather than the P-branch as in the case of both the non-particulate and uniformly distributed problems.
Eigenvalue spectra for the non-particulate (○) and particulate cases (
 $+$
). In both cases
 $Re=1000$
,
 $\unicode[STIX]{x1D6FC}=1$
and
 $m=1$
while the particles were non-uniformly distributed with
 $f=0.1$
,
 $r_{d}=0.6$
and
 $\unicode[STIX]{x1D70E}=0.1$
. In the non-uniformly distributed case the spectrum becomes unstable.

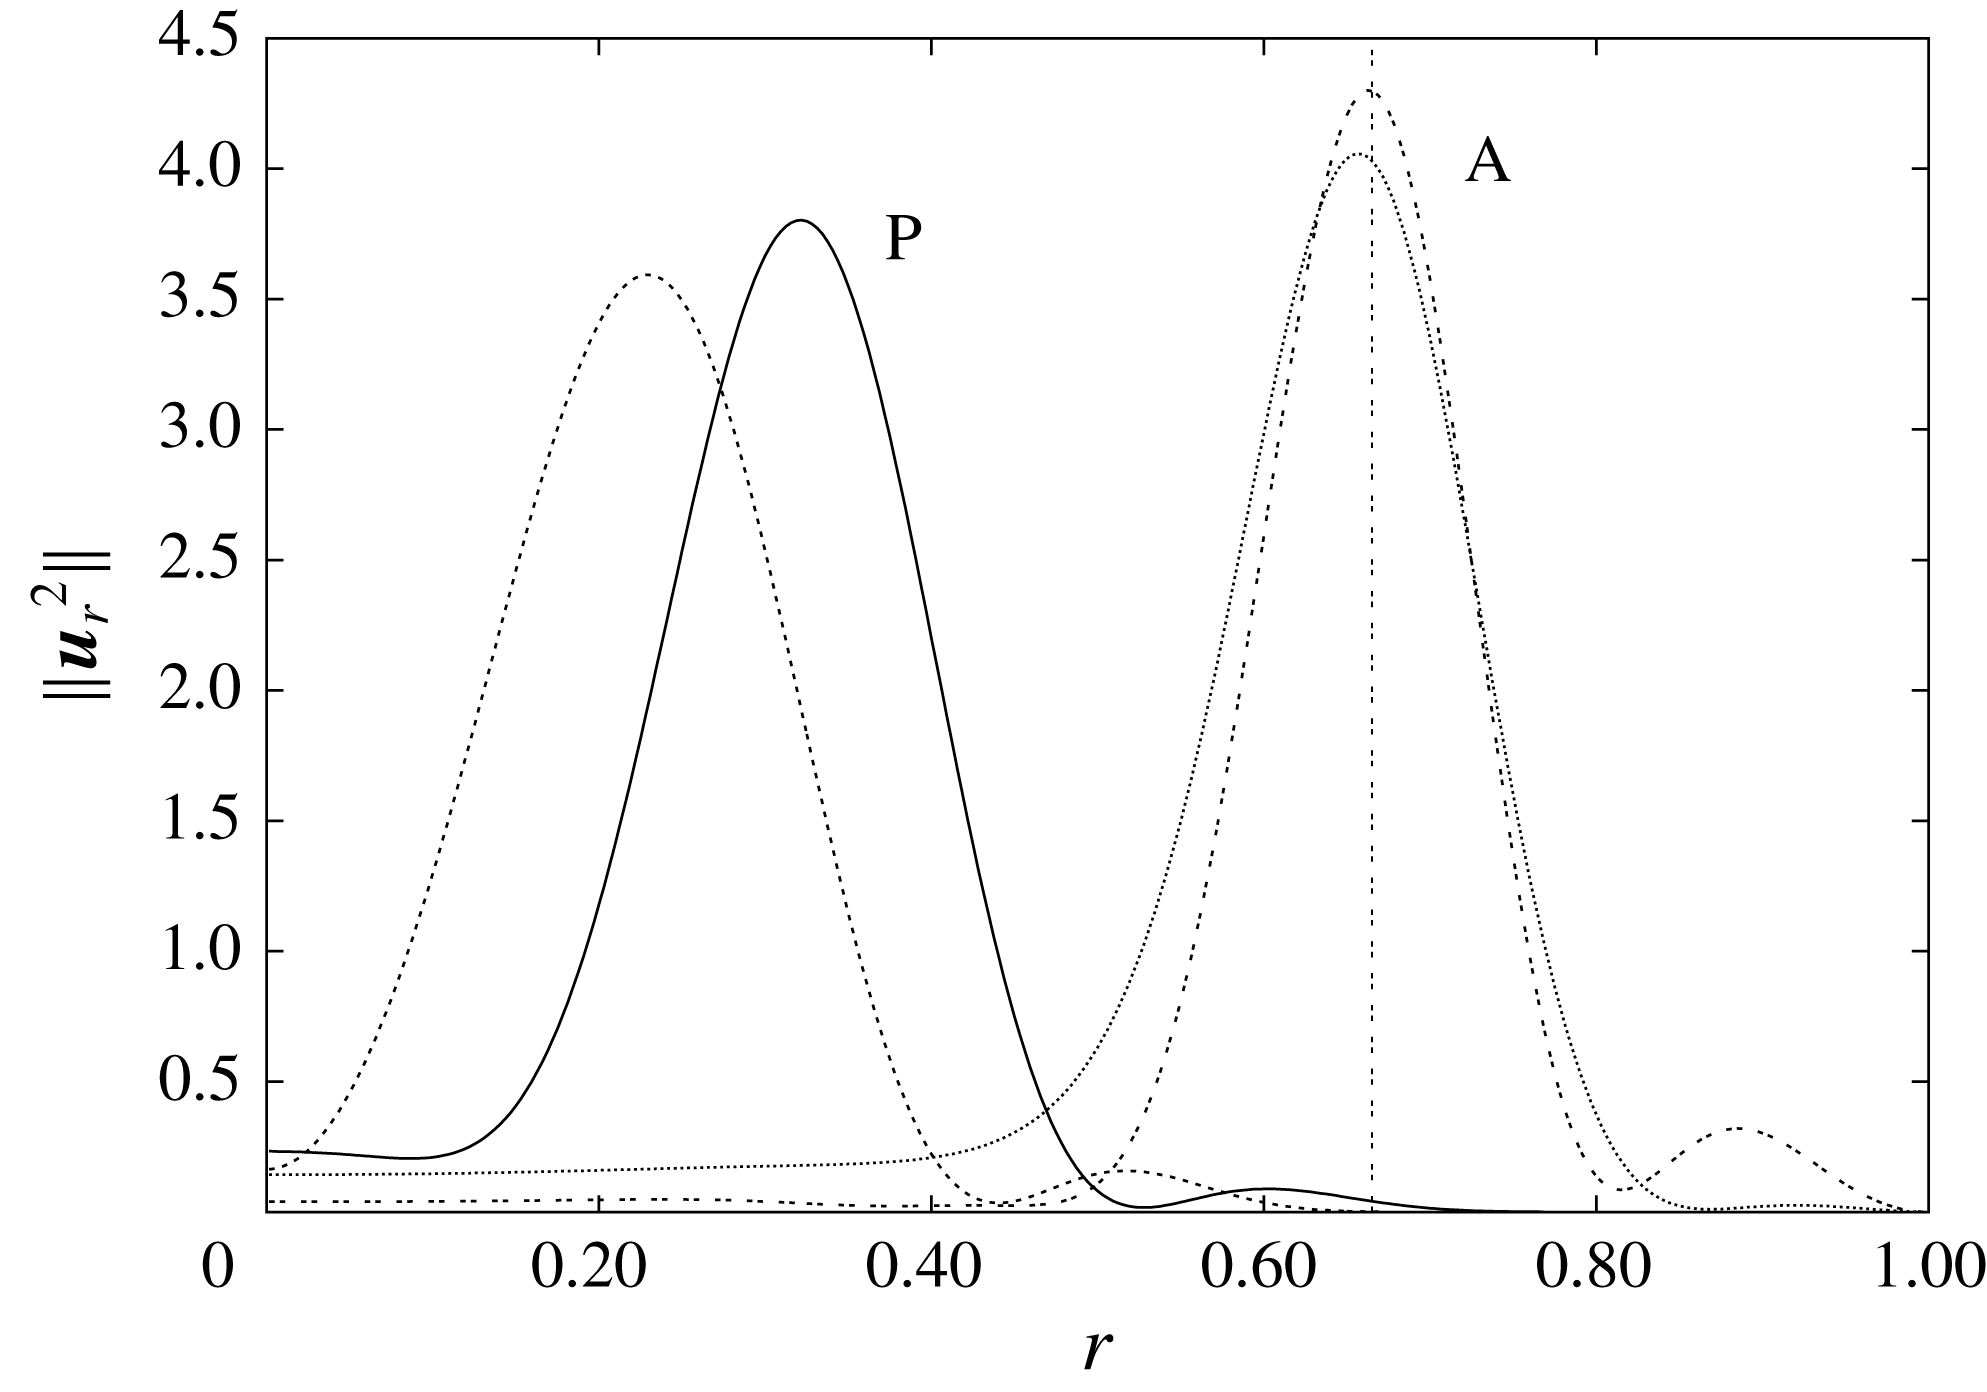
The reason for the switching of branches becomes clear as soon as we examine the eigenmodes associated with the two eigenvalues. In figure 8 the leading eigenmodes of the two branches are plotted. The overall shape is relatively insensitive to the distribution of particles, but the modes of the two branches are primarily active in different parts of the pipe. For the P-branch, the eigenmode is localised to a relatively central part of the domain (centred at
 $r\approx 0.3$
), while the A-branch mode is located nearer the edge of the pipe (
 $r\approx 0.7$
). It is unsurprising that when the particle distribution is centred near this outer location, these are the eigenmodes that are primarily excited.
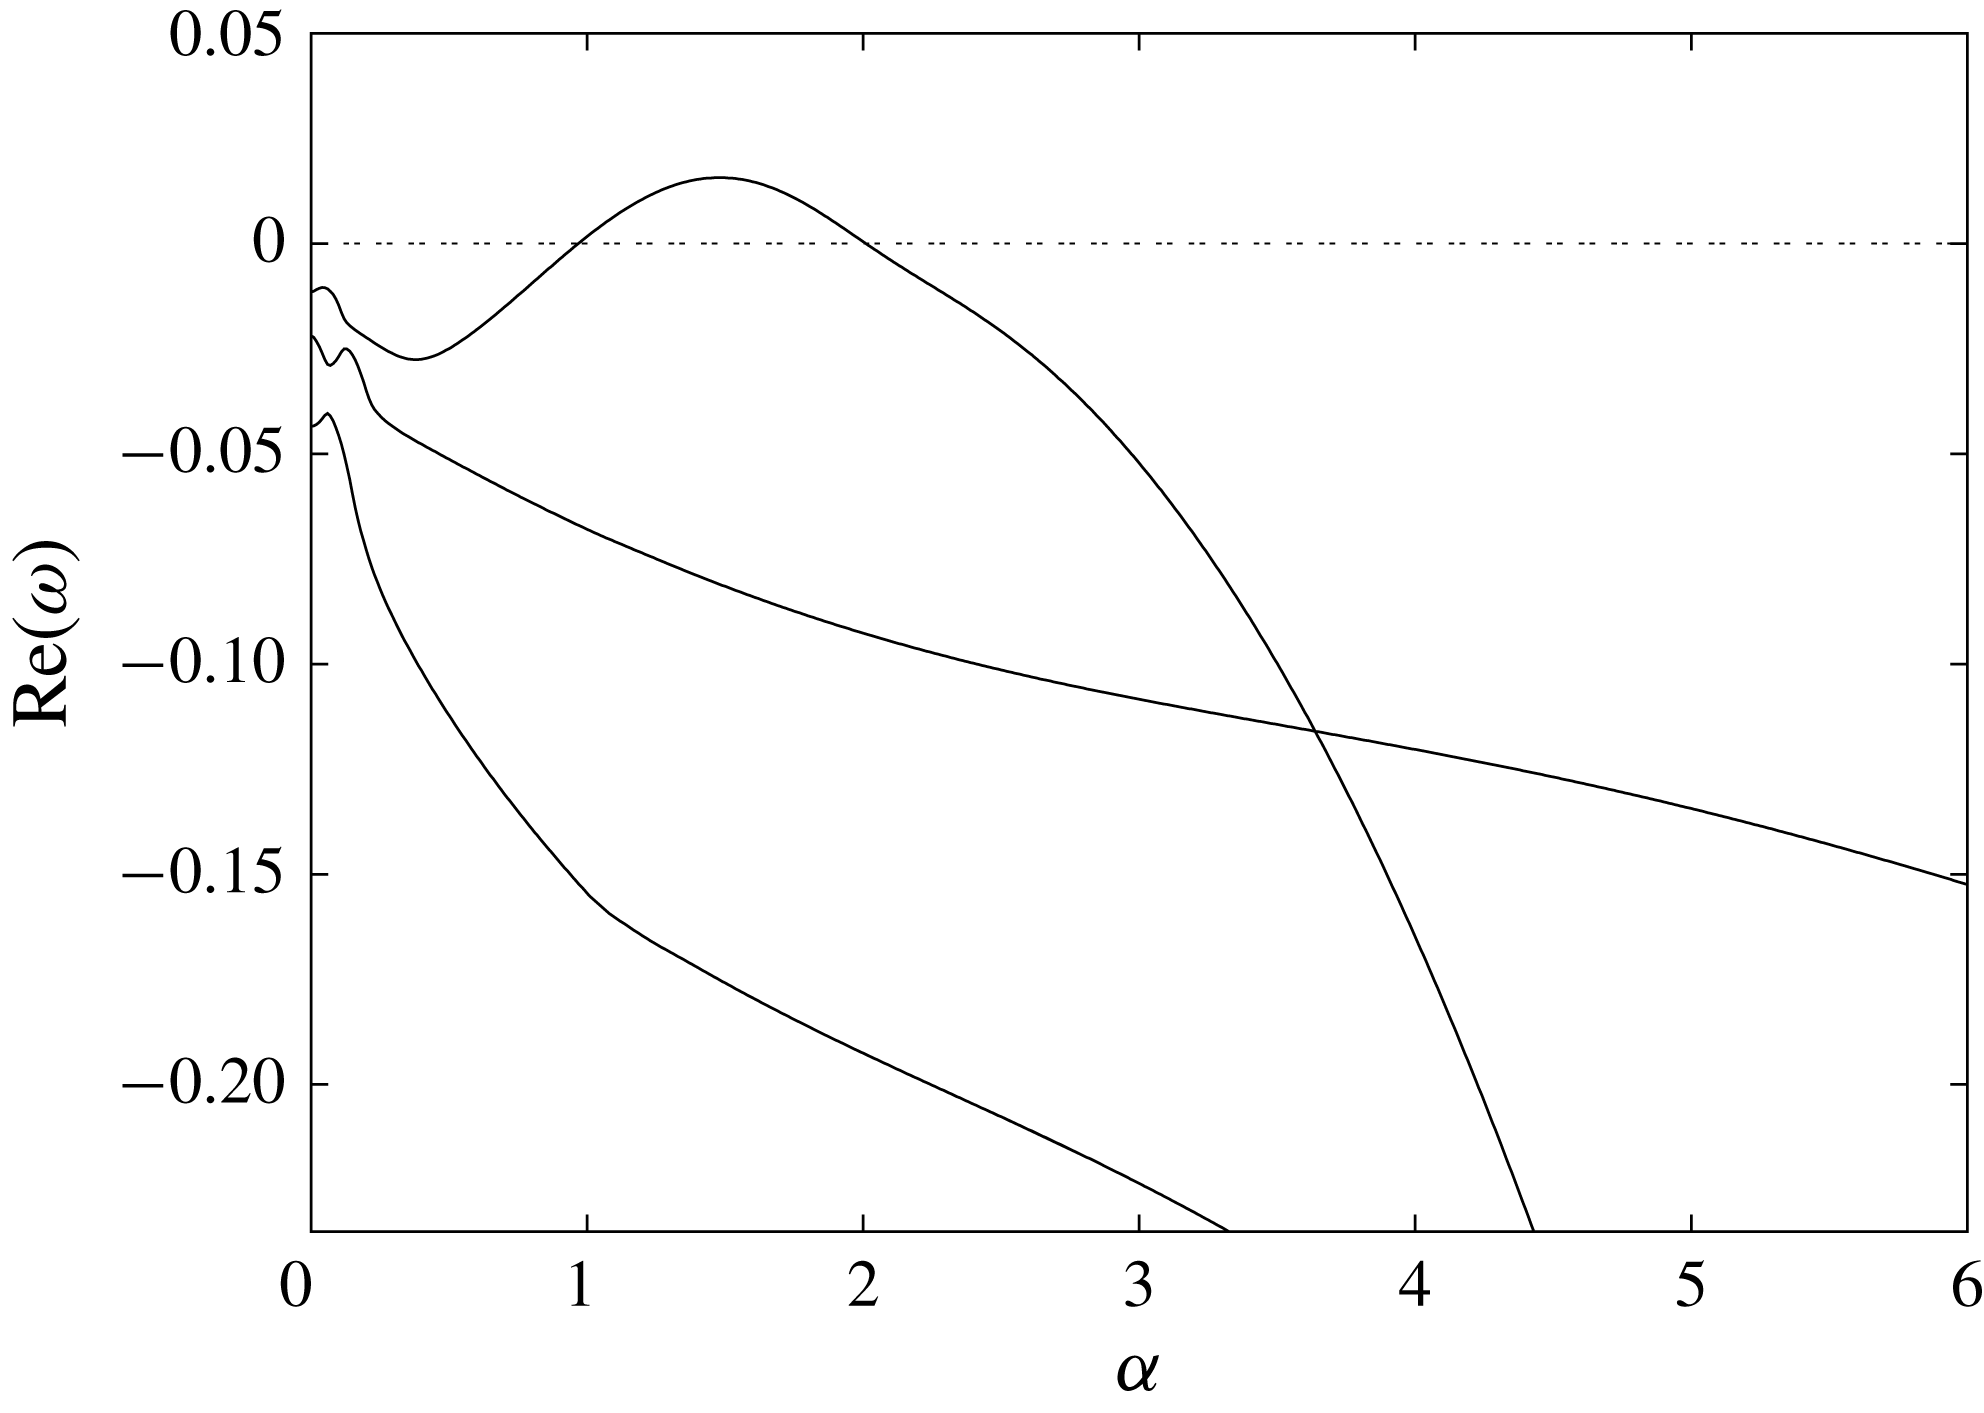
As well as only being unstable for a finite range of
 $Re$
, the flow is also only unstable for a finite range of
 $\unicode[STIX]{x1D6FC}$
(figure 9). For both small and large wavenumber disturbances the flow is stable. The latter is to be expected due to the stabilising influence of viscosity, but it is important to note the instability exists at very moderate wavenumbers for which the model is expected to be valid.
The distribution of the fluid energy in the leading eigenmodes. The two that peak on the left are the leading P branch modes for the non-particulate (solid line) and particulate (dashed) cases. The leading A modes peak on the right with the non-particulate case being double-dashed and the particulate profile dotted. For the particulate case the particles are non-uniformly distributed with
 $Re=1000$
,
 $m=1$
,
 $f=0.1$
,
 $S=10^{-3}$
,
 $r_{d}=0.7$
and
 $\unicode[STIX]{x1D70E}=0.1$
. The vertical line is at
 $r_{d}^{\ast }=0.666$
.

The three leading growth rates for the case
 $Re=1000$
,
 $m=1$
,
 $f=0.1$
,
 $S=10^{-3}$
,
 $r_{d}=0.65$
and
 $\unicode[STIX]{x1D70E}=0.1$
. Instability (
 $\text{Im}\{\unicode[STIX]{x1D714}\}>0$
) only occurs for a finite range of
 $\unicode[STIX]{x1D6FC}$
, with the flow being stable to both long and short wavelength disturbances.

4.2 Effect of the radial distribution of particles
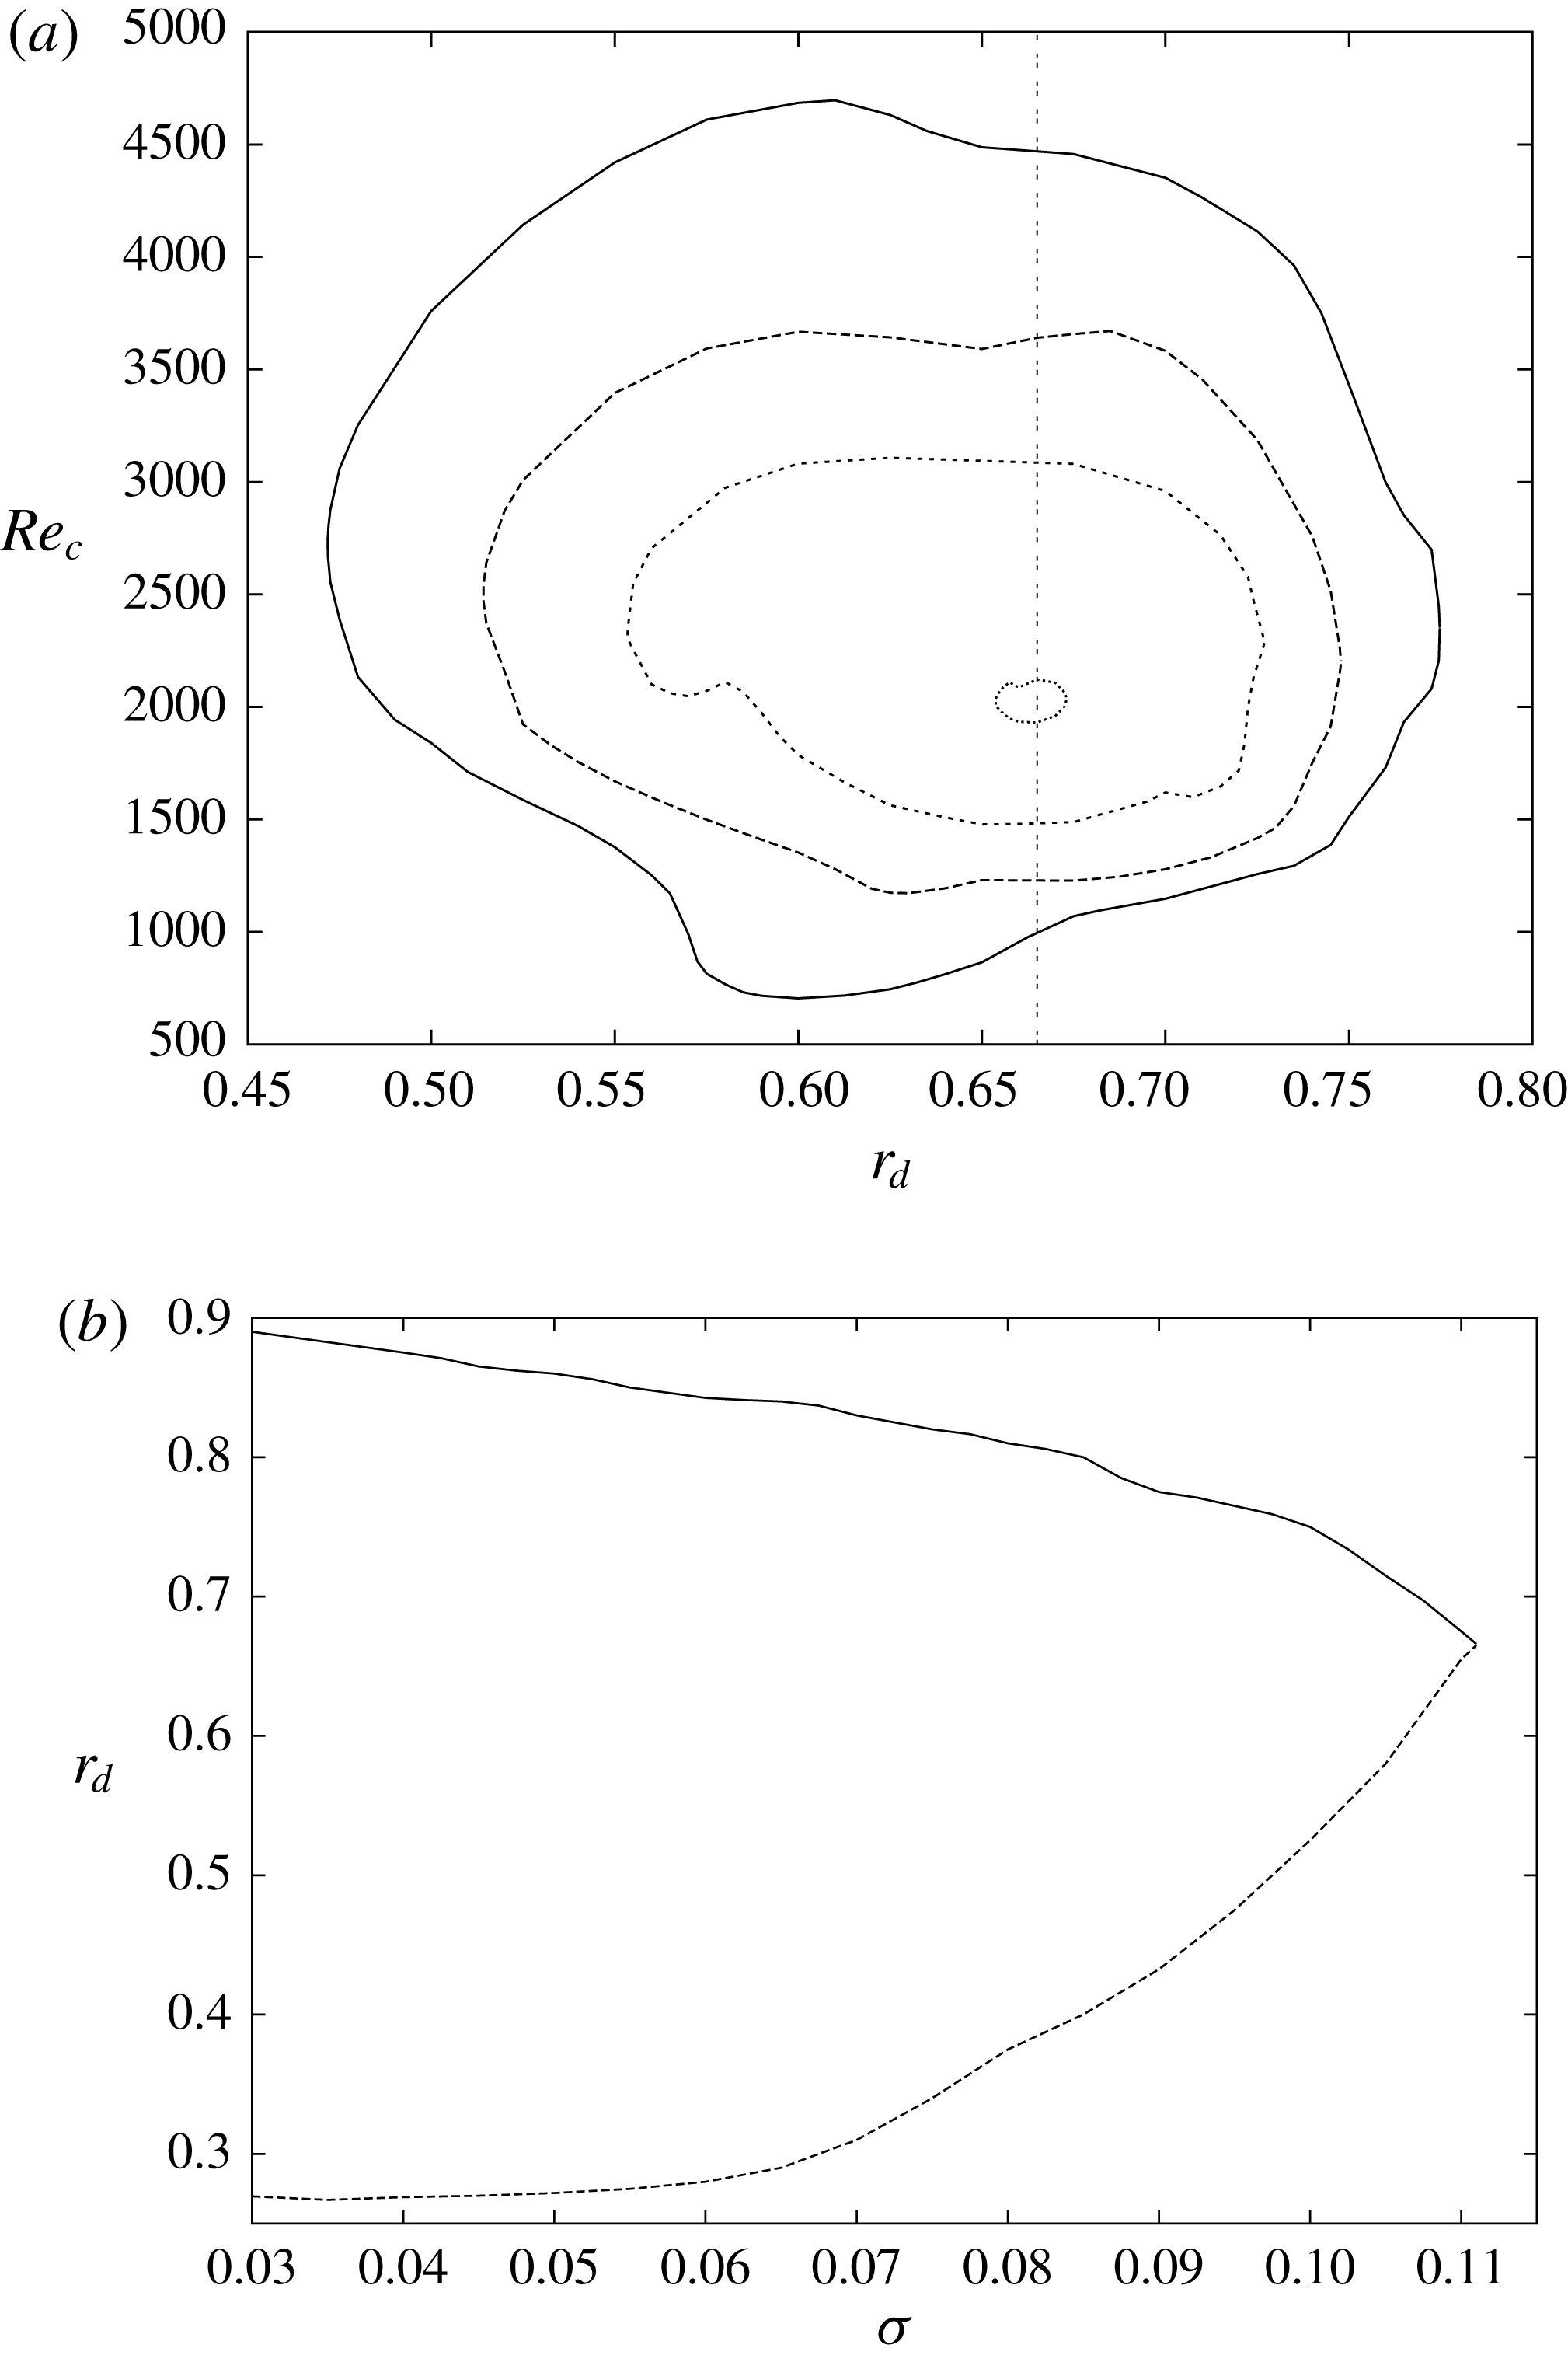
The exact location where the particle annulus (
 $r_{d}$
) is centred, and how sharply the distribution peaks around this location, plays an important role in determining whether the flow becomes unstable or not. By searching over
 $\unicode[STIX]{x1D6FC}$
we can trace out neutral stability contours in
 $Re-r_{d}$
space for differing values of
 $\unicode[STIX]{x1D70E}$
(figure 10
a). The enclosed regions are unstable and we see that all the contours are indeed closed. The fact that there is a minimum/maximum value of
 $Re$
for which the flow is unstable is consistent with our earlier observations, while the fact that there are bounds on the value of
 $r_{d}$
supports the idea of needing to excite the P-branch in order to destabilise the flow. We note that for all values of
 $\unicode[STIX]{x1D70E}$
, the curves are concentric and the broadest range of unstable
 $Re$
occurs when
 $r_{d}$
is in the region 0.6–0.7.
Next, we track the maximum and minimum values of
 $r_{d}$
for which instability exists in figure 10(b). By doing so, we arrive at a minimum degree of localisation required to trigger instability, corresponding to
 $\unicode[STIX]{x1D70E}^{\ast }=0.111$
, for which the particle distribution must be centred at
 $r_{d}^{\ast }=0.666$
.
(a) Contours of neutral stability in
 $Re-r_{d}$
space for values of
 $\unicode[STIX]{x1D70E}=0.110$
, 0.105, 0.100 and 0.095 from innermost to outermost. In each case, the enclosed region is the unstable region. That all the contours are closed indicates that there is a maximum/minimum value of both
 $Re$
and
 $r_{d}$
for which flow is unstable. (b) The maximum (solid)/minimum (dashed) values of
 $r_{d}$
for which the flow becomes unstable as
 $\unicode[STIX]{x1D70E}$
is varied, searching across all
 $Re$
. There is a maximum value of
 $\unicode[STIX]{x1D70E}$
beyond which instability is not possible.

5 Relevance to experimental configurations
Matas et al. (Reference Matas, Morris and Guazzelli2004b ) experimentally explore the effect of adding neutrally buoyant particles to pipe flow. As with other experimental work they report the clustering of particles at preferential radii that motivates this study but they do not report evidence of a linear instability. In this section we analyse the configurations observed by Matas et al. and show that our numerical results are consistent with the experiments – that is that we find the configurations to be linearly stable.
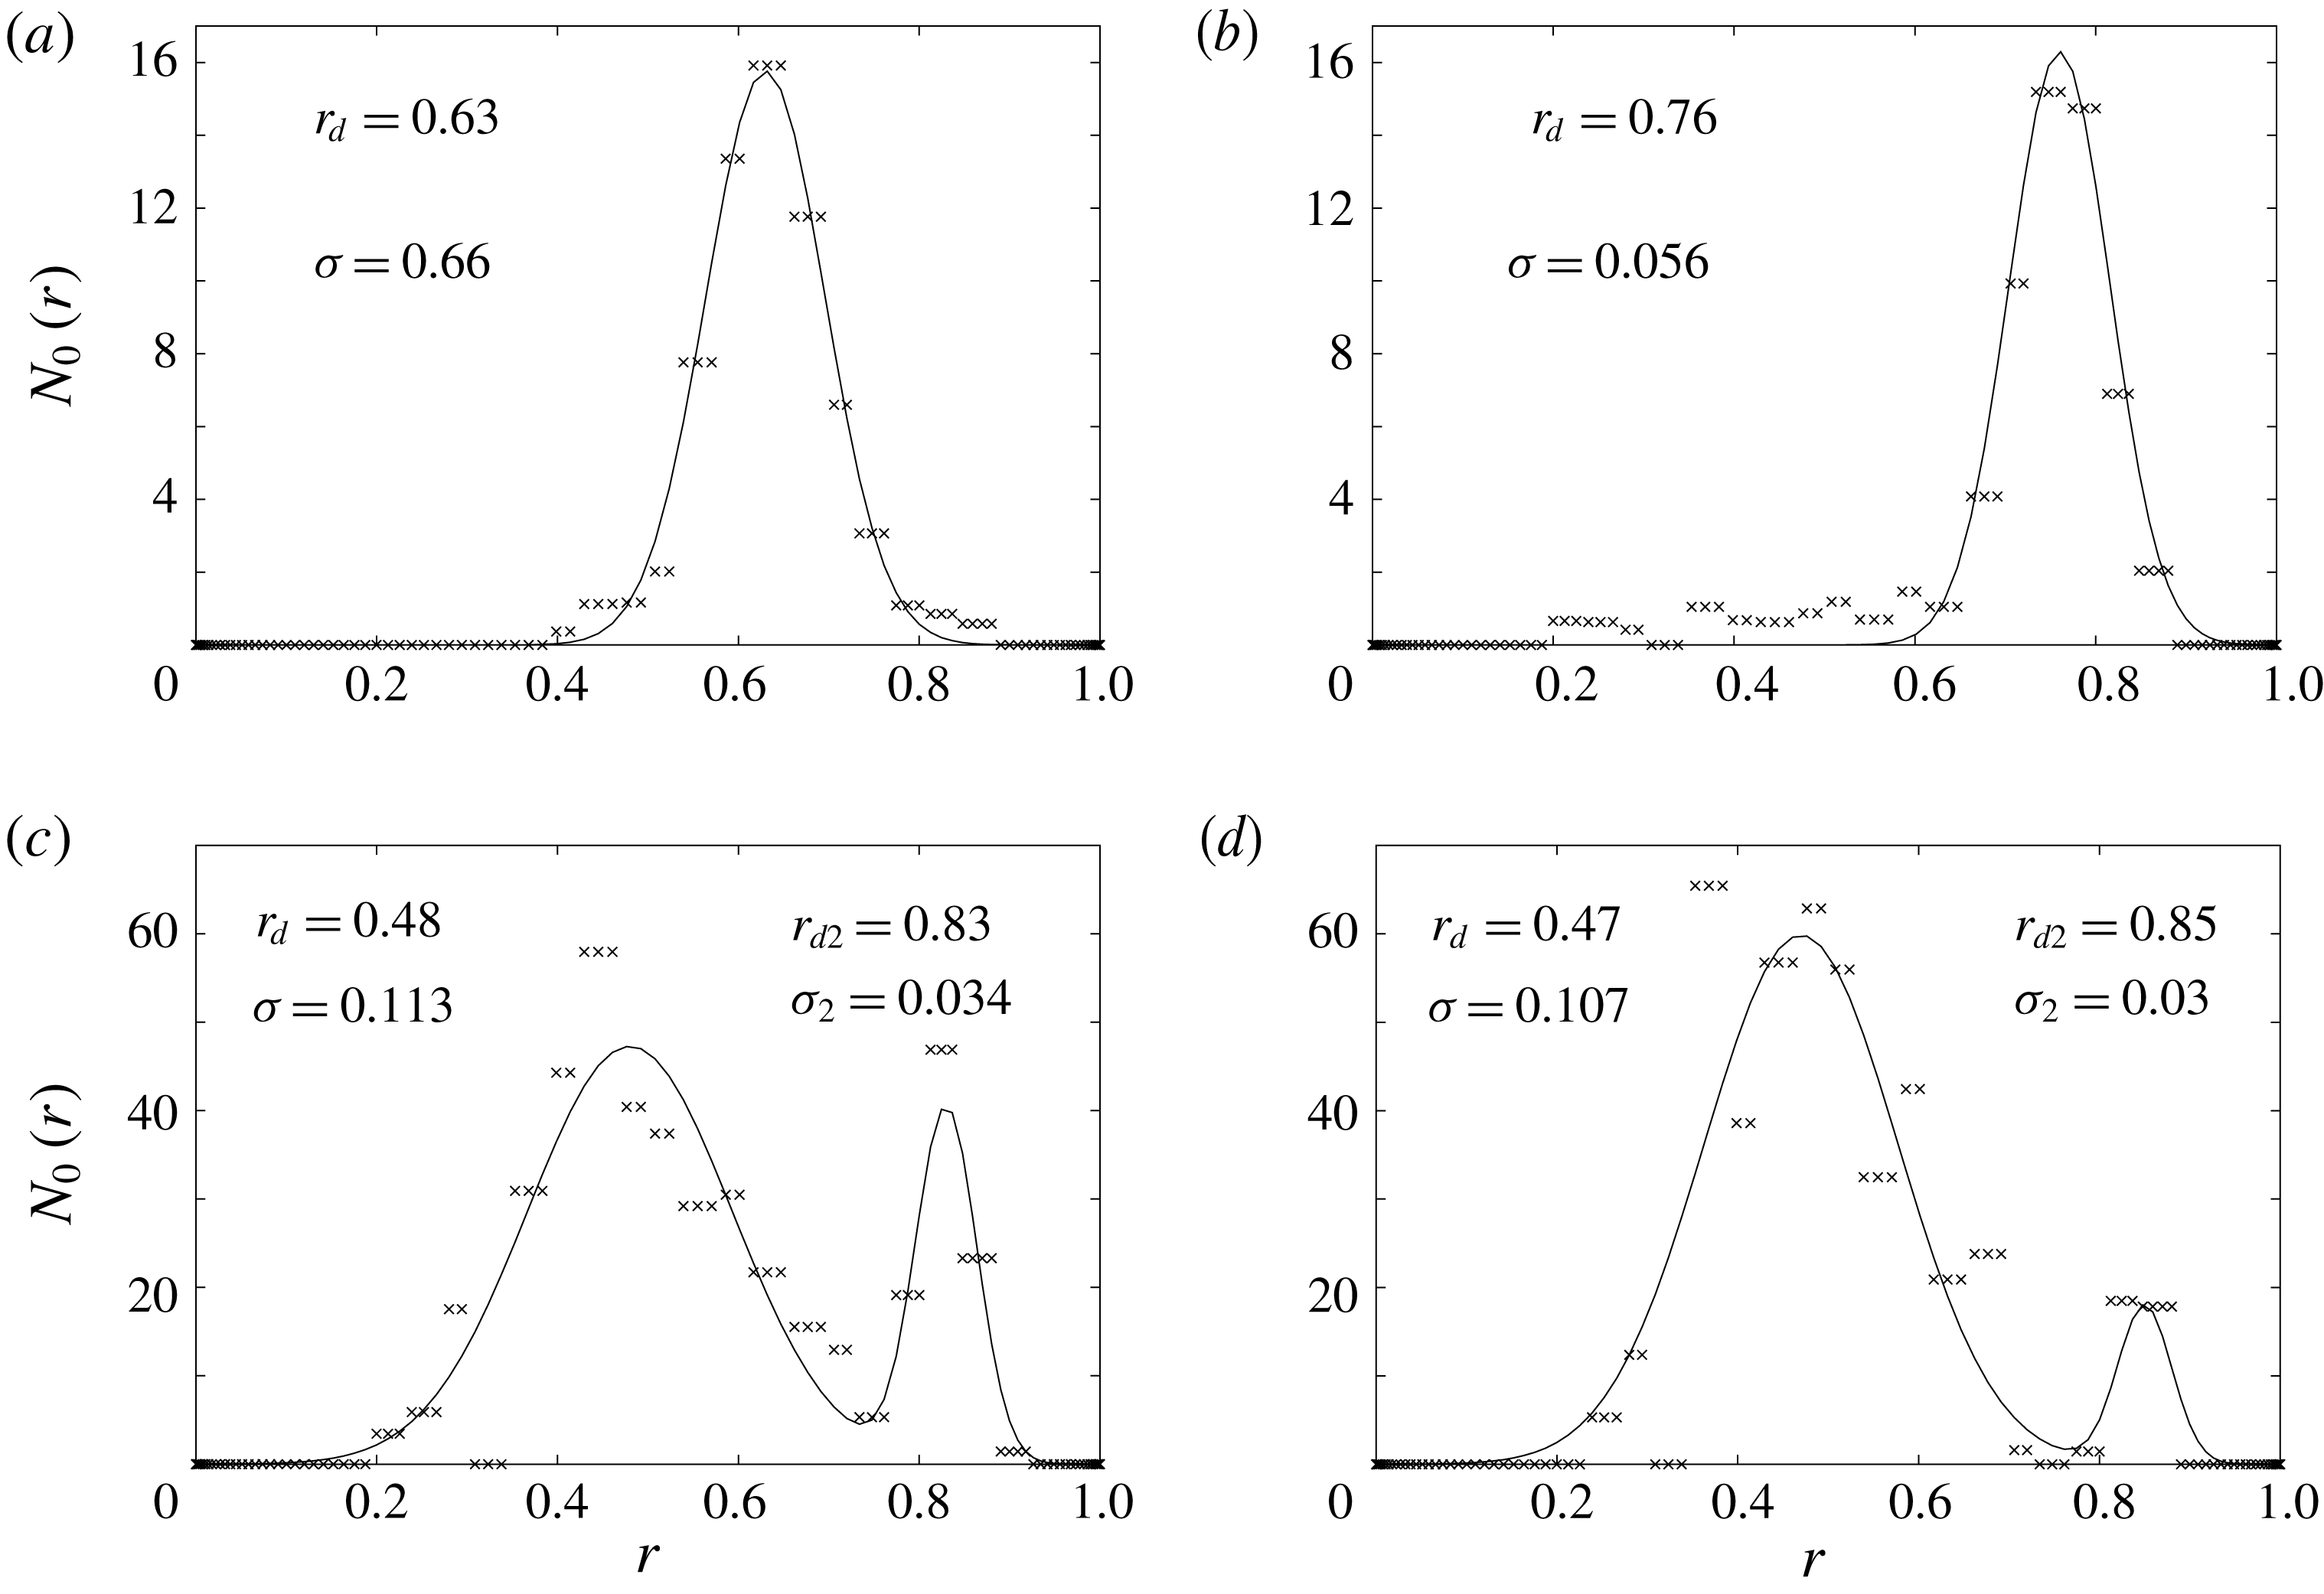
In the experimental work, four configurations of particles are explicitly given (figure 11) corresponding to
 $Re=67$
, 350, 1000 and 1650 (left to right, top to bottom). At low
 $Re$
the particles all cluster at a single radius consistent with Segré & Silberberg (Reference Segré and Silberberg1962). As
 $Re$
is increased, two preferential radii emerge and coexist. We capture these distributions within the linear stability analysis with two approaches. Firstly, we fit either one or two Gaussian distributions through the data using least squares. These fits and the corresponding fitting parameters are those given in figure 11. Secondly, we use the raw data to give a discontinuous distribution with the
 $N_{0}(r)$
being taken as constant between data points.
Particle concentration as a function of the radius. The crosses show the experimental results of Matas et al. (Reference Matas, Morris and Guazzelli2004b
) while the lines are our fitted distributions. For the top row (
 $Re=67$
(a) and
 $Re=350$
(b)) a single Gaussian was fitted for each case, centred at
 $r_{d}$
and of width
 $\unicode[STIX]{x1D70E}$
. For the bottom row (
 $Re=1000$
(c) and
 $Re=1650$
(d)) each set of data was fitted with the sum of two Gaussians of the given locations and widths.

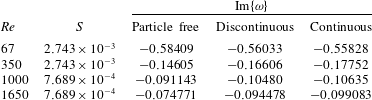
Comparison of leading eigenvalues for the linear stability problem obtained in the cases of no particles, with particle distributions experimentally found by Matas et al. (Reference Matas, Morris and Guazzelli2004b
) (see figure 11) and with particles distributed with closest Gaussian fits to the experimental data (the parameters given in figure 11). In each case the eigenvalues are given for
 $m=1$
and
 $\unicode[STIX]{x1D6FC}=1$
.

In table 1 we give the growth rates of the leading eigenvalues for non-particulate flow, particles distributed continuously and particles distributed discontinuously for the different configurations reported by Matas et al. For
 $Re=67$
both distributions of particles reduce the stability of the flow, but not so far as to make it unstable. For the higher values of
 $Re$
, the particles in fact stabilise the flow further. These effects apply for both the Gaussian and discontinuous particle distributions and all growth rates agree to within at most 7 %, much less than the discrepancy with the non-particulate case. We conclude that within the set of cases experimentally studied, our numerical results are fully consistent with the observations.
6 Conclusions and discussion
We have presented a very simple model for particulate pipe flow. Although this model has been examined before in plane shear flow (Saffman Reference Saffman1962; Klinkenberg et al. Reference Klinkenberg, de Lange and Brandt2011; Boronin Reference Boronin2012), without the addition of complexity to the model the flow has always remained stable. Here this is observed for pipe flow too when the particles are distributed homogeneously throughout the pipe. We are able to track the curves in parameter space for which the flow becomes most effected by the presence of particles, but it does always remain stable, as for non-particulate pipe flow.
Relaxing the assumption of uniformly distributed particles, and allowing for the experimentally observed situation of particles arranged preferentially in an annulus is sufficient to induce linear instability in the flow for certain ranges of the parameters. In particular, the flow is only ever unstable for intermediate Reynolds numbers, restabilising as
 $Re$
is increased further. This intermediate regime is sandwiched between low
 $Re$
flows dominated by viscous diffusion and high
 $Re$
flows where the two phases decouple. The instability also only exists at intermediate axial wavenumbers. This avoids both the small length scale disturbances which violate the assumptions of the model and also the large (axial) scale disturbances which must test any assumption of axial independence of the base state.
The linear instability appears strongest when the annulus of particles is centred at
 $r_{d}\approx 0.65$
both in terms of this being the location where the smallest degree of localisation is needed for instability and being closely correlated with the widest band of unstable
 $Re$
for stronger localisation. This is particularly important as experimental work suggests that neutrally buoyant particles naturally congregate at a similar radii. The experimental work done to date on transitional particulate pipe flow (Matas et al.
Reference Matas, Morris and Guazzelli2003, Reference Matas, Morris and Guazzelli2004b
) has all been within the region of parameter space that this study has found to be linearly stable. Hence our results are entirely consistent with these experimental flows being found stable. Particles localised near Segré and Silberberg’s were also recently found to enhance the transient growth of subcritical modes, with a similar non-trivial influence of
 $S$
(Rouquier, Pothérat & Pringle Reference Rouquier, Pothérat and Pringle2019).
That linear instability is possible even within such a simple framework highlights the complexities of the problem and reveals that very different transition scenarios can be at play within the broader problem of particulate pipe flow. There is already evidence in other problems that particles being distributed non-uniformly has a greater effect on the stability of shear flows (Boronin Reference Boronin2012; Boronin & Osiptsov Reference Boronin and Osiptsov2014; Wang et al. Reference Wang, Abbas and Climent2018) and most recently that if in addition to this gravity is included, then for vertical channel flow it can entirely destabilise the problem (Boronin & Osiptsov Reference Boronin and Osiptsov2018).
We do not submit this as a full explanation for the transition problem not least because it is possible that some of the excluded physics has a stabilising effect on the flow. In particular, the inertial mechanisms driving the particles to form into an annulus could be expected to act as a stabilising influence. These forces are weak in the case of small particles, but if the flow as a whole is linearly stable they would have time to affect the distribution. Instead we highlight that a new mechanism for triggering instability exist in the presence of non-uniformly distributed particles. The formation of an annulus of particles could then be a key step in the onset of turbulence for certain, experimentally relevant parametric configurations of the problem. Already there is numerical evidence in channel flow that before the onset of turbulence, particles begin to preferentially cluster in layers close to the wall (Loisel et al. Reference Loisel, Abbas, Masbernat and Climent2013).
Acknowledgements
A.R. is supported by TUV-NEL. C.C.T.P. is partially supported by EPSRC grant no. EP/P021352/1. A.P. acknowledges support from the Royal Society under the Wolfson Research Merit Award Scheme (grant WM140032). We thank A. Willis for use of his code as well as useful discussions on adapting it.
Appendix A. Assumptions
The two-fluid model for particulate flow has been extensively used, especially in the context of stability theory (Saffman Reference Saffman1962; Klinkenberg et al. Reference Klinkenberg, de Lange and Brandt2011; Boronin Reference Boronin2012). Although a simplistic model, it can highlight some of the basic consequences of particle–fluid interactions, even if it may struggle to reproduce precise, quantitative experimental details. In this appendix we layout when this approach can be expected to give relevant results in terms of the non-dimensional parameters in the problem.
The simplest set of forces to consider involves the particle weight:
 $$\begin{eqnarray}P\sim {\textstyle \frac{4}{3}}\unicode[STIX]{x03C0}\unicode[STIX]{x1D70C}_{p}a^{3}g,\end{eqnarray}$$
the buoyancy force,
 $$\begin{eqnarray}B\sim {\textstyle \frac{4}{3}}\unicode[STIX]{x03C0}\unicode[STIX]{x1D70C}_{f}a^{3}g,\end{eqnarray}$$
pressure forces around the particle, which scale with the buoyancy (Jackson Reference Jackson2000)
 $$\begin{eqnarray}G\sim 4\unicode[STIX]{x03C0}a^{3}\unicode[STIX]{x1D735}p\sim B\end{eqnarray}$$
and Stokes drag:
 $$\begin{eqnarray}D\sim 6\unicode[STIX]{x03C0}\unicode[STIX]{x1D70C}_{f}\unicode[STIX]{x1D708}aU.\end{eqnarray}$$
The two-fluid model involves three non-dimensional numbers that can be adjusted and therefore should be allowed to remain finite in the regime
 $a/r_{0}\ll 1$
, where the model is expected to be valid. These are the Reynolds number:
 $$\begin{eqnarray}Re=\frac{Ur_{0}}{\unicode[STIX]{x1D708}},\end{eqnarray}$$
the dimensionless particle mass concentration,
 $$\begin{eqnarray}f=\frac{m_{p}}{m_{f}}=\frac{4}{3}\unicode[STIX]{x03C0}a^{3}n\frac{\unicode[STIX]{x1D70C}_{p}}{\unicode[STIX]{x1D70C}_{f}},\end{eqnarray}$$
where
 $n$
is the number of particles per unit of volume and the dimensionless relaxation time
 $$\begin{eqnarray}S=\frac{2}{9}\left(\frac{a}{r_{0}}\right)^{2}\frac{\unicode[STIX]{x1D70C}_{p}}{\unicode[STIX]{x1D70C}_{f}}.\end{eqnarray}$$
Keeping both
 $f$
and
 $S$
finite in the limit
 $a\rightarrow 0$
implies
 $$\begin{eqnarray}\displaystyle & \displaystyle \frac{a}{r_{0}}\sim \left(\frac{\unicode[STIX]{x1D70C}_{f}}{\unicode[STIX]{x1D70C}_{p}}\right)^{-2}, & \displaystyle\end{eqnarray}$$
 $$\begin{eqnarray}\displaystyle & \displaystyle n\sim {r_{0}}^{-3}\left(\frac{a}{r_{0}}\right)^{-1}. & \displaystyle\end{eqnarray}$$
The last condition requires a sufficiently large number of particles. In the limit
 $a\rightarrow 0$
, the ratio of solid to fluid volumes scales as
 $n(4\unicode[STIX]{x03C0}/3)a^{3}\sim (4\unicode[STIX]{x03C0}/3)(a/r_{0})^{2}$
and vanishes as
 $a\rightarrow 0$
. Hence, the condition (A 9) also guarantees that particles are diluted in volume. This justifies ignoring collisions between them.
Since in the two-fluid model we are considering, particles and fluid interact only through Stokes drag, the latter must dominate the other three forces for the model to keep some physical relevance. This imposes two additional conditions:
 $$\begin{eqnarray}\displaystyle & \displaystyle \frac{P}{D}\sim S\frac{Ga}{Re}\ll 1, & \displaystyle\end{eqnarray}$$
 $$\begin{eqnarray}\displaystyle & \displaystyle \frac{B}{D}\sim \frac{G}{D}\sim \frac{2}{9}\left(\frac{a}{r_{0}}\right)^{2}\frac{Ga}{Re}\ll 1, & \displaystyle\end{eqnarray}$$
where the Galileo number
 $Ga=r_{0}^{3}g/\unicode[STIX]{x1D708}^{2}$
represents the ratio of gravity to viscous forces in the fluid. The first condition suggests that the model tends to be better justified for larger Reynolds numbers.
Returning to the problem under consideration, if we consider typical values of
 $S=10^{-2}$
and
 $Re=10^{3}$
, the first condition would require
 $Ga\ll 10^{5}$
. For typical values for dust and air,
 $\unicode[STIX]{x1D708}\simeq 10^{-5}~\text{m}^{2}~\text{s}^{-1}$
,
 $\unicode[STIX]{x1D70C}_{p}/\unicode[STIX]{x1D70C}_{f}\simeq 1600$
and
 $g\simeq 10~\text{m}~\text{s}^{-2}$
which requires a pipe under 1 cm diameter. For
 $S=10^{-2}$
, the particle diameter would have to be below
 $50~\unicode[STIX]{x03BC}\text{m}$
(and for
 $Re=1000$
, the flow should travel in excess of
 $1~\text{m}~\text{s}^{-1}$
). The volume fraction scales as
 $na^{3}\simeq (a/r_{0})^{2}$
, which yields, for
 $a=50~\unicode[STIX]{x03BC}\text{m}$
and
 $r_{0}=1$
cm,
 $na^{3}=10^{-5}$
. Here
 $\unicode[STIX]{x1D70C}_{p}/\unicode[STIX]{x1D70C}_{f}\simeq 1600$
gives a mass fraction
 $f\simeq 10^{-2}$
. Such dimensions are small but not unrealistic in experiments: pipe flow experiments normally use pipes of a few cm diameter and particles ranging from 10 to
 $500~\unicode[STIX]{x03BC}\text{m}$
. Even when these conditions are not perfectly matched, the model can be expected to have sufficient relevance to highlight the underlying mechanisms we are interested in.
The above argument suggests that it is reasonable at any instant in time to neglect gravitational forces compared to other forces. Nonetheless, it should be noted that if the flow is allowed to develop for an arbitrarily long period of time until a fully steady state develops, the presence of gravity will effect the base state. This has a knock on effect on the stability problem, even though gravity is absent from the perturbation equations.
Including this effect in the problem presents a problem as the ultimate steady state will be to have all the particles at the bottom of the pipe unless an alternative mechanism for redistributing them (such as turbulence) emerges. The exception to this comes if gravity is aligned in the streamwise direction. In this case the base flow is effected by the particles, potentially to such an extent that inflection points may appear in it (Boronin & Osiptsov Reference Boronin and Osiptsov2018). This important problem is left for future work and instead we rely on our scaling argument to treat our base state as a quasi-steady state about which linear stability analysis can be appropriately performed.