I. INTRODUCTION
The importance of bitumen nowadays is undeniable since a very large majority of the roads are made of asphalt, which is constituted by a mixture of mineral aggregates and about 5 wt% of bitumen. Despite this low bitumen content, the performance of the road pavement depends to a large extent on the properties of bitumen itself, since it constitutes the only deformable component.Reference Gonzalez, Pena, Munoz, Santamaria, Perez-Lepe, Martinez-Boza and Gallegos1
During the last few decades the properties specified for road pavements have become more and more exigent, due to the increasing number of vehicles and load weight of some of them.Reference Gonzalez, Munoz, Santamaria, Garcia-Morales, Navarro and Partal2 To minimize the road pavement deterioration and, thereby, to increase the long-term durability of a flexible pavement, the bituminous layers should be improved with regard to performance-related properties, such as resistance to permanent deformation, low-temperature cracking, load-associated fatigue, wear, stripping and aging.Reference Lu and Isacsson3 A common strategy to improve the quality of the bituminous layer consists in using polymer-modified bitumen (PMB). Modification of bitumen with synthetic polymers constitutes a route to meet the new technical demands. To this aim, several thermoplastics and elastomers have been mixed with bitumen, typically in an amount lower than 10%.Reference Gonzalez, Munoz, Santamaria, Garcia-Morales, Navarro and Partal2 The properties of a PMB are dependent on the characteristics of the polymer and bitumen, the polymer content and the manufacturing process.Reference Kim, Lee and Amirkhanian4–Reference Stuart, Mogawer and Youtcheff12
Some of the most commonly used polymers for bitumen modification are styrene-butadiene-styrene copolymer (SBS), styrene-butadiene rubber (SBR), ethylene-vinyl-acetate (EVA) and polyethylene (PE).Reference Airey13 Reactive elastomeric terpolymers (RET) were recently introduced in the market. RET may chemically interlock with bitumen to create permanent binder property improvements.
Two polymer modifiers are used in this work: Calprene 501TM SBS and ElvaloyTM RET. SBS block copolymers improved properties such as needle penetration, softening point and the mechanical properties of the base bitumen.Reference Sengoz and Isikyakar14 According to the manufacturer, ElvaloyTM RET is a terpolymer which may react with asphaltenes establishing covalent bonds. Thus, this product would permanently improve the internal bonding and resilience of modified asphalt binder.
Bitumen properties such as tackiness, viscosity, thermal susceptibility, plasticity and resistance to aging greatly influence the behavior at the processing stage and the performance stage as pavement . The mechanical behavior of the bitumen is very complex. Measurements of the physical properties of bitumen are usually associated with its rheological characterization. Since bitumen is a markedly viscoelastic, its response to stress depends on temperature and loading time. At low temperatures or short loading times, bitumen behaves predominantly elastic. At high temperature or long loading times bitumen exhibits a viscous behavior. The deformation properties of bitumen are determined mostly by its chemical composition and the structure of its molecules, but even when the ratio of asphaltenes to maltenes is optimal, there is a narrow temperature range in which pure bitumen exhibits suitable rheological behavior necessary for good road performance.Reference Ait-Kadi, Brahimi and Bousmina15, Reference Isacsson and Lu16
Bitumen composition is usually expressed in terms of maltenes and asphaltenes or as fractions obtained by chromatography: saturates, aromatics, resins and asphaltenes (SARAs).Reference Oliver17, Reference Speight18 Each SARAs fraction is a mixture with a complexity, aromaticity, heteroatom content, and molecular weight that increase in the order S < A < R<As.Reference Speight18 As a result of this continuum in bitumen composition, the viscoelastic curve for bitumen is rather uneventful as it shows a smooth change in modulus with temperature. Most paving-grade bitumens have amounts of paraffin-like crystalline matter less than 5 wt%, the main effect of which on the rheological properties seems to be the low-temperature physical hardening, attributed to wax crystallizations.Reference Kolbanov and Rudenski19, Reference Planche, Martin, Rey, Champion and Gerard20
TTS avoids the inefficiency of measuring a polymer’s behavior over long periods of time at a specified temperature by utilizing the fact that at higher temperatures and shorter time the polymer will behave the same. Nevertheless, some limitations of using that assumption at high temperatures were reported. Crystallization and the nature of asphaltenes present in asphalt were ascribed as the reasons for the failure of TTS for describing the behavior of asphalt.Reference Lesueur, Gerard, Claudy, Letoffe, Planche and Martin21
Temperature-modulated differential scanning calorimetry (TMDSC), in which a small sinusoidal perturbation is superimposed on the conventional linear heating program, is a useful technique for separating reversing and nonreversing thermal events.Reference Reading, Elliott and Hill22 The total heat flow is equivalent to that obtained by conventional DSC. The modulated heat flow is separated through a Fourier transform analysisReference Wunderlich, Jin and Boller23 into reversing and nonreversing components. The nonreversing component is kinetic in nature and can be attributed to nonreversing processes on cooling. Thus, TMDSC is an adequate technique to evaluate the possible crystallization and other exothermic processes taking place in cooling rheological studies.
In this work two unmodified and two modified bitumens are evaluated through TMDSC and rheology. The applicability of TTS and the influence of crystallization processes on the validity of the resulting shift factors are investigated for the four bitumen samples.
II. EXPERIMENTAL
Two unmodified and two modified bitumens were considered in this work:
(i) Sample M1. Bitumen of 150–200 penetration grade.
(ii) Sample M2. Bitumen of 60–70 penetration grade.
(iii) Sample M3. Calprene 501TM SBS-modified bitumen of 80–100.
(iv) Sample M4. Elvaloy (TN) RET-modified bitumen of sample 2.
The penetration grade of the unmodified bitumens was determined by the manufacturer according to the EN 1426:2007 standard for determination of needle penetration. All the samples were provided by Corvisa-Spain.
DSC tests were performed in a TA Instruments MDSC Q-2000, calibrated according to manufacturer procedures. Sapphire was used for heat capacity calibration.
For separating the glass transition from the nonreversing crystallization effects, the instrument was operated in temperature modulation mode. The experimental setup was:
Isothermal at 100 °C, cooling at 2 °C/min with 60 s of period and 0.32 °C of amplitude keeping “heat only” conditions.
The rheological tests were performed in a TA Instruments AR-G2. A preliminary 1 °C/min cooling ramp test was performed in the range from 100 to 20 °C. The frequency was 1 Hz. The strain amplitude was adjusted to remain in the linear viscoelastic range. Strain amplitudes of 0.2 and 0.02% were chosen for temperatures above and below than 60 °C, respectively. For the other tests, the experimental setup consisted of isothermal frequency sweeps from 1 H to 0.01 Hz at several temperatures, from 100 °C to 10 °C with 5 °C steps. The samples were isothermally held for 15 min at each step before applying the frequency sweep. In all cases, the strain amplitude was in the linear viscoelastic range.
III. RESULTS AND DISCUSSION
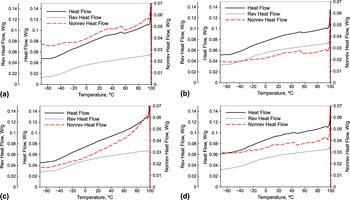
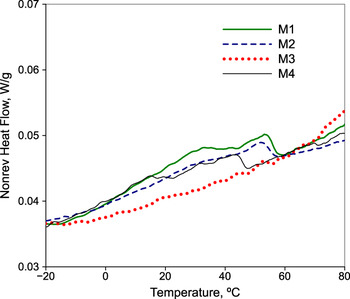
Figure 1 shows how the crystallization process and the glass transition cannot be clearly identified on the total heat flow curves. Nevertheless, TMDSC allows for splitting the total heat flow in two signals, reversing and nonreversing heat flow.Reference Garcia-Morales, Partal, Navarro and Gallegos24 The crystallization process is clearly seen on the nonreversing curves and the glass transition on the reversing ones. The glass transition temperatures (Tg), measured at the inflection point, were about −30 °C for M1 and M2, and −22 °C for M3 and M4, which suggests a possible interaction of the modifiers on the bitumen polymer increasing its Tg. In the case of M4, that interaction would come from covalent bonds between Elvaloy and asphaltenes. Full width at half maximum (FWHM) of the first derivative peak of the reversing heat flow curve provides an indication of the extent of the glass transition. FWHM values of 36.1, 44.2, 38.2, and 37.3 °C were measured from samples M1, M2, M3 and M4, respectively. Figure 2 shows the nonreversing heat flow curves obtained from the four samples. Crystallization of samples M1, M2 and M4 is clearly observed as several overlapping peaks on the nonreversing curves, while M3 does not exhibit any exothermic process in that range of temperature. Several theories were developed to explain the origin of these overlapping peaks.Reference Claudy, Letoffe, King and Planche25, Reference Claudy, Letoffe, King and Plancke26 One of them relies on the polydispersity of crystallizing waxes and possible solid-solid transitions, typical of paraffinic compounds. Another theory is based on the liquid-liquid demixing, one peak coming from the dissolution in the first liquid and the other from the dissolution in the second liquid.Reference Claudy, Letoffe, King and Planche25, Reference Claudy, Letoffe, King and Plancke26 Whatever the origin of the overlapping exotherm, Elvaloy makes decrease the exotherm area (sample 4) and SBS (sample 3) totally prevents these processes in that range of temperature.
TMDSC plots obtained from samples M1 (a), M2 (b), M3 (c) and M4 (d).

Nonreversing heat flow curves obtained from all the samples.

The magnitudes obtained from the rheological tests were G′, G* and the phase angle, δ. G* is the amplitude of the sinusoidal stress divided by the amplitude of the sinusoidal strain. G′ is the in-phase component of G*, mathematically,

Similarly, G″ is the out-of-phase component of G*. The phase angle, δ, is the phase difference between the sinusoidal strain and the sinusoidal stress and is related to G′ and G″ through

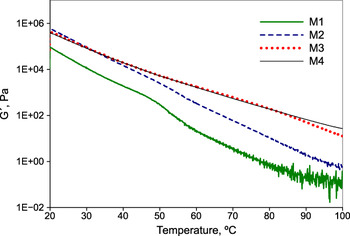
Figure 3 shows the plots of G′ versus temperature obtained in cooling. A peak/sigmoid step of G′ can be clearly observed on the unmodified asphalt curves at about 50 °C. This is a relaxation that will be further discussed. None of the modified asphalts did show any trace of crystallization, even though one of these samples, M4, crystallizes in a similar range of temperature than the unmodified samples. This observation means that, at least in this case, TMDSC is more sensitive to crystallization than rheology.
Plots of G′ versus temperature obtained from all the samples in the 1 Hz preliminary test.

Great interest on of bitumen rheology has arisen from the development of complex modern polymer-modified bitumens. The susceptibility to loading stress, loading time and temperature are some of the most relevant features in the context of manufacturing and quality of bituminous pavements.Reference Lesueur27 TTS principle was derived from observation that experimental creep compliance versus log (time) curves for different temperatures for various materials are of the same shape, but increasing temperature has the effect of contracting the time scale.Reference Leaderman28 TTS principle has been used to obtain the master curves for several properties such as creep, creep compliance and stress compliance against time [or log (time)] or dynamic modulus against frequency etc.Reference Ferry29 If the TTS method is valid, the master curve represents the true behavior of a long-term test at the reference temperature. Thus, prediction of the rheological behavior out of the experimental frequency or time domain is possible for bitumens obeying TTS. That curve would be expected to be smooth, so it is a necessary condition that the master curve produced should also be smooth at the overlap where two different individual curves meet.Reference Alwis and Burgoyne30 Although TTS principle has been used for many decades for polymeric materials, no firm rules have been developed for obtaining the master curves. In the absence of reliable long-term data, it has been a common practice to try to minimize the discrepancy between the individual curves when there is overlapping.Reference Alwis and Burgoyne30 This, in effect, turns the necessary condition into a sufficient condition to allow reliance on the TTS method. The Williams–Landel–Ferry (WLF) equation is often usedReference Ferry29 to represent the temperature-dependent behavior of the horizontal shift factor above the glass transition temperature.
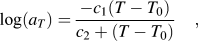
where: aT is the horizontal shift factor
T0 is the reference temperature c1 and c2 are constants.
For temperatures above the glass transition temperature, the relationship between the temperature and the horizontal shift factor, log (aT), is based on the Arrhenius equationReference Arridge31
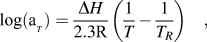
where:
ΔH is the activation energy
R is the universal gas constant
T is the absolute temperature
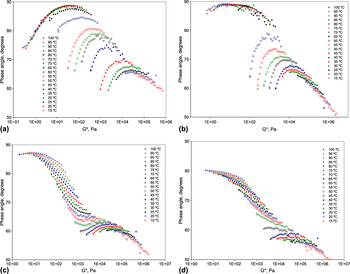
For thermorheologically complex materials the viscoelastic properties do not superpose completely if only horizontal displacements are performed. Vertical shift factors are needed to account for change in material density, hygrological effects, and thermal expansion and contraction.Reference Arridge31 Calculation of vertical shift factors is usually done by a nonlinear least squares procedure, which minimizes the weighted sum of squares of the residuals by iterating the values of some adjustable parameters.Reference Chevali, Dean and Janowski32 This task is usually performed by software. In this case, the TA Instruments Rheology Advantage/Data AnalysisTM was used to this aim. It has been reported that if a polymer undergoes a change in morphology as a result of crystallization, partial melting or crystal refinement during annealing, its relaxation spectrum will be altered and it will not follow TTS.Reference Menczel and Prime33, Reference Gurp and Palmen34 On the other hand, Black diagrams allow for checking whether a polymer is rheologically simple and TTS can be applied. These diagrams consist of plots of phase angle (δ) versus complex modulus (G*). Since they are obtained without any shifting procedure, they are a better indicator of failure or application of TTS principle than modulus master curves, which are obtained making use of shift factors to get the best possible superposition. For that reason, Black diagrams are commonly used to verify the TTS principle applicability.Reference Lesueur27Figure 4 shows the Black diagrams obtained from frequency sweep tests of the samples. It is interesting to note that the curves corresponding to the modified samples match much better than those corresponding to the unmodified ones. The unmodified curves show tails corresponding to the data obtained at low frequencies. Those tails are an indication of a non simple rheological behavior and, thus, it is expected that unmodified samples do not follow TTS.
Phase angle versus G* Black diagrams obtained from frequency sweeps of samples M1 (a), M2 (b), M3 (c), and M4 (d).

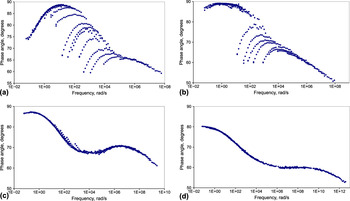
For performing TTS, a reference temperature of 100 °C was chosen. This temperature is well above the glass transition temperature of the samples. The plots, shown in Fig. 5, were obtained by horizontal displacement of the experimental curves through the TA Instruments Rheology AdvantageTM software. Small vertical shifting was applied when needed. The range of the TTS plots spans through the double range of frequency decades than the experiments. There is a small partial matching in the case of unmodified bitumen, M1 and M2, resulting in a continuous curve from which low-frequency tails emerge. These tails come from relaxations times introduced by the transitions. On the other hand, the modified bitumen, M3 and M4, show a perfect matching. Even in the case of the M4 sample, where some of the experimental curves were obtained at temperatures in the range where the asphalt is supposed to have exothermic transitions, there is no trace of extra relaxation time due to first order processes. Nevertheless, if there is a crystallization-like change of phase, as the thermal analysis results of sample M4 suggest, its relaxation time falls out of the observation time of the rheological measurements. That is, the relaxation time of the predominant phase involved in the TTS is not affected by the relaxation time of the phase transition and both relaxation times are substantially different.
TTS plots of the phase angle versus frequency of samples M1 (a), M2 (b), M3 (c), and M4 (d) at a reference temperature of 100 °C.

Figure 5 shows the master curves of the phase angle versus frequency. In the case of the M3 sample, which contains SBS, the master curve obtained indicates a rheologically simple behavior. A similar result was reported for SBS-modified bitumen.Reference Lesueur27 On the other hand, a maximum in the low-frequency range is observed for samples M1, M2 and M3. These data on the TTS plot at 100 °C come from the experiments in the 50–70 °C range. An explanation to the appearance this kind of maximum is that there is a relaxation related to the collapse of the compact structure made of asphaltene particles surrounded by solid resins.Reference Gonzalez, Pena, Munoz, Santamaria, Perez-Lepe, Martinez-Boza and Gallegos1 M4 sample does not present that relaxation in the experimental range, which is an indication that the supposedly covalent bonds produced on the asphaltene fraction prevents that structural collapse.
IV. CONCLUSIONS
Two unmodified and two modified bitumens were thermally and rheologically characterized.
The Tgs of the unmodified and modified bitumens were −30 and −22 °C. It was found that in a case crystallization-like process could be observed by TMDSC but surprisingly, that process was not apparent on the rheological curves.
The TTS plots and Black diagrams are more adequate to observe the asphaltene relaxation than plots of the phase angle versus temperature at a given frequency.
The fact that two modified bitumens, one of them experiencing a physical change in the range of experimental measurement, obey TTS means that the chemical modification makes their rheological behavior simpler with respect to the unmodified bitumens.
In the case of the SBS-modified sample, the SBS prevented the crystallization process, resulting in a simple rheological behavior. Nevertheless, Elvaloy only produced a small decrease of the crystallization process. Thus, in this case, a simple rheological behavior is a novelty and results from a change produced by Elvaloy that makes the rheological behavior insensitive to the crystallization process.
Considering that Elvaloy may react with asphaltenes establishing covalent bonds, the resulting terpolymer-asphaltenes chains would produce an important rheological contribution.
ACKNOWLEDGMENT
This work was partially funded by the Spanish Ministerio de Educacion y Ciencia MTM2008-00166 and MTM2011-22392.