INTRODUCTION
Changes in the amount of ultraviolet (UV)-B radiation due to atmospheric ozone depletion (Rozema et al. Reference Rozema, van de Staaij, Björn and Caldwell1997; Madronich et al. Reference Madronich, McKenzie, Bjorn and Caldwell1998; McKenzie et al. Reference McKenzie, Connor and Bodeker1999) have consequences for plant growth, physiology and biochemistry. Maximum values of UV-B radiation have already been reached according to model calculations of ozone and UV-B radiation (Schultz Reference Schultz2000), but seasonal fluctuations may largely exceed the average maximum of UV-B radiation due to variation in altitude, albedo, clouds and season (Madronich et al. Reference Madronich, McKenzie, Bjorn and Caldwell1998).
Grapevine is an important agricultural plant cultivated on 7·8 million ha worldwide (OIV 2007). Any reduction in the photosynthetic capacity of plants is easily observed in grapevines because reduced leaf photosynthetic performance inevitably reduces nutrient supply to the fruit. UV-B radiation affects plant performance in various ways, e.g. inactivation of photosystem II (PSII), degradation of the D1 and D2 proteins of PSII and decreased levels of chlorophyll and carotenoids (Jansen et al. Reference Jansen, Gaba and Greenberg1998). However, new concepts have been developed emphasizing the ecological significance of solar UV-B radiation much more than its role as a stressor (Jenkins Reference Jenkins2009). Consequently, interpretations of UV-B effects on plants vary depending on the concept applied.
Plants have adapted to UV-B stress through synthesis of UV-absorbing compounds (Kolb et al. Reference Kolb, Käser, Kopecký, Zotz, Riederer and Pfündel2001), altered leaf surface morphology (Karabourniotis et al. Reference Karabourniotis, Kyparissis and Manetas1993) and repair functions (Ioki et al. Reference Ioki, Takahashi, Nakajima, Fujikura, Tamaoki, Saji, Kubo, Aono, Kanna, Ogawa, Fukazawa, Oda, Yoshida, Watanabe, Hasezawa and Kondo2008). A study of the role of polyphenols in the UV-B resistance systems of plants has shown that flavonols play a major role as potential biomarkers: in white clover (Trifolium repens L.) UV-B increased quercetin glycoside levels by 200%, although the response of kaempferol glycoside was smaller (Hofmann et al. Reference Hofmann, Swinny, Bloor, Markham, Ryan, Campbell, Jordan and Fountain2000). In grey alder (Alnus incana L.) quercetin-3-galactoside, quercetin-3-glucuronide and quercetin-3-rhamnoside levels decreased in the absence of UV-B radiation, while in white birch (Betula pubescens EHRH.) a kaempferol-3-glucoside derivative and kaempferol-3-(diacetyl)-glucoside concentrations decreased only by the exclusion of both UV-A and UV-B (Kotilainen et al. Reference Kotilainen, Tegelberg, Julkunen-Tiitto, Lindfors and Aphalo2008). In grapevine, a 10-fold increase of flavonoid concentrations after UV-B treatment in leaves showed enhanced quercetin and kaempferol concentrations (Kolb et al. Reference Kolb, Käser, Kopecký, Zotz, Riederer and Pfündel2001). Although biomarkers for one specific type of environmental stress are scarce, the present authors propose that these metabolites may serve as an early warning system for UV-B stress; however, the efficiency of a biomarker will depend on the degree to which adaptations to environmental stress are already present and on the homogeneity of the investigated population (Ernst & Peterson Reference Ernst and Peterson1994). Complementation of biomarkers requires elaborate experimental setup combining functional genomics and field trials in multiple years. In a first selection step, a stringent physiological assessment is essential to analyse and confirm the candidate biomarker, both temporally and spatially in the plant. To determine the quality and potential applications of biomarkers, parallel screenings of the physiological efficiency of the plants need to be assessed. It is proposed that decreasing physiological performance must be correlated with increasing concentration of biomarkers. The preferred methods of assessing PSII performance are non-destructive, enabling monitoring of plants in situ and combining both gas exchange (Glenn et al. Reference Glenn, Wünsche, McIvor, Nissen and George2008) and chlorophyll fluorescence measurements (Burchard et al. Reference Burchard, Bilger and Weissenböck2000; Hofmann et al. Reference Hofmann, Campbell and Fountain2003; Pfündel Reference Pfündel2003; Nunez-Olivera et al. Reference Nunez-Olivera, Martinez-Abaigar, Tomas, Otero and Arroniz-Crespo2006). Gas exchange measurements allow conclusions to be drawn about a plant's photosynthetic capacity, measuring the effectiveness of the PS (e.g. stomatal conductance and sub-stomatal CO2 concentration). Chlorophyll fluorescence methods allow screening of physiological processes, based on the relaxation processes of excited molecules in the PS including conversion to heat, transfer of the energy to another molecule, a chemical change or release as another photon (fluorescence) (Krause & Weis Reference Krause and Weis1991; Harbinson & Rosenqvist Reference Harbinson, Rosenqvist, DeEll and Toivonen2003). Both measurement methods have been frequently employed in stress assessment studies in plants. In a 4-week study of olive (Olea europea L.) applying drought and enhanced UV-B radiation, no significant changes were detected in the maximum quantum yield for PSII (Fv/Fm), while the yield (ΦPS2) decreased, whereas in lavender (Lavandula stoechas L.) and rosemary (Rosmarinus officinalis L.) leaves both ΦPS2 and Fv/Fm significantly decreased after the 2nd and 3rd week of drought, respectively, in both UV-B and non-UV-B treatments (Nogues & Baker Reference Nogues and Baker2000). In winter wheat (Triticum aestivum L.), inhibition of the photosynthesis rate (Pn), decreased Fv/Fm and increased minimum fluorescence (Fo) were observed due to enhanced UV-B intensities (Yang et al. Reference Yang, Wang, Li, Duan, Loescher and Liang2007). The photochemical quenching (qP), non-photochemical quenching (NPQ), ΦPS2 and the electron transport rate (ETR) have been found to be highly correlated with salt stress in tomato leaves (Zribi et al. Reference Zribi, Fatma, Fatma, Salwa, Hassan and Néjib2009). Flexas et al. (Reference Flexas, Baron, Bota, Ducruet, Galle, Galmes, Jimenez, Pou, Ribas-Carbo, Sajnani, Tomas and Medrano2009) found that Fv/Fm was not affected by drought stress in drought-adapted grapevines.
The aims of the present study were to: (1) screen chlorophyll fluorescence and gas exchange parameters for their adequacy as indicators for UV-B stress on V. vinifera cvars Pinot noir and Riesling, (2) correlate physiological performance with the UV-B stress biomarkers quercetin-3-O-glucoside and kaempferol-3-O-glucoside and (3) evaluate the stringency of physiological indicators and biomarkers among years, cultivars and treatments under greenhouse controlled conditions including temporal effects.
MATERIALS AND METHODS
All experiments were conducted in the greenhouse at the University of Natural Resources and Life Sciences in Vienna (48°14′N, 16°20′E, 236 m asl).
Plant material
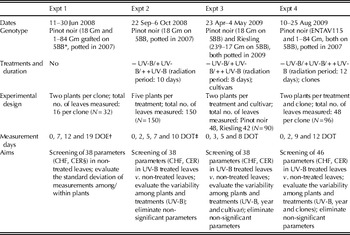
The grapevine cultivars used were Pinot noir and White Riesling. All plants used in the experiments were grafted on rootstock 5BB (Vitis berlandieri×Vitis riparia) and grown in 3-litre pots in greenhouses until used in the experiment (Table 1). Throughout the experiments, plants were irrigated and fertilized (Ferty 3 Mega concentrate, comprised 0·18 N, 0·12 P2O5, 0·18 K2O and 0·2 MgO, Planta, Regenstauf, Germany) at regular intervals according to the recommendations of the supplier (1 mg/l), for maintaining optimum water and nutrient supply during the study.
Design of experiments

* 5BB, Rootstock (V. berlandieri × V. riparia).
† DOE, day of experiment.
‡ DOT, day of treatment.
§ CHF, chlorophyll fluorescence; CER, gas exchange.
UV-B radiation treatment
Photosynthetically active radiation (PAR) (165 μmol/m2/s on average at high noon under the +UV-B treatments) was supplied from 06·00 to 20·00 h and UV radiation was supplied in the middle of the PAR period, ensuring equal radiation conditions in all experiments (i.e. the overall PAR remained the same, while the amount of UV was different). Plants were exposed to three different UV-B treatments (designated −UV-B, +UV-B and ++UV-B). PAR was provided by halogen lamps (Powerstar HQI-BT 400W/D; Osram, Munich, Germany) mounted 1000 mm above plant level. PAR, UV-A and UV-B radiation were monitored using a PAR quantum sensor SKP 215, a UV-A sensor SKU 420 and a UV-B sensor SKU 430 connected to a DataHog2 data logger (Skye instruments, Llandrindod Wells, Great Britain). UV radiation was supplied by UV-B fluorescent lamps (TL 40 W/12 RS SLV, Philips, Hamburg, Germany) with no solar UV radiation passing the greenhouse cover. Lamps were pre-burnt for 100 h before use in UV-B experiments to ensure stable spectral irradiance (Adamse & Britz Reference Adamse and Britz1992). The exact distances between UV-B lamps and leaves were determined for each leaf analysed. The UV lamps of the −UV-B treatment were wrapped in 0·125 mm Mylar A foils (Pütz, Taunusstein, Germany), which absorbs radiation below 320 nm. Lamps of the +UV-B and ++UV-B treatment were wrapped in 0·095 mm cellulose diacetate N95 foils (Pütz, Taunusstein, Germany) which were pre-illuminated for 8 h to ensure stable absorption and which were changed after 5 days of illumination (Adamse & Britz Reference Adamse and Britz1992; McLeod Reference McLeod1997). UV-B dosages reproducing local UV-B conditions on a cloudless day in August for the +UV-B treatment and assuming a 20% ozone depletion for the ++UV-B treatment were calculated using a UV simulation tool (Engelsen Reference Engelsen2005). Lamps and filters were calibrated by spectroradiometer (DM 150, Bentham Instruments, Reading, Great Britain) and daily dosages per treatment were computed. Daily doses of UV-B radiation supplied 250 mm below the UV-B lamps was 4856·3 J/m2 UV-BBE for the +UV-B treatment and 7025·3 J/m2 UV-BBE for the ++UV-B treatment (achieved by longer illumination times for the ++UV-B treatment) based on the generalized plant action spectrum (Caldwell Reference Caldwell and Giese1971), normalized to 300 nm and calculated using a model proposed earlier (Green et al. Reference Green, Sawada and Shettle1974; Björn & Teramura Reference Björn, Teramura, Young, Björn, Moan and Nultsch1993). Critical parameters in UV-B studies using artificial light sources are the use of a well-calibrated spectroradiometer, providing a reliable base for calculations of UV-B doses, and a realistic PAR:UV ratio. Both have been considered in the present study and a radiation ratio comparable to other studies was used (Hofmann et al. Reference Hofmann, Swinny, Bloor, Markham, Ryan, Campbell, Jordan and Fountain2000). All experiments were conducted in a stepwise design as listed in Table 1.
Measurement of physiological parameters
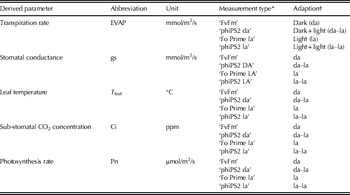
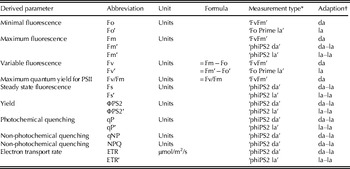
For each measurement day, two leaves per plant (two from leaves two to six, counted from the bottom to the apex) were used. The chlorophyll fluorescence and gas exchange parameters of leaves were measured using the Ciras-2 photosynthesis system (PP Systems, Amesbury, Massachusetts, USA) equipped with a PLC6 leaf cuvette and a chlorophyll fluorescence module (CFM), in both light-adapted (la) and dark-adapted (da) leaves. Dark adaption was achieved by wrapping the leaves for at least 30 min in aluminium foil (according to Hansatech Instruments 2006). The pulse amplitude modulation (PAM)-based system used a defined measuring area of 250 mm2. The cuvette flow was set at 200 ml/min, reference CO2 concentration was set to 381 ppm and reference H2O was set to half of ambient. Two measurement types were applied for each light adaption state. The measurement type ‘FvFm’ consisted of measuring a da leaf that was exposed to a light intensity of 6000 μmol/m2/s for 2·5 s, while the ‘Fo Prime la’ measurement included the measurement of an la leaf after a far red light adaption period of 60 s. Measurement type ‘phiPS2’ was applied after both the ‘FvFm’ and the ‘Fo Prime la’ measurements (da–la and la–la, respectively), after adaption to ambient light conditions and full re-oxidation of PSII reaction centres. The physiological parameters derived for each measurement type are listed in the Appendix (Tables A.1 and A.2).
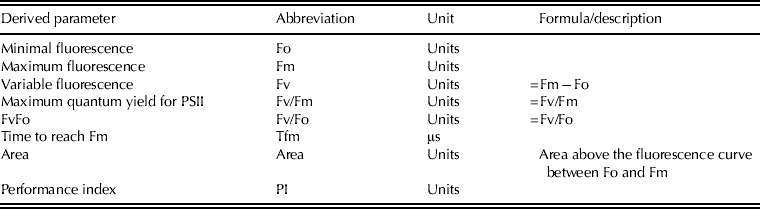
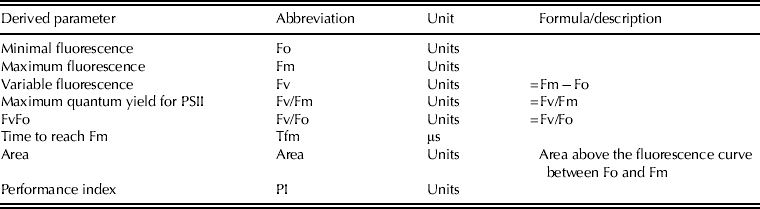
The measurements conducted produced a maximum of 38 parameters for each leaf. After monitoring, leaves were harvested and immediately frozen in liquid nitrogen for further chemical analyses. In Expt 4, the parameters stomatal conductance (gs), sub-stomatal CO2 concentration (Ci) and Pn were measured on 10 and 13 August only. Dark adapted leaves were additionally measured using a Handy Plant Efficiency Analyser (PEA) Chlorophyll Fluorometer (Hansatech Instruments, Norfolk, England) to measure fast chlorophyll fluorescence induction kinetics. Parameters measured via the Handy PEA are listed in the Appendix (Table A.3). Highly significant correlations (P<0·01) between parameters measured both with the Ciras-2 and the Handy PEA were detected for the maximum fluorescence (Fm) (Pearson's correlation coefficient 0·869), the variable fluorescence (Fv) (0·914) and Fv/Fm (0·933), confirming the reliability of both systems (data not shown).
When applying chlorophyll fluorescence measurements in UV-B assays with plants, especially, in apically dominated and climbing species such as Vitis, researchers must be aware of certain pitfalls. (1) Time of measurements: Measurements need to be done in the exactly same time frame for each measurement day. Light adapted leaves are analysed around noon; da leaves are analysed during the night after sufficient time for dark adaption (mostly determined by Fv/Fm curves as suggested by Rosenqvist & van Kooten Reference Rosenqvist, van Kooten, DeEll and Toivonen2003) or independently using foils or leaf clips for dark adaption. (2) Calibration of stress effects: the measurement procedure on grapevine leaves includes the selection of leaf insertion position, the variation among the selected positions and defined measurement area on the leaves (e.g. defined leaf area to leaf discs of 250 mm2 disregarding the heterogeneity of photosynthesis across the leaf blade) (Rosenqvist & van Kooten Reference Rosenqvist, van Kooten, DeEll and Toivonen2003). (3) Shading of leaves: Vitis vinifera is determined by apical dominance. In the case of radiation assays where the light source is mounted above the plants, the effect of leaf-to-leaf shading must be avoided by using lateral light sources (Zinser Reference Zinser1996) or by leaf removal. The ability of grapevine stems to actively move the leaf blade to an optimal position in relation to the light provides an additional challenge to radiation studies.
Analyses of polyphenols
Standards of quercetin-3-O-glucoside (HPLC-grade, ⩾99 mg/g purity) and kaempferol-3-O-glucoside (HPLC-grade, ⩾99 mg/g purity) were obtained from Extrasynthese (Lyon Nord, Genary, France). In Expt 1, all leaves per plant were harvested and analysed to perform a screening of within-plant reproducibility of the biomarkers (Schoedl et al. Reference Schoedl, Schuhmacher and Forneck2012). In Expts 2, 3 and 4 two leaves per plant were sampled per day, resulting in 87, 90 and 97 leaves analysed, respectively. Sample processing and analyses of leaves were conducted as described previously in Schoedl et al. (Reference Schoedl, Forneck, Sulyok and Schuhmacher2011) and modified in Schoedl et al. (Reference Schoedl, Schuhmacher and Forneck2012) using an ESI-LC-MS/MS system (liquid chromatography–electrospray ionization tandem mass spectrometry).
Statistical analysis
The experimental setup of all UV-B experiments was similar, allowing combination of data from Expts 2, 3 and 4 for general analysis. Only leaves of low insertion levels (basipetal leaves of the same age) were used, and a correction of the measured values of parameters by attained radiation doses was not applied since the leaves of any one plant influenced each other physiologically. Instead, calculations were based on mean values of both basipetal leaves per plant as verified in a pre-test to study the influence of the insertion level of leaves. No significant differences were detected between leaf groups (upper v. lower basipetal leaf) in any case (data not shown).
Homogeneity of variances was assessed using the test of Levene (Reference Levene, Olkin and Hotelling1960), while normal distribution was tested by applying the normality test of Shapiro & Wilk (Reference Shapiro and Wilk1965). To study differences between leaf groups, cultivars, measurement dates and clones, the Kruskal and Wallis U-test (Kruskal & Wallis Reference Kruskal and Wallis1952) and the H-test of Mann & Whitney (Reference Mann and Whitney1947) were applied. Levels of significance were corrected using the Bonferroni–Holm method (Holm Reference Holm1979). A general linear model (GLM) was used to analyse effects of cultivar, experimental year and treatment and their interactions. Correlations between physiological parameters and biochemical compounds were assessed using Pearson's correlation coefficient (Rodgers & Nicewander Reference Rodgers and Nicewander1988). Unless otherwise indicated, P⩽0·05 was taken as significant. All data were analysed by SPSS 16·0 and 18·0 for Windows (SPSS Inc., Chicago, USA).
RESULTS
Selection and variability of parameters for UV-B radiation stress
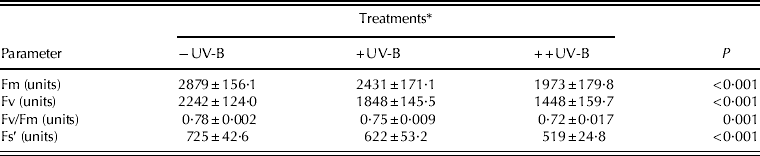
As a prerequisite for stress studies, the variation of parameters in untreated grapevine leaves were determined using coefficients of variation (CV) which ranged from 0·025 to 0·15 for the seven parameters transpiration rate (EVAP) (la) and (la–la), Fm, Fv, Fv/Fm, steady state fluorescence (Fs′) and Fv/Fo (data not shown). These were selected as UV-B stress indicators, significantly indicating UV-B stress in different doses and tested by effects of year and cultivar. The effect of UV-B radiation stress doses on selected UV-B stress indicators (Table 2) showed that treatment ++UV-B always had significantly lower values than the treatment −UV-B.
Parameters detecting differences between UV-B treatments* (Expt 3). Values are means and standard errors. For parameter notation, see Tables A.1 and A.2 in the Appendix
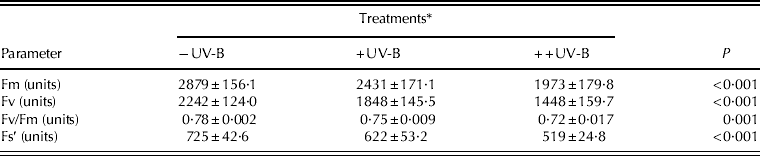
* −UV-B treatment: no UV-B radiation; +UV-B treatment: daily dose of 4856·3 J/m2 UV-BBE; ++UV-B treatment: daily dose of 7025·3 J/m2 UV-BBE.
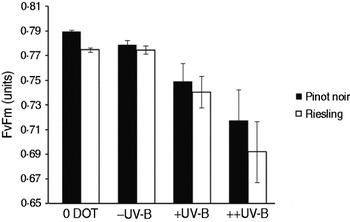
The variability of measured data points of the photosynthetic parameters progressed as the applied dose of UV-B radiation increased (e.g. Fm or Fv/Fm), complicating the selection of reliable stress indicators (Fig. 1). In accordance with this, the variability of EVAP (la) and (la–la) showed no clear trend, but CVs were always highest in the ++UV-B treatment (0·28 compared with 0·19 and 0·17, respectively, in the +UV-B and −UV-B treatment).
Chlorophyll fluorescence parameter Fv/Fm prior radiation treatment and after treatments (Expt 3). Values are means (N=3–6), bars indicate standard errors. P-value for comparison of treatments: 0·001. DOT: day of treatment; −UV-B treatment: no UV-B radiation; +UV-B treatment: daily dose of 4856·3 J/m2 UV-BBE; ++UV-B treatment: daily dose of 7025·3 J/m2 UV-BBE.

Cultivar
To elucidate the influence of cultivar (red v. white) on the parameters’ ability to indicate UV-B stress, non-parametric tests were performed on Pinot noir and Riesling. The results showed that the cultivar influenced the UV-B differentiation of the selected seven parameters: Fm, Fv and Fv/Fm never differed between the cultivars in any of the treatments, whereas Fs′ did not indicate any cultivar differences before the application of the highest UV-B dose (++UV-B treatment). The gas exchange parameter EVAP (la–la) was able to differentiate the cultivars at no (−UV-B) and low (+UV-B) radiation doses (data not shown). Fv/Fm and EVAP (la–la) are shown (Table 3) as examples of a cultivar-independent and -influenced indicator.
Parameters indicating differences and equality between the cultivars Pinot noir (red) and Riesling (white) plotted against treatments*. Values are means±s.e.. For parameter notation, see Tables A.1 and A.2 in the Appendix

* −UV-B treatment: no UV-B radiation; +UV-B treatment: daily dose of 4856·3 J/m2 UV-BBE; ++UV-B treatment: daily dose of 7025·3 J/m2 UV-BBE.
Year
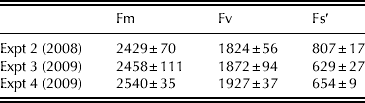
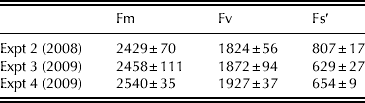
Univariate variance analysis showed a significant influence of experimental year on EVAP (la) and (la–la), Fs′ and Fv/Fo, but not on Fm, Fv or Fv/Fm (Table 4). No significant interactions between treatment and year were found in any of the seven parameters chosen, confirming the selection of parameters based solely on the influence of the treatment and eliminating possible interferences of experimental date.
Chlorophyll parameters Fm and Fv (year-independent) and Fs′ (influenced by experimental year) in dependence on experimental year. Values are means±s.e.. For parameter notation, see Tables A.1 and A.2 in the Appendix
Relationships between physiological parameters and polyphenols
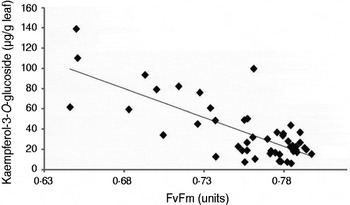
Seven possible UV-B stress indicators were selected and tested for correlation with the polyphenols kaempferol-3-O-glucoside and quercetin-3-O-glucoside. Significant correlations (P<0·01) in data of all UV-B experiments were detected for both polyphenols and chlorophyll fluorescence parameters Fm (Pearson's correlation coefficient −0·501 and −0·507), Fv (−0·560 and −0·545), Fv/Fm (−0·658 and −0·520) and Fv/Fo (−0·702 and −0·619), whereupon all correlations showed indirect relationships (Fig. 2).
Correlation graph of Fv/Fm and kaempferol-3-O-glucoside (Expt 4). Pearson's correlation coefficient is 0·759, correlation significant P<0·01.

Based on all presented characteristics of parameters, the chlorophyll fluorescence parameters Fm, Fv and Fv/Fm are suggested as UV-B stress indicators confirmed by their cultivar- and year-independency.
DISCUSSION
Calculation of applied UV-B doses
Literature research revealed that applied doses of UV-B radiation vary widely, both in terms of daily dose applied (e.g. 12, 13·3, 24, 49, 2·6 or 4·9 kJ/m2) and duration of radiation treatment in general, ranging from 4 days to 12 weeks (Burchard et al. Reference Burchard, Bilger and Weissenböck2000; Hofmann et al. Reference Hofmann, Swinny, Bloor, Markham, Ryan, Campbell, Jordan and Fountain2000; Nogues & Baker Reference Nogues and Baker2000; Alexieva et al. Reference Alexieva, Sergiev, Mapelli and Karanov2001; Skórska & Szwarc Reference Skórska and Szwarc2007; Calderini et al. Reference Calderini, Lizana, Hess, Jobet and Zúniga2008; Majer & Hideg Reference Majer and Hideg2012). The UV-B radiation reaching the earth's surface is much smaller than UV-A due to atmospheric depletion, but in the shorter wavelength of the UV-B region many biological responses are far greater (Madronich et al. Reference Madronich, McKenzie, Bjorn and Caldwell1998). Therefore, the dependency of sensitivity to UV exposure on wavelength must be included in experiments and can be achieved by weighting the radiation at different wavelengths by factors representing its relative biological effectiveness, labelled by UV-BBE. In the present study, Caldwell's generalized plant action spectrum was used (Caldwell Reference Caldwell and Giese1971; Green et al. Reference Green, Sawada and Shettle1974), which is the most commonly used weighting function for terrestrial plants (Flint & Caldwell Reference Flint and Caldwell2003). This weighting function does not accept any effectiveness of wavelengths longer than 313 nm; therefore, using different biological spectral weighting functions (e.g. the one proposed by Flint & Caldwell (Reference Flint and Caldwell2003) and applied to grapevine leaves by Majer & Hideg (Reference Majer and Hideg2012)) may significantly modify the experimental setup and results obtained.
Adaption state of leaves
Testing parameters in all four adaption states (da, da–la, la and la–la) led to different results among the light regimes, emphasizing the need to take the applied light regime into account while comparing studies on photosynthetic parameters, e.g. measurements after dark adaption, which are then followed by continuous illumination with actinic light to measure, e.g. the Fs in salt-stressed tomato plants (Zribi et al. Reference Zribi, Fatma, Fatma, Salwa, Hassan and Néjib2009) or measuring chlorophyll fluorescence of da grapevine leaves and after illumination with an intense light pulse (Bertamini et al. Reference Bertamini, Muthuchelian and Nedunchezhian2004). Leaves adapted to the described light regimes differ in the relaxation state of their photosynthetic reaction centres (e.g. fully oxidized in ‘da’ to fully reduced after the saturation pulse in ‘la’). Hence, the state in which the photosynthetic parameters are measured strongly influence the result, simultaneously multiplying the number of available parameters. The physiological processes underlying adaption states have been reviewed (e.g. Roháček Reference Roháček2002); however, to our knowledge no studies elucidating the states on the parameters under stress conditions have been published.
Screening of physiological performance parameters for their straightforward adequacy as indicators for UV-B stress
Within and among plant variability in gas exchange and chlorophyll fluorescence parameters are essential for their use as indicators in combination with biomarkers. Variability of less than 10% in fluorescence measurements on the leaf blade has been detected (Flexas et al. Reference Flexas, Baron, Bota, Ducruet, Galle, Galmes, Jimenez, Pou, Ribas-Carbo, Sajnani, Tomas and Medrano2009) and no significant differences were found in the present study between leaves of different insertion levels for basal leaves (data not shown). In addition, the magnitude of CVs was shown to be parameter-dependent.
Genotype (red v. white) significantly affected the UV-B stressed parameters: Fm′ (da–la and la–la), Fs and Fs′ were significantly different in highly dosed UV-B treated plants (++UV-B), whereas no differences were found in untreated plants (data not shown). The radiation treatment induces UV-sensitive metabolite cascades in leaves (measured either in the da–la or the la–la adaption state), which may affect photochemical and/or non-photochemical processes (e.g. photochemical quenching of Fm′ to Fs, which influences the transition of a sample from the da to the la state; Roháček Reference Roháček2002). Red and white grapevine cultivars are characterized by berry colour, but also differ in other leaf-based metabolites, e.g. flavonoids (Darné & Glories Reference Darné and Glories1988). In addition to the differences of physiological performance in leaves of red and white grape after stress impact shown in the present study, red and white cultivars are known to differ in leaf discolouration following nutrition deficits (Mullins et al. Reference Mullins, Bouquet and Williams2004) or pathogen impact (Rayapati et al. Reference Rayapati, O'Neal and Walsh2008). In a study on transcriptional profiles of various coloured cultivars (Castellarin & Di Gaspero Reference Castellarin and Di Gaspero2007), the expression of the anthocyanin pathway genes flavanone-hydroxylase (F3H), UDP-glucose:flavonoid-3-O-glucosyltransferase (UFGT) and glutathione-S-transferase (GST) were shown to correlate with anthocyanin concentration in fully matured berries. UFGT and GST were absent in a green-skinned cultivar and expression was reduced in pale red cultivars (Castellarin & Di Gaspero Reference Castellarin and Di Gaspero2007), demonstrating these genes as a differentiating factor in un-stressed cultivars. Under stress (water deficit), the metabolic pathways of phenylpropanoids in general and absicisic acid (ABA), isoprenoid, carotenoid, amino acid and fatty acid metabolism pathways in specific have been shown to be affected with expression of a diverse reaction pattern in the white (Chardonnay) and red (Cabernet Sauvignon) cultivar studied (Deluc et al. Reference Deluc, Quilici, Decendit, Grimplet, Wheatley, Schlauch, Merillon, Cushman and Cramer2009). The results of the above-mentioned studies clearly demonstrate the differing reactions of various pathways due to stress in red and white cultivars, which may also include responses in photosynthetic performance and stimulations of protective mechanisms.
Grapevine clones are employed in modern viticulture and current research shows that clonal genotypes of a common cultivar may differ in quality-based traits (e.g. berry colour, leaf shape and growth habit) (Blaich et al. Reference Blaich, Konradi, Ruhl and Forneck2007; Forneck et al. Reference Forneck, Benjak, Rühl, Schön, Martens and Dijk2009). The present study showed no significant differences in the stress response to UV-B radiation between clones of Pinot noir (18 Gm, 1–84 Gm, ENTAV115) if screened with selected parameters (EVAP (la) and (la–la), Fm, Fv, Fv/Fm, Fs′ and Fv/Fo). Therefore, the selection of described UV-B stress indicators could be confirmed as independent of the clone for red cultivars. The low discriminative potential of parameters shown in the present paper can be explained by the natural variability of chlorophyll fluorescence and low contrast between cultivars and clones, as reported previously by Mishra et al. (Reference Mishra, Matouš, Mishra and Nedbal2009). However, these results are not in agreement with a previous study screening the UV-B stress response of various Riesling clones (Anhalt et al. Reference Anhalt, Schoedl and Forneck2011), where the combination of Fm′ (da–la), ETR (da–la), Fo′ (la) and Fm (da–da) showed clonal variation. However, the current study employed far more replicates of the red cultivar clones.
Correlation of physiological performance with two UV-B stress biomarkers
Polyphenols and especially flavonols have often been reported to be affected by UV-B radiation (Hofmann et al. Reference Hofmann, Swinny, Bloor, Markham, Ryan, Campbell, Jordan and Fountain2000; Kotilainen et al. Reference Kotilainen, Tegelberg, Julkunen-Tiitto, Lindfors and Aphalo2008); therefore quercetin-3-O-glucoside and kaempferol-3-O-glucoside were selected in the present study as target metabolites serving as biomarkers for UV-B stress. Correlations with the two flavonols were found to be significant for Fm, Fv and Fv/Fm, which confirms the flavonols’ function as biomarkers for UV-B stress. As hypothesized, the physiological parameters (Fm, Fv and Fv/Fm) indicated decreasing photosynthetic capacity with increasing concentration of flavonols as a stress response to UV-B radiation. As a result, it is proposed that the chlorophyll fluorescence parameters Fm, Fv and Fv/Fm can be used as stress indicators for UV-B studies in grapevine in addition to the biomarkers kaempferol-3-O-glucoside and quercetin-3-O-glucoside. The general possibilities and limitations of these photosynthetic indicators have been described elsewhere (Baker & Rosenqvist Reference Baker and Rosenqvist2004; Soja & Soja Reference Soja and Soja2005; Mishra et al. Reference Mishra, Matouš, Mishra and Nedbal2009; Zribi et al. Reference Zribi, Fatma, Fatma, Salwa, Hassan and Néjib2009). The parameters proposed are measured on da leaves, indicating the effects of UV-B radiation stress on the relaxation state of PSII reaction centres. In da leaves, all reaction centres are open and fully oxidized (Harbinson & Rosenqvist Reference Harbinson, Rosenqvist, DeEll and Toivonen2003). A significant difference in Fo indicates a reduction in the ability of the PSII reaction centres of UV-B stressed leaves to reach full oxidization, whereas a difference in Fm points to a reduced ability to use absorbed light energy for photochemical processes. Consequently, electron transport through the PS is disturbed, which results in reduced photosynthetic efficiency (Baker & Rosenqvist Reference Baker and Rosenqvist2004).
The present study confirms previous studies in which Fv/Fm and Fo have already been used in UV-B studies, e.g. in winter wheat (T. aestivum) (Yang et al. Reference Yang, Wang, Li, Duan, Loescher and Liang2007), lavender (Lavandola angustifolia) and rosemary (R. officinalis) (Nogues & Baker Reference Nogues and Baker2000). Fv/Fm has been described as an indicator for photo-inhibition caused by stress and photosynthetic performance in general, with values of 0·83–0·76 being described as excellent, 0·75–0·70 as good and 0·69–0·66 as fair for trees in a northern temperate climate (Genty et al. Reference Genty, Briantais and Baker1989; Mohammed et al. Reference Mohammed, Zarco-Tejada, Miller, DeEll and Toivonen2003; Baker & Rosenqvist Reference Baker and Rosenqvist2004; Bertamini et al. Reference Bertamini, Muthuchelian and Nedunchezhian2004). However, values less than 0·83 were suggested by Maxwell & Johnson (Reference Maxwell and Johnson2000) to indicate stress. According to these thresholds, Fv/Fm values in the present experiment are optimal for the plants on day 0 and the −UV-B plants, although the maximum values of up to 0·83 have not been achieved.
The efforts in the present study to select a set of robust and stringent parameters reflecting UV-B stress in grapevine resulted in a set of seven indicators most suitable under the experimental conditions. These indicators are relative and reflect the environmental conditions during the experiment as well as the pre-treatment conditions of perennial grapevine during dormancy. Finally, the selection of parameters Fm, Fv and Fv/Fm as UV-B stress indicators was confirmed by relating them to polyphenolic biomarkers for UV-B stress. The present study provides insights into measurement schemes and procedures of parameter selections as a basis for further studies on UV-B stress reaction and adaption processes. Based on this screening technique for physiological performance in grapevine, efficient screenings and analyses of potential biomarkers for UV-B stress are possible.
The project was supported by the Federal Ministry of Agriculture, Forestry, Environment and Water Management of Austria, the ‘Niederösterreichischer Weinbauverband’, the ‘Raiffeisen Lagerhaus AG’ and the ‘Österreichischer Rebveredlerverband’. The authors wish to thank all members of the project ‘Physiological Fingerprinting in Viticulture’ for their support and collaboration. We are thankful to Marietta Doerfler, Klaus Kalcher and Georg Rohrauer for their input and hands on work in the trial and to Gerhard Soja for providing the Handy PEA instrument. The presented work contributes in part to the PhD thesis of Katharina Schoedl.
APPENDIX
Gas exchange parameters obtained using the Ciras-2 photosynthesis system

Chlorophyll fluorescence parameters obtained using the Ciras-2 photosynthesis system

Chlorophyll fluorescence parameters obtained by using the Handy PEA