Introduction
Late-onset Alzheimer disease (LOAD) is a clinically heterogeneous complex disease presumed to result from the interaction of multiple genetic and environmental risk factors (Holmans et al., Reference Holmans2005; Bertram et al., Reference Bertram, McQueen, Mullin, Blacker and Tanzi2007). It is defined by progressively disabling cognitive impairment. LOAD is also associated with frequent behavioral symptoms, such as psychosis, that are associated with greater cognitive (Ropacki and Jeste, Reference Ropacki and Jeste2005) and functional (Scarmeas et al., Reference Scarmeas2005) decline. Longitudinal symptom course has not been clearly delineated in LOAD, and this contributes significantly to phenotypic heterogeneity (Healy, Reference Healy2006; Tyas et al., Reference Tyas2007). Questions remain regarding the natural history of disease factors affecting rate of decline, and whether AD is a single disease or a heterogeneous combination of closely related disorders with varying patterns of cognitive and behavioral decline.
The goals of most longitudinal studies involving signs and symptoms of LOAD include characterization of individual patterns of change (trajectories), how these patterns vary according to demographic, clinical and/or genetic characteristics, and how much individuals with the same characteristics vary from one another. Longitudinal studies have many advantages over cross-sectional studies but are more complex analytically. A variety of analytical approaches have been used for such tasks, including two-stage analysis (Mann et al., Reference Mann, Mohr, Gearing and Chase1992), hierarchical (mixed) models (Rasmusson et al., Reference Rasmusson, Carson, Brookmeyer, Kawas and Brandt1996), and structural equation (latent growth curve) models (Royall et al., Reference Royall, Palmer, Chiodo and Polk2005). These methods tend to minimize or obscure the fact that similar subjects may follow quite different trajectories.
Latent class trajectory models have been applied successfully in a variety of longitudinal studies in psychiatry in recent years (Curran and Willoughby, Reference Curran and Willoughby2003), and offer several methodological advantages. These include the grouping of similar individual trajectories into interpretable classes, which may then be used to identify additional underlying genetic and/or environmental causes of differences in disease trajectories. Recent examples of latent class trajectory models include psychological adjustment to breast cancer (Helgeson et al., Reference Helgeson, Snyder and Seltman2004) and functional changes in elderly people without dementia (Dodge et al., Reference Dodge, Du, Saxton and Ganguli2006). These models, which should not be confused with latent growth curve models, are usually formulated as an extension of mixed models, in which a given subject may follow a weighted mixture of several entirely different trajectories. The weights represent a set of probabilities, one for each trajectory. In some cases, many subjects have most of their probability focused on a single trajectory; in which case the trajectories can be thought of as potential paths that different subjects can follow. It is here that the term “latent class” is most appropriate: the trajectories represent different classes of subjects whose existence is inferred from the patterns in all of the data. In other cases, subjects’ probabilities include two or more trajectories with substantial probability. In the latter instance, the model trajectories are better thought of as a mathematical approach to modeling heterogeneity beyond what can be well characterized by mixed models (Jones et al., Reference Jones, Nagin and Roeder2001), and careful thought needs to go into the interpretation of results.
We sought to use latent class modeling to characterize the trajectories of cognitive decline, including the effects of demographic and clinical covariates, in a cohort of 201 patients with a final diagnosis of possible/probable AD. We report findings from subjects evaluated for cognitive and behavioral (psychosis) symptoms at regular intervals of up to 13.5 years. The analysis showed that divergent trajectories could be defined, enhancing phenotypic resolution. Among other possibilities, differing trajectories may reflect the distinct contributions of underlying pathologies (e.g. amyloid, tau, vascular, and Lewy body) and/or of specific genetic variants.
Methods
Subjects
Between 1987 and 2007, 210 Caucasian subjects with a final diagnosis of possible or probable AD were evaluated at the University of Pittsburgh Alzheimer Disease Research Center (ADRC), Pittsburgh, U.S.A. Demographic information was recorded at the initial visit. Complete medical and neuropsychiatric histories and examinations were conducted, and diagnoses recorded. A comprehensive neuropsychological test battery was administered to all subjects as previously described (Lopez et al., Reference Lopez, Kuller, Fitzpatrick, Ives, Becker and Beauchamp2003). Following evaluation, subjects were diagnosed with possible or probable AD using criteria of the National Institute of Neurological and Communicative Disorders and Stroke-Alzheimer Disease and Related Disorders Association (NINCDS-ADRDA; McKhann et al., Reference McKhann, Drachman, Folstein, Katzman, Price and Stadlan1984). Diagnostic assessments including interim histories, neurological exams, and neuropsychological testing were repeated annually during clinic visits and used to confirm or revise clinical diagnoses as needed. Patients with schizophrenia or bipolar disorder using DSM-IV criteria, or probable dementia with Lewy bodies (McKeith et al., Reference McKeith1996) at their initial or follow-up assessments were excluded. The rate of autopsy confirmation of AD in subjects diagnosed with possible or probable AD exceeds 90% in our center (Lopez et al., Reference Lopez, Kuller, Fitzpatrick, Ives, Becker and Beauchamp2003). All data collected in this study were obtained with protocols approved by the Institutional Review Board of the University of Pittsburgh.
Assessment of cognition
Cognition was evaluated serially with the Mini-mental State Examination (MMSE; Folstein et al., Reference Folstein, Folstein and McHugh1975). This global test of cognitive function was administered to subjects at least annually at clinic visits. Subjects with fewer than four MMSE scores (to allow fitting of a quadratic curve) were excluded.
Assessment of psychosis
Psychosis was evaluated with the CERAD behavioral rating scale (CBRS; Tariot et al., Reference Tariot1995). The CBRS measures the extent of behavioral pathology in persons with dementia and was designed to be administered to an informant. Psychosis was defined by the presence of persistent hallucinations or delusions occurring at any time during the course of the dementia. A delusion was defined as a false belief based on incorrect inference about external reality, resistant to persuasion or contrary evidence, and not attributable to social or cultural mores. Hallucinations were defined as sensory perceptions for which there was no basis in reality. Discrete hypnogogic and hypnopompic hallucinations, as well as symptoms occurring only during an episode of delirium, were not rated. Inter-rater reliability for the determination of psychosis using the CBRS at the ADRC has been established and is uniformly high, with mean (SD) κ 0.98 (0.08) for classification of presence of psychosis and κ ranging from 0.98 (0.08) to 1.0 (0.0) for classification of presence of individual psychosis symptoms. The CBRS was administered at initial and annual visits.
Genotyping
DNA for determination of apolipoprotein E genotype was isolated with the QIAmp kit from Qiagen (Chatsworth, CA). Genotyping was performed using an established PCR protocol previously described (Kamboh et al., Reference Kamboh, Aston and Hamman1995).
Statistical analysis
The analyses undertaken were latent class mixture models of quadratic trajectories including a random intercept and concomitant variables. Models were fit using the FlexMix package (Leisch, Reference Leisch2004) of the statistical program R, version 2.8.1, from the R Foundation for Statistical Computing (R Development Core Team, 2007). In the analyses, MMSE scores at entry and each return visit were modeled as a continuous outcome measure. Psychosis status was defined by the presence of persistent hallucinations or delusions, operationalized for the CBRS as a score of 2, 3 or 4. Psychosis burden was defined using the maximum (per visit) sum of the psychosis items as scored on the CBRS: 0 = never occurred; 1 = 1–2 days in past month; 2 = 3–8 days in past month; 3 = 9–15 days in past month; 4 ≥ 16 days in past month. Models used either psychosis burden or psychosis status as concomitant variables.
Data were modeled by mixed models without the latent class component and with latent class trajectory models. Both types of models were built with generalized linear models using a quadratic function of time, and a random intercept for the group trajectories. The mixed models also used a random slope, and the latent class trajectory models used multinomial logit models for the concomitant variables to define the probabilities that a given subject will be grouped in a particular trajectory. Initial MMSE score, age, gender, education, psychosis status or burden, and APOE ϵ4 count were modeled as concomitant variables in the latent class trajectory models and as independent variables (with and without interaction with time) in the mixed models. Model parameters were estimated with the Expectation-Maximization (EM) algorithm, which finds the (local) maximum likelihood parameters for each model. Because latent class models may have local maxima, we used 20 random starting values for each model, which we found to have a very high chance of finding the global maximum. In addition, for each set of concomitant variables tested, we ran models with 1 through 8 latent trajectories, and chose the best fitting model. Relative goodness-of-fit was assessed using Bayesian Information Criteria (BIC) (Schwarz, Reference Schwarz1978).
For analyses including APOE ϵ4 we dropped the one subject with missing data. For both the mixed models and the latent class trajectory models, missing observations in years need no special handling because time is modeled explicitly (not visit number) and because both models are unbiased for missing at random data.
Results
Subject characteristics
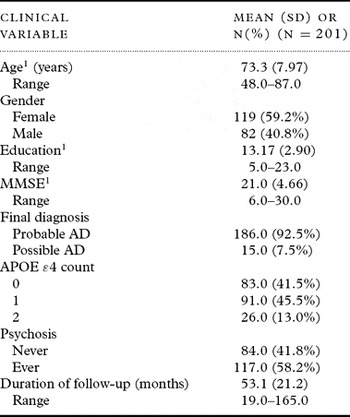
Demographic and clinical characteristics of our subjects are presented in Table 1. The average baseline age of individuals in the study was 73.3 years. Slightly over half were female (59.2%), and the average number of years of education was 13.2. Most subjects carried a diagnosis of probable AD (92.5%), with the remainder classified as possible AD (7.5%). Most participants demonstrated mild to moderate impairment at presentation as reflected by a mean baseline MMSE score of 21.0. Approximately half of all subjects (58.2%) exhibited psychotic behavior during follow-up, consistent with other reports. Mean duration of follow-up was 53.1 months, resulting in a total of 1500 visits available for mixed and trajectory modeling in the 201 subjects. Baseline age decreased as the number of APOE ϵ4 alleles increased (median ages for 0 to 2 alleles are 77, 74 and 72 years; Kruskal-Wallis χ2 = 7.78, p = 0.02, data not shown).
Demographic and clinical characteristics

MMSE = Mini-mental State Examination
1 Baseline values
Mixed modeling of cognitive course
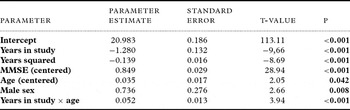
The results from the best mixed model using backward stepwise selection from a model with all interactions are shown in Table 2. The standard deviation of the random intercept is 0.90 and the random slope is 1.32.
Parameters of mixed model of AD subjects

MMSE = Mini-mental State Examination
Trajectory modeling of cognitive course
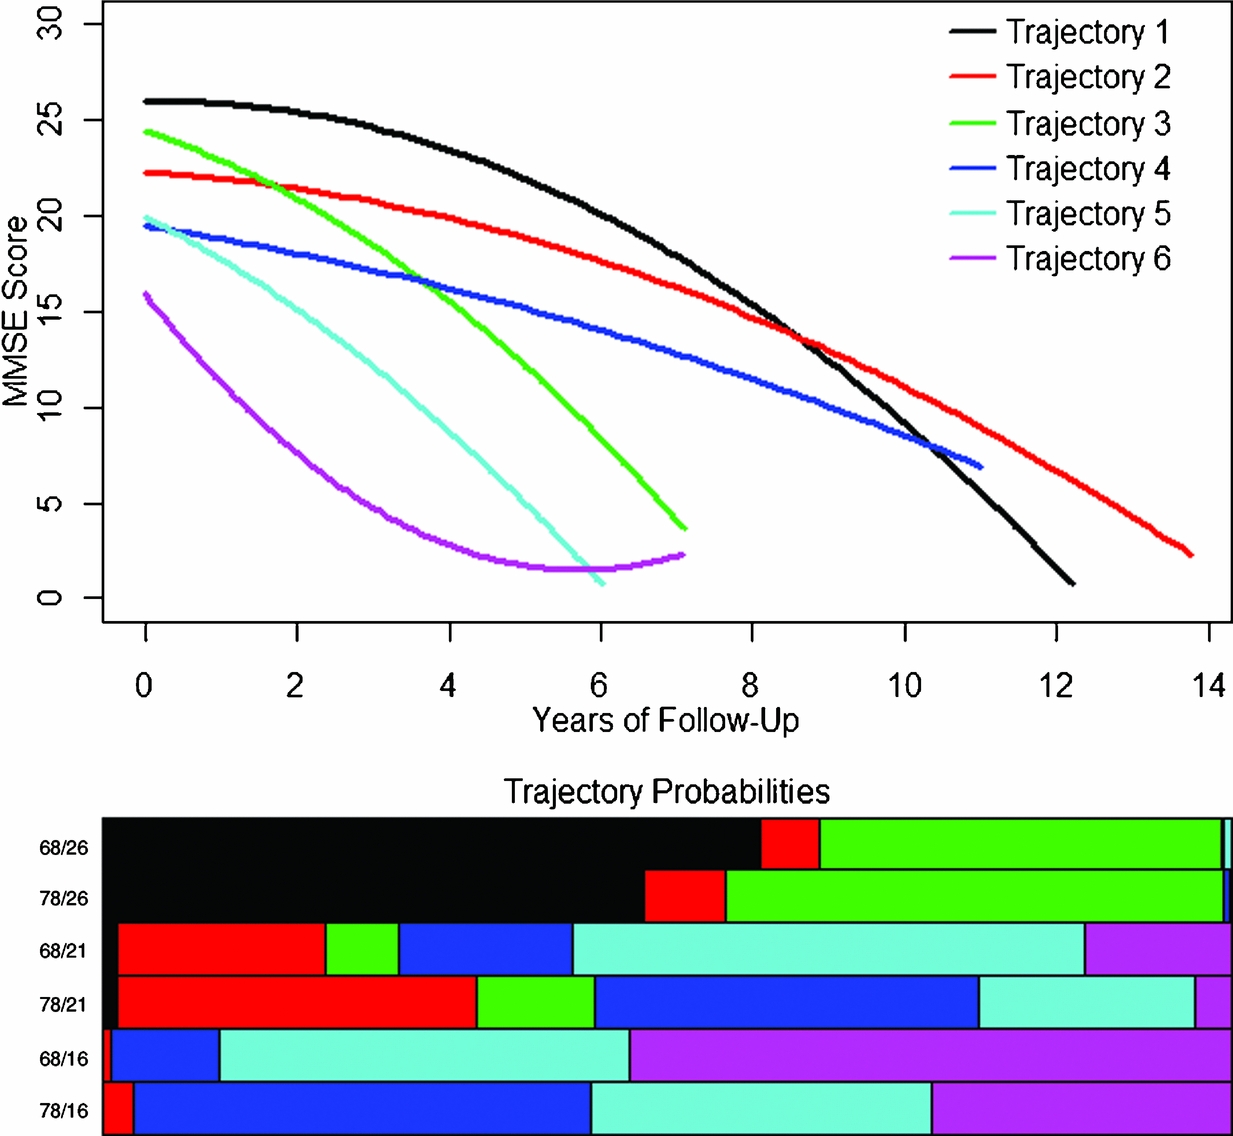
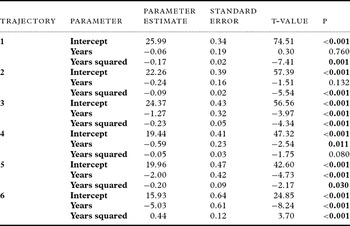
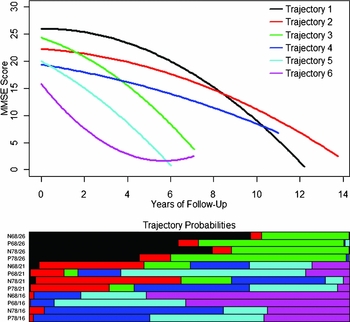
Latent class models were fit using linear, quadratic, and cubic curves over time, with a range of 1 to 8 latent classes, and with no concomitant variables up to first order interactions of age, gender, education, APOE ϵ4 status, and excluding and including psychosis status. BIC was used to choose the best models. A quadratic trajectory term was justified, but a cubic term did not improve the BIC. The best model had six trajectories (latent classes or “groups”; see Figure 1). Although visual inspection of Figure 1 might suggest that the three poorer and the three better trajectories could be combined to simplify the model to only two trajectories, we found the six-group model (BIC = 5510) to be strongly favored over the two-group model (BIC = 5986). The parameters of the six trajectories for the best-fitting model excluding psychosis status are shown in Table 3.
Cognitive trajectories of AD subjects and representative concomitant distributions of the trajectories for ages 68 and 78 years and initial MMSE scores of 16, 21 and 26. In the top panel, the vertical axis represents MMSE scores; the horizontal axis represents years of follow-up. In the bottom panel the lengths of the bars represent the probabilities of a subject with a particular combination of concomitant variable values falling along the correspondingly colored trajectory. The horizontal extent of each bar represents 100%.
Parameters of latent cognitive trajectories of AD subjects

The concomitant variables included in the best latent class trajectory model are initial MMSE and age. Because the interpretation of concomitant variable parameters is difficult, we present the effects of initial MMSE and age on the probabilities of subjects falling into the different trajectories graphically. Figure 1, at top, shows the individual cognitive trajectories for the latent class model with the best fit to the data, the six-group quadratic trajectory model with initial MMSE and age as concomitant variables. When gender, education and apolipoprotein E genotype were included in the model, there was no improvement in the BIC. Each row of the bar graph in the lower half of the figure shows the probability distribution across trajectories for some specific values of the concomitant variables. The colors in the bar graphs refer to the correspondingly colored trajectories. For example, the top line of the bar graph represents 68-year-old subjects with an initial MMSE of 26. We can read the approximate probabilities of falling into trajectories 1, 2 and 4 as 50%, 20% and 30% respectively, with almost no chance of falling along any of the other trajectories.
Because latent class analysis models each subject's trajectory as a mixture of all trajectories, it is worth examining how often subjects fit predominantly into one particular trajectory vs. a mixture of two or more. For our models, 66% of subjects had at least 95% of their probability focused on a single trajectory, and 89% of subjects had at least 95% of their probabilities focused on just two trajectories. Of the remaining 22 subjects, the majority (63.6%) had a sum of at least 90% for the top two probabilities. This suggests that six trajectories well represent the patterns of MMSE change for the majority of our subjects.
Trajectory modeling of cognitive and behavioral course
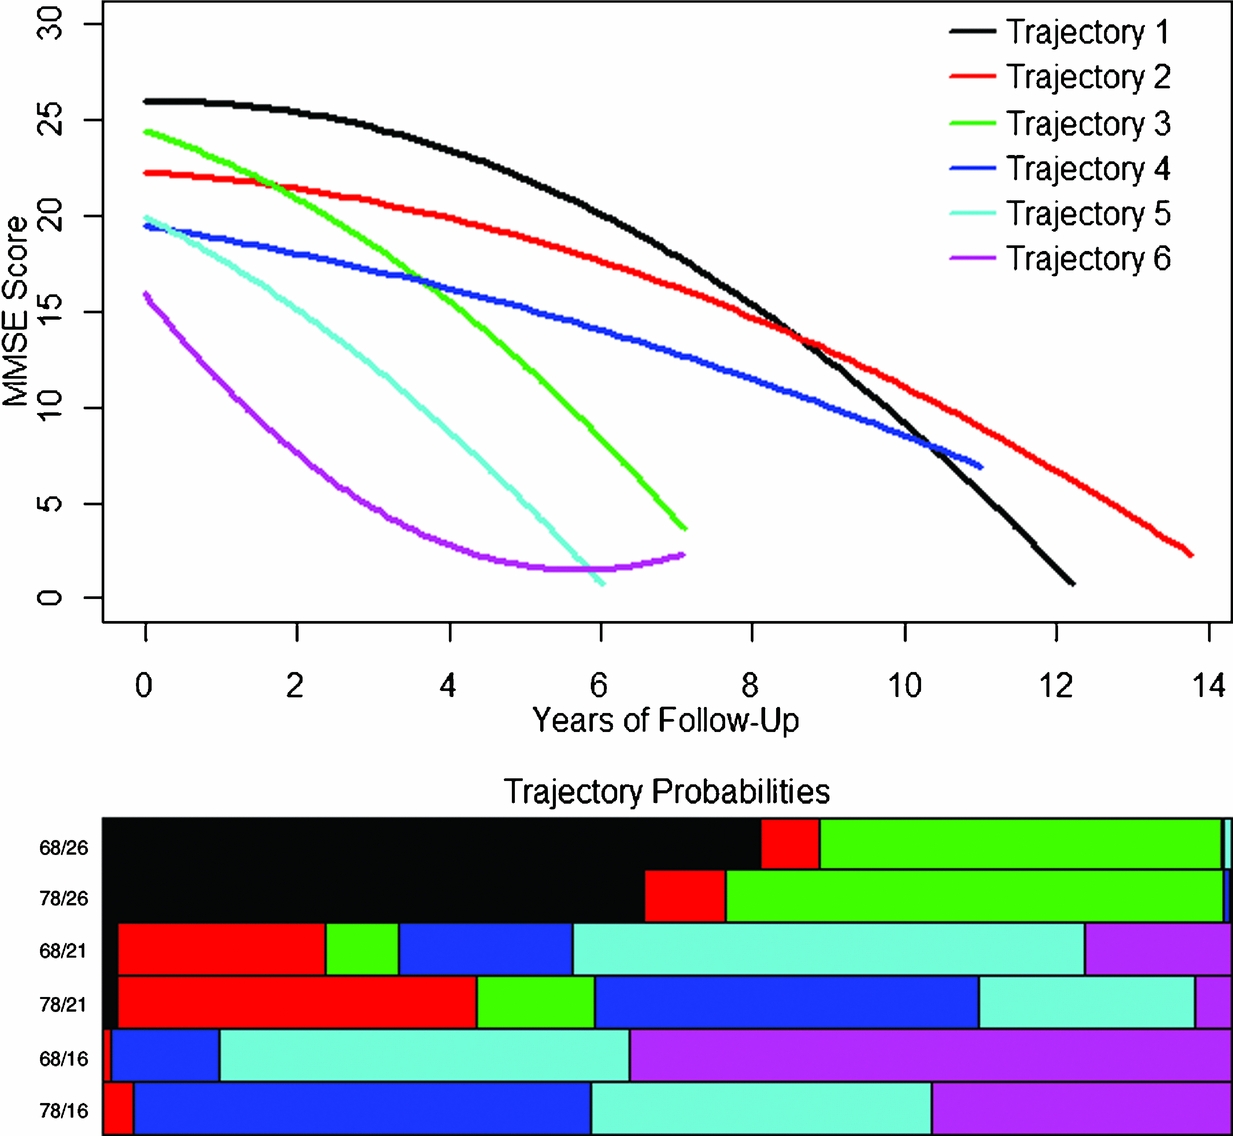
Figure 2 shows cognitive trajectories of AD subjects with psychosis modeled as a covariate. This model showed the same BIC as the above model, but some of the concomitant parameters were statistically significant. The bottom panel of Figure 2 shows the probabilities of each subject belonging to a particular trajectory, as a function of initial MMSE score, age and psychosis burden. These results demonstrate that AD subjects of all ages and initial MMSE score who develop psychosis had an increased likelihood of following a more rapidly declining MMSE curve (trajectories 3, 5 and 6). Younger subjects who developed psychosis and presented with low MMSE score were more likely to bein the groups with most rapidly declining MMSE (groups 5 and 6).
Cognitive and behavioral trajectories of AD subjects. In the top panel, the vertical axis represents MMSE scores; the horizontal axis represents years of follow-up. The bottom panel is a graphical representation of the probabilities of belonging to a particular trajectory for subjects with particular combinations of initial MMSE, sex and psychosis status. P = Psychotic; N = not Psychotic; 26/21/16 = initial MMSE, 68/78 = age.

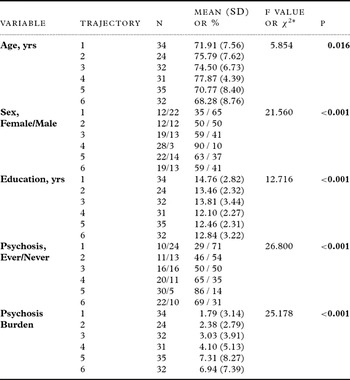
Using a probability cutoff of 0.65, we classified approximately 92% (186 subjects classified out of 201) of the subjects. Table 4 shows the covariate distribution per trajectory group. The range in group size was 24–35, with approximately equal numbers in each group. The youngest subjects (60–70 years) are more likely to be in group 6, and show the most rapid cognitive decline. Males predominate over females only in trajectory 1. Subjects in trajectories 1 through 3 had the most education. The fraction of subjects who develop psychosis varied from 29% in group 1 to 86% in group 5. A similar trend of psychotic subjects showing more rapid cognitive decline is also seen with psychosis burden, with a mean psychosis score of 1.79 in group 1 to 731 in group 5.
Clinical distributions per trajectory group

*Wald χ2 with 5 df
Discussion
These models from a longitudinal cohort of AD subjects show six trajectories with significantly different courses and rates of cognitive decline. These trajectories were best defined by subject age and MMSE at the initial assessment. In general, subjects with older age followed a trajectory with slower cognitive decline. Subjects with higher initial MMSE scores tended to follow trajectories of slower decline, while those with lower initial scores tended to decline more rapidly. On the other hand, the latent trajectory modeling makes clear that a substantial minority of subjects with high initial MMSE score follow a poorer trajectory (trajectory 3), while a substantial minority of those with low initial scores do not decline rapidly (trajectory 4). Within each age and initial MMSE group, subjects with psychosis follow a course of more rapid decline.
Importantly, the latent class trajectory model demonstrates heterogeneity of individuals more effectively than mixed models. One of the key features of latent class trajectory models is that, in addition to identification of the latent trajectories, they also allow modeling of so-called concomitant variables. Concomitant variables are categorical or quantitative subject characteristics which help to characterize the probabilities of falling into the various latent trajectories. Technically, a concomitant model is based on the multinomial logit model (Gruen and Leisch, Reference Tyas2008). This is a major distinguishing feature between latent class trajectory models and mixed trajectory models. Mixed trajectory models assume that the individual trajectories for all subjects with a given set of measured explanatory variables follow a normal distribution around a mean curve, with the individual variation due to continuous unmeasured explanatory variables. Latent class trajectory models allow for distinct groups, presumably representing unmeasured discrete explanatory variables (with unmeasured continuous variables accounted for by a random intercept). Each group of subjects with a given set of measured explanatory variables may fall across several trajectories, but the distribution is modeled with the concomitant variables and need not fall symmetrically around a single curve as in the mixed model.
Importantly, the apparent heterogeneity of cognitive trajectory in these AD subjects is consistent with the current understanding of the heterogeneous nature of underlying neuropathology within individuals receiving a diagnosis of AD. Individuals diagnosed clinically and neuropathologically with AD can still vary substantially in the degree of AD-related pathology, i.e. accumulation of β-amyloid and hyperphosphorylated microtubule-associated protein tau, which is present on neuropathological examination. Moreover, individuals diagnosed clinically with AD express comorbid neuropathologies such as Lewy bodies and vascular pathology at high rates. Each of these pathologies may contribute independently to cognitive impairments (Berg et al., Reference Berg1998).
We found no correlation of the APOE ϵ4 allele with any trajectory; this is similar to other studies (Rasmusson et al., Reference Rasmusson, Carson, Brookmeyer, Kawas and Brandt1996; Barnes et al., Reference Barnes, Wilson, Schneider, Bienias, Evans and Bennett2003), though reports of the association of APOE with cognitive decline in the literature vary. Several studies report a positive association of APOE ϵ4 with more rapid cognitive decline (Corder et al., Reference Corder1993; Craft et al., Reference Craft1998; Martins et al., Reference Martins, Oulhaj, de Jager and Williams2005; O'Hara et al., Reference O'Hara, Sommer, Way, Kraemer, Taylor and Murphy2008). Conversely, in an individual growth curve analysis of APOE ϵ4-associated cognitive decline in AD, Hoyt et al. (Reference Hoyt, Massman, Schatschneider, Cooke and Doody2005) report that although the APOE ϵ4 allele is associated with an increased risk of developing AD, subjects with two ϵ4 alleles have a slower clinical course. Kleiman et al. (Reference Kleiman2006) also report that although APOE ϵ4 increased the risk for AD and decreased the age of disease onset in population studies, it did not significantly influence the rate of disease progression in cognitive or functional domains. Since our cohort included only those subjects previously diagnosed with AD, we did not analyze an association of APOE ϵ4 with incident AD; however, as with most prior studies, we also found that as the number of APOE ϵ4 alleles increased, the age at presentation decreased. One proposed solution to these discrepancies emerges from observations in a longitudinal study analyzing the role of APOE ϵ4 in cognitive decline in an elderly population free of dementia at baseline (Bretsky et al., Reference Bretsky, Guralnik, Launer, Albert and Seeman2003). The authors reported that APOE ϵ4 was associated with cognitive decline in their population that was most pronounced after seven years of follow-up. They proposed that the ϵ4 allele may either function as a risk factor for cognitive impairment in normal aging, or has effects early in a long prodromal AD trajectory. Further studies in which cognitive trajectories are modeled in subjects with normal cognition who are followed to AD onset are needed to clarify this ambiguity.
Of the clinical variables studied, the one most strongly related to a trajectory of rapid cognitive decline was greater burden of psychotic symptoms. An association of psychosis with faster cognitive decline has been reported in numerous studies. . In fact, greater cognitive impairment and more rapid cognitive decline is the most consistent correlate of psychosis in AD (Ropacki and Jeste, Reference Ropacki and Jeste2005). To our knowledge, this is the first report to identify trajectories of cognitive decline in AD defined by psychosis burden. Regardless of age and initial MMSE, subjects with psychosis follow trajectories with faster cognitive decline. Because psychosis in AD demonstrates familial aggregation and significant heritability (Hollingworth et al., Reference Hollingworth2007; Bacanu et al., Reference Bacanu, Devlin, Chowdari, DeKosky, Nimgaonkar and Sweet2005), our current findings suggest the hypothesis that the more rapid cognitive trajectories associated with cognitive decline may reflect, in part, the contribution of genetic variations.
The statistical analyses used in this report offer advantages over others. Some prior reports have computed rates of change over short follow-up intervals or over intermittent time intervals, often assuming a linear decline. In the current study, evaluations were performed annually for up to 165 months. Our mixed effects model with latent groups evaluated the variables with a continuous outcome measure of MMSE over time, thus eliminating the need for calculating an estimate of the rate of decline. There is evidence that the rate of cognitive decline may vary at different times in the course of illness, and we confirmed the importance of using a quadratic term in modeling cognitive change over time. Including a quadratic (or higher) term in a trajectory is a standard statistical technique for modeling trajectories that are curvilinear. It is the combination of the terms that describes the shape of the trajectory. If a higher order term is not statistically significant, then only the simpler model is justified (or power is insufficient). If a lower order term is not statistically significant, it is misleading to conclude that there is no linear component to the trajectory; rather, the combined equation is the best estimate of the, say, quadratic trajectory. For our best model all but one trajectory (4) show a significant quadratic term (and cubic terms were not significant). We conclude that linear modeling of MMSE trajectories is inadequate, although trajectory 4 may be adequately modeled as a linear decline. Despite the fact that the linear terms in trajectories 1 and 2 are not statistically significant, they do show a curvilinear decline.
Our latent class analysis shows clearly that in all but the lowest ranges of baseline MMSE scores, some subjects deteriorate slowly and others more quickly. The quadratic curve appears to be a reasonable approximation to actual subject curves in these data. However, quadratic fits would potentially be less appropriate in datasets with cognitively normal subjects followed to disease onset and death, where subjects may show initial or final areas of little or no change or show more sudden late changes reflecting terminal decline. Of course, there are many events during the course of a long illness, such as delirium, medication toxicity, cerebrovascular insult, or traumatic brain injury that cannot be accurately assayed by any statistical model, further emphasizing the need for careful longitudinal symptom history.
Several other limitations to the current study exist and deserve comment. The subjects were enrolled at the Alzheimer Disease Research Center and may not be representative of the general population of elderly subjects with AD. Despite our long follow-up period, some subjects who eventually became psychotic later in the course of their illness may have been missed. Our analyses were also restricted to Caucasian subjects, and may not generalize to subjects with differing socioeconomic or ethnic backgrounds. Methodologically, we used a global measure of cognitive function, the MMSE, as our outcome measure, and different trajectories may have appeared using specific domains of cognitive function.
In conclusion, the present study used a thoughtful statistical approach to determine trajectories of cognitive decline in a large group of phenotypically well-defined AD subjects. We identified age, initial MMSE, and psychotic symptoms as defining specific courses of cognitive decline, and we provided evidence that trajectory modeling of longitudinal cognitive and behavioral data can resolve phenotypic variation. Future studies using other statistical models and a larger cohort of subjects with cognitive status ranging from normal through AD will continue to improve our resolution of phenotypes with distinct trajectories. To the extent that specific trajectories reflect the contributions of distinct underlying pathologic processes and/or genetic variations, our approach may enhance the power to detect the association of these neurobiologic mechanisms with cognitive decline and psychosis risk.
Conflict of interest
None.
Description of authors’ roles
Dr. Wilkosz was the primary author of this paper. Dr. Seltman contributed to the design of the study, conducted the statistical analysis of the data and assisted in writing the paper. Dr. Devlin contributed to the design and analysis of the study. Dr. Wilkosz, Dr. Lopez, Dr. DeKosky, Dr. Sweet, and Ms. Weamer contributed to the recruitment and diagnoses of patients, and to the data collection at the Alzheimer Disease Research Clinic. Dr. Sweet contributed to the study design and writing of the paper. In addition, all authors reviewed drafts of the paper prior to publication.
Acknowledgments
This study was supported in part by research grants AG027224 and AG005133 from the National Institute of Aging. The authors wish to thank Mr. James Emanuel for formatting the manuscript and the staff of the Alzheimer Disease Research and Clinic at the University of Pittsburgh. We also wish to thank the two anonymous reviewers for many helpful suggestions.