Introduction
A healthy pregnancy is essential for proper fetal development. Complications, such as intrauterine growth restriction (IUGR) and maternal stress during pregnancy [prenatal stress (PS)], can have acute effects on the fetus as well as on-going vulnerability of disorders after birth. IUGR is seen in up to 10% of pregnancies worldwide, and children that fail to reach their in utero growth potential are at an increased risk of mortality and morbidities ranging from mild behavioural deficits to physical and neurological impairments.Reference Bernstein, Horbar, Badger, Ohlsson and Golan 1 – Reference Jacobsson, Francis, Hagberg, Hagberg and Gardosi 3 Infants born from growth-restricted pregnancies are likely to be small for gestational age, and can either have symmetrical growth restriction, whereby all physical and visceral growth is reduced equally, or fetuses may grow asymmetrically. Asymmetrical growth restriction is due to a redirection of blood flow resulting in at least a partial maintenance of normal brain growth and size, but reduced lower limb size, abdominal circumference and visceral organ growth.Reference Campbell and Thoms 4 The most common cause of IUGR is placental insufficiency, leading to inadequate placental supply of nutrients to the fetus impeding growth.
Epidemiological studies have shown that being growth restricted is associated with poorer social skills, behavioural development, for example withdrawn behaviours, memory and learning difficulties and a greater risk of developing attention deficit hyperactivity disorder (ADHD) throughout infancy, childhood and adolescence.Reference Leitner, Fattal-Valevski and Geva 5 – Reference Savchev, Sanz-Cortes and Cruz-Martinez 9 Reported evidence also shows males are more likely to have negative neurobehavioural and cognitive deficits when affected by poor intrauterine growth than females.Reference Paz, Gale and Laor 10 , Reference Paz, Laor and Gale 11 In a rabbit model of IUGR, Eixarch and co-workers found poor behavioural outcomes of 1 day old neonates correlated with changes in regional fractional anisotropy of various brain areas compared with control animals, including the hippocampus, using magnetic resonance imaging (MRI).Reference Eixarch, Batalle and Illa 12 Guinea pig models investigating the effects of IUGR in fetal brains have reported reductions in hippocampal neuron numbers, reduced and/or delayed myelination, hippocampal volume and increased ventricular volumes compared with control, appropriately grown neonates.Reference Mallard, Loeliger, Copolov and Rees 13 – Reference Kelleher, Palliser, Walker and Hirst 15 Reductions in myelin and decreased brain volume are suggested to translate long term into behavioural deficits such as ADHD and learning disabilities.Reference Castellanos, Lee and Sharp 16 , Reference Hamilton, Levitt and O’Neill 17 Studies have also reported astrogliosis as another injurious process occurring in growth-restricted brains,Reference Olivier, Baud and Bouslama 18 , Reference Olivier, Baud, Evrard, Gressens and Verney 19 indicating neural inflammation and damage. However, the upregulation of astrocyte markers are inconsistent in the literature with one study reporting no upregulation of the activated astrocyte marker, glial fibrillary acidic protein (GFAP) within IUGR fetal guinea pig brains.Reference Nitsos and Rees 14 In contrast, another study reported an increase in GFAP expression.Reference Kelleher, Palliser, Walker and Hirst 15 These differences, however, may be due to variability in the severity of placental insufficiency within the animal models.Reference Olivier, Baud and Bouslama 18
Stress is a natural physiological response to internal and external events, predominantly characterised by the release of glucocorticoids such as cortisol. During human pregnancy, cortisol gradually increases until a large cortisol surge in late gestation, predominantly of maternal origin. The fetal brain uses this steroid in the maturation of neuronal processes.Reference Trejo, Cuchillo, Machín and Rúa 20 , Reference Matthews 21 However, evidence indicates that premature exposure to high levels of glucocorticoids negatively impacts these neurodevelopmental processes.Reference Kraszpulski, Dickerson and Salm 22 – Reference Martínez-Téllez, Hernández-Torres, Gamboa and Flores 24 Recent work by Bennett et al. Reference Bennett, Palliser, Saxby, Walker and Hirst 25 examining effects of PS have demonstrated that male guinea pig fetuses have reduced hippocampal myelin, astrocyte and neuron markers, whilst females only showed reduction in neuron markers. This suggests that females have mechanisms that tend to protect their glia from the degenerative effects of corticosteroids in utero compared with males. Further studies using this guinea pig model further showed that PS exposed animals had reductions in myelination and astrocytosis within the hippocampus at adolescent equivalence, irrespective of sex.Reference Bennett, Palliser, Shaw, Walker and Hirst 26 Thus, male neurodevelopment does not catch up postnatally, and female offspring do not maintain this protection of glial cells, highlighting that these brains remain vulnerable to post in utero insults. Importantly, these PS exposed offspring also displayed increased anxiety-like responses during behavioural testing, irrespective of sex.Reference Bennett, Palliser, Shaw, Walker and Hirst 26 Consistent with these observations in animal models, human PS studies by Laplante and King have shown that children from PS exposed pregnancies had impairments in cognition, language ability and neurobehavioural outcomes,Reference Laplante, Barr and Brunet 27 , Reference Laplante, Zelazo, Brunet and King 28 with males more at risk of adverse outcomes than females.Reference Dancause, Laplante and Oremus 29 Extensive other studies have found consistently similar results of PS on poor childhood development.Reference Beversdorf, Manning and Hillier 30 – Reference Brouwers, van Baar and Pop 33 The timing of prenatal stress exposure is suggested to impact the outcome for the offspring. Stress during the first trimester has been shown to be associated with an increased risk of developing mood disorders and autism spectrum disorders,Reference Kleinhaus, Harlap and Perrin 34 , Reference Walder, Laplante and Sousa-Pires 35 whilst during the second trimester it is associated with an increased risk of developing ADHD.Reference Zhu, Hao and Tao 36 A study by van Os and SeltenReference van Os and Selten 37 suggested that maternal stress during the first trimester increased the risk of developing schizophrenia in both males and females, whilst during the second and third trimesters males were at a greater risk than females. Both early and late prenatal stress produces emotional deficits in rhesus monkeys irrespective of sex.Reference Coe, Kramer and Czéh 38 Whilst in guinea pig models, Kapoor et al. Reference Kapoor and Matthews 39 found that mid-gestation stress resulted in anxiogenic behaviour in male guinea pigs, but female offspring were more anxious when exposed to stress during late gestation.Reference Kapoor and Matthews 40 Irrespective of timing, these data highlight that stress occurring at any point during gestation has chronic detrimental effects on the offspring, which can impact their quality of life well into adulthood.
The brain possesses innate mechanisms to prevent neural loss following insults, with neurosteroids forming a major group of protective hormones. During pregnancy, the markedly increased amounts of progesterone from the placenta acts as a precursor that is metabolised to the key neurosteroid, allopregnanolone.Reference Gilbert Evans, Ross, Sellers, Purdy and Romach 41 Allopregnanolone is critical in neurodevelopment as it promotes processes such as myelination by oligodendrocytes,Reference Ghoumari, Ibanez and El-Etr 42 prevents apoptosis,Reference Xilouri and Papazafiri 43 , Reference Yawno, Yan, Walker and Hirst 44 and provides neuroprotection through enhancing actions of γ-aminobutyric acid (GABA).Reference Belelli and Lambert 45 Acute periods of stress increase local levels of allopregnanolone, concurrently with cortisol concentrations, in fetal sheep brains,Reference Nguyen, Yan, Castillo-Melendez, Walker and Hirst 46 as well as in adult rat brains.Reference Barbaccia, Roscetti and Trabucchi 47 This is proposed as a protective mechanism to protect cells from the deleterious effects of cortisol, as well as restoring GABAergic tone following acute stress.Reference Barbaccia, Roscetti and Trabucchi 47 However, our previous studies have shown a reduction in circulating allopregnanolone levels in guinea pig fetuses and adolescent offspring following repeated prenatal stress suggesting chronic stress inhibits this upregulation of allopregnanolone levels.Reference Bennett, Palliser, Walker and Hirst 48 In a sheep model of placental insufficiency, fetal brain allopregnanolone concentrations are maintained by the upregulation of 5α-reductase type 2 (5αR2) protein in numerous brain regions including the hippocampus with a concurrent increase in circulating allopregnanolone,Reference Nguyen, Billiards, Walker and Hirst 49 supporting its role as a neuroprotective agent. Much like allopregnanolone, the GABA synthesis enzyme glutamic acid decarboxylase isoform 67 (GAD67), is upregulated during periods of acute stress,Reference Bowers, Cullinan and Herman 50 and downregulated following chronic stress.Reference Gilabert-Juan, Castillo-Gomez, Pérez-Rando, Moltó and Nacher 51 Reductions in this enzyme have also been found in the brains of patients with depression and autism,Reference Varea, Guirado and Gilabert-Juan 52 , Reference Yip, Soghomonian and Blatt 53 both of which are more likely to occur in individuals born following growth restriction and prenatal stress. However, little information exists on this enzyme’s expression patterns in the fetuses following these insults.
Our recent studies have shown that prenatal stress has negative impact on fetal neurodevelopment, particularly among males, however, there is little information on the combined neurodevelopmental effects of IUGR and PS. Individually, both conditions can be detrimental to fetal neurodevelopment and the increased risk of cognitive and psychological disorders, therefore it seems important and relevant to investigate the combined neurodevelopmental effects of these two complications. Our hypothesis was that IUGR in combination with PS in a guinea pig model will have a cumulative effect on allopregnanolone concentrations and the development of vulnerable brain regions in the limbic system of the fetus; and that males will have a heightened vulnerability to potentiation by these two stressors with greater deficits compared with females. We aimed to determine the effects of these compromises on placental and plasma allopregnanolone concentrations. We also aimed to investigate the effects of these compromises on myelination, mature neurons, GABA synthetic enzyme expression and levels of activated astrocytes.
Methods
Animals and intrauterine growth restriction surgery
Time-mated, outbred guinea pigs were acquired from the University of Newcastle Research Support Unit. Guinea pigs were randomly allocated to either control (n=9) or growth restriction (IUGR; n=16) surgery, performed at gestational age (GA) 32.05±0.25. Surgeries, performed under aseptic conditions, were adapted from previously published methods.Reference Herrera, Alegría and Farias 54 Briefly, buprenorphine (temgesic, buprenorphine hydrochloride, 0.05 mg/kg) used for analgesia and atropine sulphate (0.05 mg/kg), to reduce salivary secretions, were given 30 min before anaesthesia induction. Anaesthesia was induced using 2–4% isoflurane by vaporisation in medical grade oxygen (Coregas, Mayfield West, NSW, Australia) before a midline incision was made as previously described.Reference Kelleher, Palliser, Walker and Hirst 15 , Reference McKendry, Palliser, Yates, Walker and Hirst 55 The uterine arteries at both ovarian and cervical ends of the uterine horns were located and fat was carefully dissected away. To induce growth restriction, sterilised medical grade silicon tubing (Gecko Optical, Perth, WA, Australia; 4 mm length, tube wall thickness 1 mm, one side cut lengthways providing an opening) was placed around the artery at both the cervical (internal diameter 1.5 mm) and ovarian (internal diameter 1.5–2 mm) ends of the arteries. The internal diameter size was selected such that the tubing should not restrict blood flow at time of placement and could be moved freely along the artery initially. This procedure was performed on both horns of the uterus. Tubing was secured in place using sterile suture tied around the external wall to prevent slippage. Pregnant guinea pigs allocated to the control protocol had their uterine arteries manipulated in the same manner, however did not have tubing placed around the arteries. The uterus was returned to its original position before the incision was sutured closed and dam allowed to recover. When not undergoing an experimental protocol, all guinea pigs were housed in individual cages within visual and vocal distance of each other, under a 12 h light/dark cycle. A diet of commercial guinea pig pellets, fresh hay and water fortified with ascorbic acid was available ad libitum.
Prenatal stress induction
IUGR dams were further allocated to either control (n=6) or stress (IUGR+PS; n=10) protocols. The stress protocol commenced on GA40 and was repeated on GA45, 50, 55, 60 and 65. The timing if first stress induction is equivalent to ~20–24 weeks of gestation in the human,Reference Bayer, Altman, Russo and Zhang 56 , Reference Tau and Peterson 57 and coincides with many neurodevelopmental processes including myelination and hippocampal formation in the guinea pig.Reference Mallard, Loeliger, Copolov and Rees 13 , Reference Dobbing and Sands 58 Stress was induced using previously published protocols.Reference Bennett, Palliser, Saxby, Walker and Hirst 25 , Reference Bennett, Palliser, Shaw, Walker and Hirst 26 , Reference Kapoor and Matthews 39 , Reference Kapoor and Matthews 40 Briefly guinea pigs remained in their home cages with food and water provided ad libitum, with the home cage being placed inside a ventilated, light-proof box with a strobe light for two hours. Control and non-stressed IUGR animals remained in their home cages in normal holding facilities and were not exposed to the strobe light. All guinea pigs had saliva collected via cotton tips immediately prior and post stress/control timings.Reference Bennett, Palliser, Saxby, Walker and Hirst 25 , Reference Bennett, Palliser, Shaw, Walker and Hirst 26 , Reference Bennett, Palliser, Walker and Hirst 48
Determination of steroid concentrations
Cortisol in fetal plasma was assessed by immunoassay by Pathology North (Newcastle, Australia). The assays were conducted on the UniCel Dxl800 Access Immunoassay System (Beckman Coulter Inc., Gladesville, NSW, Australia), as per manufacturer’s instructions. The intra-assay coefficient of variance was 4.3%. Cortisol concentrations in maternal saliva was assessed using a salivary cortisol enzyme-linked immunosorbent assay (ELISA; Salimetrics Inc., State College, PA, USA), as per manufacturer’s instructions. The sensitivity of the assay was 0.012–3 μg/dl, with intra- and inter-assay coefficient of variance were 5.52 and 6.89%, respectively.
Plasma, brain and placental allopregnanolone concentrations were determined using radioimmunassay as previously published.Reference Kelleher, Palliser, Walker and Hirst 15 , Reference Kelleher, Hirst and Palliser 60 Plasma and tissue were treated with 1% acetic acid and 50% methanol and homogenised before being added to Sep-Pak18 cartridges. Samples were washed with graded methanol before oxidation using 5% potassium permanganate to remove progesterone and so to decrease the cross-reactivity of progesterone in samples, before re-extraction with 50%v/v diethyl-ether/n-hexane. Concentrations of allopregnanolone were quantified using polyclonal antibody to allopregnanolone (Agrisera; Sapphire Bioscience, Vannas, Sweden). Tritium-labelled allopregnanolone tracer (5α-[9, 11, 12, 3H(N)]; PerkinElmer Life and Analytical Sciences, Boston, MA, USA) was used to determine sample recovery concentrations. Average recovery of allopregnanolone was 74.3±1.5% for plasma and 55.4±0.70% for tissue, with individual recovery values used to account for extraction loss and determine final allopregnanolone concentrations. Radioactivity was measured using a β-counter (LS65000; Beckman Coulter Australia Pty Ltd., Sydney, NSW, Australia). Limit of detection was 25 pg/ml, with inter- and intra-assay coefficients were 9.39 and 2.75%, respectively.
Fetal physical measurements
The three fetal study groups used in this study were control (n=11: females n=5, males n=6), IUGR (n=12: females n=6, males n=6) and IUGR+PS (n=12: females n=6, males n=6) fetuses, defined before commencement of protocols. Fetal tissue collection occurred at GA69 (term ~71 days), or on determination that the pubic symphysis had begun separation and had reached >2 cm for 2 consecutive days to ensure collection of tissue before onset of labour).Reference Dyson, Palliser, Kelleher, Hirst and Wright 59 , Reference Kelleher, Hirst and Palliser 60 All fetuses were sexed, with physical measurements collected including body, organ, peripheral [brown adipose tissue (BAT) of neck and back] and visceral (kidney BAT) fat weights. Plasma and brain were collected as previously described.Reference McKendry, Palliser, Yates, Walker and Hirst 55 , Reference Shaw, Palliser, Dyson, Hirst and Berry 61 Briefly, blood was collected via cardiac puncture, and centrifuged at 4°C for 10 min to separate red blood cells and plasma. Brains were dissected from the skull, and hemisected with the left hemisphere cut into three regions (one containing frontal cortex, the second region containing the hippocampus and amygdala, and the cerebellum making up the third region). The remaining hemisphere was dissected to yield hippocampus and cerebellar tissue which was weighed to determine physical changes. Due to ethical constraints on animal numbers allowed for this study, multiple fetuses per pregnancy were used. Some naturally occurring growth-restricted fetuses from sham mothers were included in this study, with appropriately grown siblings used as controls to allow for greater use of animals. Fetal placement within the uterus did not differ between naturally occurring and surgically induced growth-restricted fetuses. Fetuses less than the 25th percentile for weightReference Thompson, Gros, Richardson, Piorkowska and Regnault 62 – Reference Thompson, Sarr, Piorkowska, Gros and Regnault 64 (below 75 g within our colony, unpublished data) and/or a brain-to-liver ratio (BLR) of greater than 0.9Reference Kelleher, Palliser, Walker and Hirst 15 (indicating asymmetrical growth) were classified as growth restricted. No animals with weight >75 g had a BLR >0.9.
Brain immunohistochemistry
Fixed, paraffin-embedded brains (control n=10: females n=5, males n=5; IUGR n=10: females n=5, males n=5; IUGR+PS n=10, females n=5, males n=5) were sectioned at a thickness of 8 μm, in serials of 3 using a Leica RM2145 microtome (Leica Biosystems, Mt Waverly, VIC, Australia), and immunostained for myelin basic protein (MBP) as a marker of mature myelination, microtubule-associated protein 2 (MAP2) as a marker of mature neuronal processes, glial fibrillary protein (GFAP) as a marker of astrocyte activation and glutamate decarboxylase 67 (GAD67), a stain for GABA-producing cells as previously described.Reference Shaw, Palliser, Dyson, Hirst and Berry 61 Briefly, slides were dewaxed in a series of xylene and ethanol washes, and antigen retrieval performed using 10 mM Citrate buffer, pH 6.0. Endogenous peroxidase activity was blocked for 20 min using 3% hydrogen peroxide in 0.1 M phosphate buffered saline. Slides were then incubated in blocking buffer (2% normal goat serum, 0.4% BSA, 0.3% Triton X-100), at room temperature for 1 h, before primary antibody incubation using rat anti-MBP (1:1000, M9434; Sigma Aldrich, Castle Hill, NSW, Australia), mouse anti-MAP2 (1:20,000, M9942; Sigma); mouse anti-GFAP (1:1000, G3893; Sigma); and mouse anti-GAD67 (1:1000, ab26116; Abcam, Cambridge, UK) overnight at room temperature. Secondary antibody incubation for MAP2, GFAP and GAD67 was anti-mouse (1:300, B6649; Sigma) and anti-rat (1:300, B7139; Sigma), respectively, for 1 h at room temperature. Tertiary antibody, Streptavidin-horseradish peroxidase (1:400, ab7403; Abcam) was incubated on sections for 1 h at room temperature. Slides were stained in chromagen 3,3'-diaminobenzidine tetrahydrochloride solution (DAB, Pierce; ThermoFisher Scientific, Scoresby, Australia). One section was stained with cresyl violet for morphological analysis. A negative control slide was run concurrently with each antibody. Slides were then mounted using DEPX (Merck, Kilsyth, VIC, Australia) and imaged using Leica Aperio AT2 imager (Leica Biosystems). Regions of interest were captured using Imagescope software (v12.1.0.5029; Leica Biosystems) at 20× magnification. MBP and GFAP immunostaining were examined in the CA1 and adjacent subcortical white matter (SCWM), MAP2 and GAD67 were imaged in the CA1 alone. These regions of the hippocampus were chosen as they are commonly impacted by pregnancy compromises.Reference Kelleher, Palliser, Walker and Hirst 15 , Reference Bennett, Palliser, Saxby, Walker and Hirst 25 , Reference McKendry, Palliser, Yates, Walker and Hirst 55 , Reference Shaw, Palliser, Walker and Hirst 65 Within the amygdala, GFAP, MAP2 and GAD67 were imaged in the basolateral amygdala (BLA) and the central nucleus of the amygdala (CeA). These two regions of the amygdala were chosen due to their importance in the development of emotional and behavioural disorders.Reference Etkin and Wager 66 – Reference Walf, Sumida and Frye 68 The immunoreactivities of MBP, GFAP and MAP2 were analysed by densitometry using ImageJ 1.40 (National Institutes of Health, Bethesda, MD, USA). Images were made binary by converting to greyscale and adjusting the threshold manually to cover the immunostained area, and removing background non-specific staining. GFAP, MBP and MAP2 were expressed as %area of coverage recorded for four fields of view per region on two sections per animal. GAD67 cell counts were collected using ImageJ, using four fields of view for each region and two sections per animal. The researchers that performed the analysis were blinded to animal group allocations until the completion of data analysis.
Statistical analysis
Maternal salivary cortisol was analysed by repeated measures ANOVA for pre- and post events; across all gestational time points. Maternal pregnancy characteristics were analysed by one-way ANOVA. For assessment of fetal measures, a generalised estimating equation was used to compare prenatal group (control, IUGR or IUGR+PS) and sex of the fetus (male or female). Where a significant effect of both group and sex were identified, an interaction term (prenatal group×sex) was included in the analysis. Statistical significance was determined using the Wald-Chi squared type III test, and post-hoc pairwise comparisons to identify between group differences with an α of P<0.05 to identify an effect. In-text data for pairwise comparisons are reported as the estimated differences between the mean differences (MD); 95% Wald confidence intervals (CIs); and P-values. Unless specified, all data in tables is presented as means with (95% CIs), and graphs are represented as mean±SEM. Statistical analysis was performed using IBM SPSS Statistics software (version 24; SPSS Inc., IBM Corporation, Armonk, NY, USA). Graphs were created using GraphPad Prism software (version 7.0a; GraphPad Software Inc., La Jolla, CA, USA).
Results
Time of tissue collection
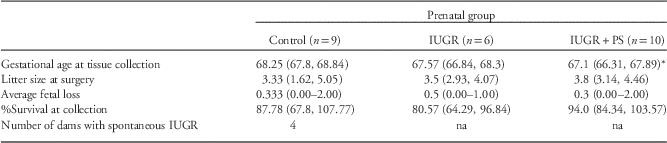
Dams allocated to IUGR+PS protocols presented with signs of onset of labour before GA69 that necessitated tissue collection significantly earlier than control dams [MD: 1.15 (0.35, 2.26); P=0.042, Table 1]. The GA at collection for dams in the IUGR only cohort did not differ to control dams. There were no differences in litter sizes at the time of surgery. Nor did IUGR or the addition of PS affect the per cent of surviving fetuses at the time of collection, or the number of fetal demises.
Maternal pregnancy characteristics

IUGR, intrauterine growth restriction.
Gestational age (GA) of groups at end of experiment: maximum of GA69 or based on the onset of labour (pubic symphysis dilatation >2 cm for 48 h). Previous studies have shown that delivery is imminent after this time.Reference Dyson, Palliser, Kelleher, Hirst and Wright 59 , Reference Kelleher, Hirst and Palliser 60 Data analysed by one-way ANOVA.
*P<0.05 IUGR+PS v. control.
Cortisol concentrations
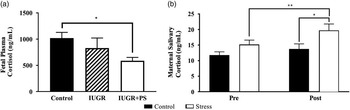
Circulating cortisol concentrations, at the end of gestation within the fetus was significantly affected by prenatal grouping [control 1037.8 (782.24, 1293.39); IUGR 816.45 (443.32, 1189.58) and IUGR+PS 614.23 (473.77, 754.38) ng/ml, respectively; P=0.014], but not sex. This effect was due to markedly lower plasma cortisol within IUGR+PS fetuses compared with controls [MD: 423.58 (135.1, 712.07); P=0.004, Fig. 1a]. Control and IUGR alone fetuses did not have differing circulating concentrations.
Fetal plasma cortisol (a) and overall maternal salivary cortisol concentrations of control and stressed dams. Fetal plasma cortisol concentrations (a) between control (black bars, n=11) and intrauterine growth restriction (IUGR) fetuses (hashed bars, n=12) did not differ. IUGR+PS fetuses (white bars, n=13) had significantly lower cortisol than control counterparts (P=0.004). Exposure to strobe light increased maternal salivary concentrations (b) in the stressed dams (white bars, n=9) compared with control dams (black bars, n=8) at the post-time point (P=0.004). Stressed dams had greater post-salivary cortisol than pre-strobe light (P=0.007), whilst control dams did not differ in pre- v. post-salivary cortisol. Graphs presented as mean±s.e.m. Fetal data analysed by generalised estimating equation; *P<0.05. Maternal data analysed by repeated measures ANVOA; *P<0.05, **P<0.01.

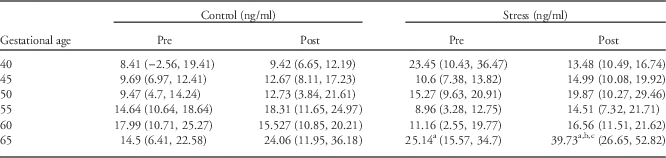
There was a significant effect of overall exposure to strobe light on average maternal salivary cortisol concentrations between non-stressed [12.77 (9.51, 16.03) ng/ml] and stressed dams [17.54 (14.38, 20.53) ng/ml; MD: 4.68 (0.20, 9.17); P=0.042]. Unexposed (control) dams did not differ in their average gestational pre- v. post-cortisol concentrations of 11.78 (9.3, 14.26) and 13.76 (9.88, 17.63) ng/ml, respectively. However, strobe light exposure significantly increased post-salivary cortisol [19.71 (14.95, 24.46) ng/ml] v. pre-salivary cortisol [15.19 (11.95, 18.44) ng/ml] in the stressed dams [MD: 4.51 (1.60, 7.42); P=0.007, Fig. 1b]. Salivary cortisol was also significantly increased at the post-time point between control and stressed dams [MD: 5.59 (2.36, 11.67); P=0.042], whilst there was no difference between groups at the pre-time point. The largest and significant increase was seen at the late gestation time point [GA65; MD: 10.613 (2.914, 18.312); P=0.01], where stressed dams also had higher basal [MD: 14.70 (4.92, 24.49); P=0.006] and post stressing salivary cortisol levels [MD: 17.65 (0.74, 34.57); P=0.042, Table 2 for means and CIs].
Maternal salivary cortisol concentrations before (pre) and after (post) strobe light stress exposure

Saliva collected immediately before and after strobe light exposure or control conditions. Data analysed by repeated measures ANOVA.
a P<0.05 v. control pre-saliva.
b P<0.05 v. control post saliva.
c P<0.05 v. stress pre-saliva.
Plasma, brain and placental allopregnanolone concentrations
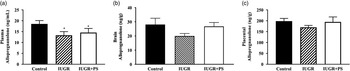
There was no interaction between group and sex, however there was a significant effect of group alone in plasma allopregnanolone concentrations (P=0.003, Fig. 2a), thus sexes were combined in each group. Pairwise comparison found less circulating allopregnanolone in IUGR (P=0.001) and IUGR+PS fetuses (P=0.029) than control fetuses. No differences in brain or placental allopregnanolone concentrations were identified between control, IUGR or IUGR+PS fetuses (Fig. 2b and 2c, respectively).
Circulating plasma, brain and placental tissue allopregnanolone concentrations in control (black bars, n=10); IUGR (hashed bars, n=10); and IUGR+PS (white bars, n=12) fetuses. IUGR and IUGR+PS fetuses had significantly less circulating allopregnanolone (a) than control (P=0.001 and P=0.029, respectively). Brain (b) and placental (c) allopregnanolone concentrations did not differ between groups. Data analysed by GEE with group comparison. Graphs presented as mean±s.e.m. *P<0.05. PS, prenatal stress.

Fetal physical measures
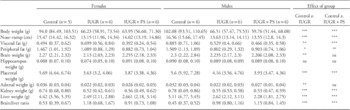
There was a significant effect of prenatal group on body weight (P<0.001), peripheral (P=0.011) and visceral fat (P<0.001), brain (P=0.003), liver (P<0.001) and placenta (P<0.001) weights, nose–rump length (P<0.001) and brain:liver ratio (BLR, P<0.001) between control, IUGR and IUGR+PS fetuses. IUGR and IUGR+PS did not affect hippocampal weight. No differences in physical parameters existed between naturally occurring and induced IUGR fetuses.
IUGR male and female fetuses were found to have reduced body weight, nose–rump length, visceral and peripheral fat weight, as well as brain, adrenal, kidney and liver weight. Male and female IUGR fetuses also had significantly greater BLR compared with control fetuses. IUGR and IUGR+PS fetuses did not differ in their physical measures. IUGR+PS fetuses also displayed similarly reduced parameters, however, they did not differ in brain or adrenal weights in relation to control fetuses (summarised in Table 3; see Supplementary Table S1 for mean comparative difference, 95% Wald CI and P-values).
Physical characteristics of control, intrauterine growth restriction (IUGR) and IUGR+PS fetuses at term

PS, prenatal stress.
All measurements are presented in metric units, except brain:liver ratio, which is presented as a ratio value of brain and liver weights. This value is indicative of asymmetrical growth restriction (brain-sparing) when the value is >0.9. Peripheral fat refers to brown adipose tissue (BAT) on the fetus’ neck+back. Visceral fat refers to BAT encasing kidneys. Data presented as means (95% CI). No differences were found between IUGR and IUGR+PS fetuses.
*P<0.05; **P<0.01; ***P<0.001 for post-hoc pairwise comparison between control v. IUGR, and control v. IUGR+PS groups (male and female fetuses combined).
Hippocampal immunohistochemistry
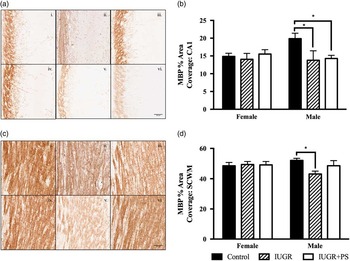
Significant interaction of prenatal group and sex was observed for MBP area coverage in the CA1 region of the hippocampus (P<0.001). IUGR and IUGR+PS male fetuses had significantly less MBP area coverage in the hippocampal CA1 region compared with control males (P=0.005 and P<0.001, respectively, Fig. 3). No difference in CA1 MBP coverage was identified between IUGR and IUGR+PS fetuses. An interaction of prenatal group and sex was seen in the subcortical white matter (SCWM; P=0.033). IUGR males had less MBP area coverage in the SCWM compared with controls (P=0.003), IUGR+PS males did not differ to control or IUGR alone males. No differences were found between females from any group in MBP area coverage in either region. Nor were differences in MBP area coverage identified between naturally occurring and induced IUGR fetuses.
%Area coverage of myelin basic protein (MBP) in the CA1 region of the hippocampus and subcortical white matter (SCWM). Representative micrographs of hippocampal CA1 (a) and SCWM (c) MBP area coverage for control (female (i); male (iv)); IUGR (female (ii); male (v)) and IUGR+PS (female (iii); male (vi)) brains. %Area coverage of CA1 (b) and SCWM (d) of the hippocampus in control (black bars), IUGR (hashed bars), and IUGR+PS (white bars) fetuses. n=5 for males and females in each group. Data analysed by GEE with pairwise comparisons. Graphs presented as mean±s.e.m. *P<0.05. Scale bars=50 μm.

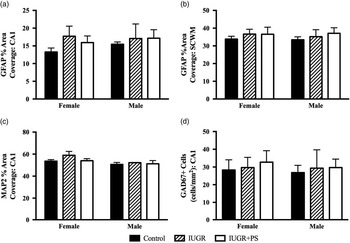
No differences were seen in GFAP area coverage in the CA1 region or SCWM of control, IUGR or IUGR+PS fetuses from either sex (Fig. 3a and 3b). Similarly, no changes in area coverage of MAP2 was found in the hippocampal CA1 (Fig. 3c) region between any prenatal group, nor in GAD67+cell numbers (Fig. 4d).
Astrocyte, neuron and GABAergic markers in the hippocampus. %Area coverage of glial fibrillary acidic protein in the CA1 region (a) and subcortical white matter (b) of the hippocampus; microtubule-associated protein 2 in the CA1 region (MAP2) (c) and positive staining of GAD67 cells within the CA1 (cells/mm2) (d). No differences were found in GFAP and MAP2% area coverage nor in the number of GAD67+ cells within the hippocampal region for control animals (black bars); IUGR (hashed bars); or IUGR+PS fetuses (white bars). Females n=5; and males n=5 for each group. Data analysed by GEE with pairwise comparisons. Graphs presented as mean±s.e.m.

Amygdala immunohistochemistry
No differences in GFAP or MAP2% area coverage were found in the BLA or CeA of the amygdala. In addition, no changes were identified in GAD67+ cell numbers in these regions between control, IUGR and IUGR+PS fetuses (data not presented).
Discussion
This study is the first to investigate the combined effects of intrauterine growth restriction and prenatal stress on allopregnanolone concentrations and fetal brain development. The overall finding of this study is that compromised male fetuses demonstrated delayed hippocampal myelination. Interestingly, the addition of prenatal stress seemed to suppress the late gestation cortisol increase, as well as inducing a protective effect on subcortical white matter in male fetuses; and on brain and adrenal weights of IUGR fetuses in this model. This may involve adrenal activation leading to an increase of adrenal derived neuroprotective steroids.
Previous studies in guinea pigs have shown that prenatal stress resulted in decreased MAP2, GFAP and MBP in the fetal hippocampus, particularly among male fetuses.Reference Bennett, Palliser, Saxby, Walker and Hirst 25 It is well established that many compromises in pregnancy, including IUGR and PS, leads to reductions in myelination.Reference Bennett, Palliser, Walker and Hirst 48 , Reference Piorkowska, Thompson and Nygard 63 , Reference Xu, Yang and Yan 69 , Reference Tolcos, Bateman and O’Dowd 70 However, the guinea pig model used in this study identified that the combination of IUGR and prenatal stress had a less severe impact on neurodevelopment. This is in contrast to the previous studies in guinea pig in which prenatal stress that have reported losses, with preservation of GFAP and MAP2 in both the hippocampus of male and female fetuses within this study. There was also increased coverage of MBP in the SCWM of males following the addition of stress. This suggests that IUGR+PS is had a lesser effect than IUGR alone and, based on previous studies, less of an impact than PS alone.Reference Bennett, Palliser, Saxby, Walker and Hirst 25 , Reference Bennett, Palliser, Shaw, Walker and Hirst 26 , Reference Bennett, Palliser, Walker and Hirst 48 One study has shown, not only is there a loss or delay in myelination following IUGR in utero, there is also loss of oligodendrocyte precursors.Reference Olivier, Baud, Evrard, Gressens and Verney 19 Myelin is critical for the signal transduction and connectivity of neurons. Deficits in myelination in adolescence and adulthood are associated with poor school performance in childhood, as well as in disorders such as schizophreniaReference Flynn, Lang and Mackay 71 (a disorder of which males have a higher risk of developingReference Aleman, Kahn and Selten 72 , Reference Iacono and Beirser 73 ) and major depression.Reference Tham, Woon, Sum, Lee and Sim 74 Examination of precursor cells following IUGR and PS may reveal the replenishing capability of the brain and may lead to an inability of the brain to rectify loss of myelination following damage. Therefore, the loss of myelin, and/or the precursor cells in fetuses following IUGR may be an important determining factor in the development of later life behavioural and cognitive disorders. Future work will be required to investigate if the combination of PS and IUGR improves behaviour and cognition compared with the known deficits in IUGR alone and PS offspring.Reference Beversdorf, Manning and Hillier 30 , Reference Bergman, Sarkar, O’Connor, Modi and Glover 75 – Reference Watson, Mednick, Huttunen and Wang 78
The fetuses in this study had reduced circulating allopregnanolone levels, however brain and placental synthesis was not impacted by IUGR or IUGR+PS. Importantly, in contrast to many other species, and as in women, progesterone levels in the maternal plasma do not decline before the onset of labour in the guinea pig, but fall after the placenta is lost after birth. Therefore, differences in the proximity to the onset of labour during late gestation would not affect allopregnanolone concentrations. This suggests an impairment of allopregnanolone and/or precursor transfer from placenta to the fetus, or increased utilisation of circulating allopregnanolone into the brain to maintain levels. Despite these reductions in circulating allopregnanolone, females were able to preserve myelination within the CA1 of the hippocampus and SCWM. Interestingly, there was no additive effect of PS to damage caused by IUGR within the SCWM of males, and actually seemed to confer a protective effect on the maturation of myelination in these fetuses. Acute stressors, including hypoxia and psychological stress are known to increase allopregnanolone concentrations.Reference Lockhart, Warner and Pearlstein 79 , Reference Droogleever Fortuyn, van Broekhoven and Span 80 Conversely, chronic disorders such as PTSD are associated with a reduction in the production of allopregnanolone.Reference Rasmusson, Pinna and Paliwal 81 Despite the increased overall maternal cortisol in response to strobe light stressing, the finding of reduced circulating cortisol in fetuses from stressed mothers in this study is in contrast to majority of studies that suggest prenatal stress increases fetal cortisol which may be due to differences in the times when the samples were collected after the stresses. The reductions in level observed may have contributed to the limited effects on myelination within the subcortical white matter of male IUGR+PS fetuses. In addition, the combination of IUGR and PS may have induced a stress event that could have increased levels of allopregnanolone transiently but sufficiently to preserve myelination in this region. However, as sample collection for allopregnanolone and cortisol assays was several days after the last stress episode levels may have returned to close to control values at the end-point collection, and we cannot exclude the possibility of reductions occurring during or after chronic stressing. As allopregnanolone is neurotrophic for myelin development and a known modulator of GABAA receptor subunit composition,Reference Ghoumari, Ibanez and El-Etr 42 , Reference Droogleever Fortuyn, van Broekhoven and Span 80 , Reference Follesa, Serra and Cagetti 82 , Reference Maguire, Stell, Rafizadeh and Mody 83 potential changes in local production in the brain may induce changes in myelin structure and GABAA receptor sensitivity in response to IUGR. This in turn may be programming the brain for a greater predisposition to the development of later life disorders commonly associated with pregnancy compromises. Whilst allopregnanolone is a key neurosteroid of pregnancy, there are other 5α, 3α-derived neurosteroids, including adrenal derived 5α, 3α-tetrahydrodeoxycorticosterone (THDOC), and androgen-derived 3α-androstanediol (3α-diol). These are also positive allosteric modulators of the GABA type A receptor.Reference Reddy and Jian 84 , Reference Reddy and Rogawski 85 Stress is known to increase circulating concentrations of deoxycorticosterone (DOC) as well as cortisol released from the adrenal glands.Reference Barbaccia, Roscetti and Trabucchi 47 The same enzymes that convert progesterone to allopregnanolone, convert DOC to THDOC, which may act as a neuroprotective hormone by similar mechanisms to allopregnanolone.Reference Mellon 86 We did not measure THDOC in these animals, however, given that prenatal stress causes a chronic increase in cortisol within the fetus,Reference Dauprat, Monin, Dalle and Delost 87 we cannot exclude that there is a potential upregulation of THDOC in these IUGR+PS animals that may be providing a protective effect not seen in the males exposed to IUGR alone.
The neurodevelopment markers MAP2 and GFAP, and the expression of GABA synthesising enzyme GAD67 were not altered in the amygdala of IUGR or IUGR+PS fetuses. The amygdala commences and ceases development early in gestation compared to the hippocampus which develops throughout the entirety of pregnancy.Reference Bayer, Altman, Russo and Zhang 56 This suggests that during the period of IUGR and prenatal stress induction, the window of vulnerability may have already passed for this region, thus limiting any effects on GFAP and MAP2 in the CeA and BLA. Despite the development of the amygdala preceding the onset of insults, IUGR fetuses remain more likely to develop neuropsychological disorders, such as ADHD, schizophrenia and anxiety in later life.Reference Heinonen, Räikkönen and Pesonen 8 , Reference Nilsson, Stålberg and Lichtenstein 88 We did not find differences in mature neuron dendrites in this study, however these markers do not account for cell functionality. MRI data in brains of children born following IUGRReference Batalle, Eixarch and Figueras 89 show that IUGR alters global and regional connectivity within the brain, similar to changes in signalling seen in ADHD and schizophrenia.Reference Wang, Zhu and He 90 , Reference Alexander-Bloch, Gogtay and Meunier 91 The finding of the present work does not exclude potential changes in the receptors of neurons and glia in these areas, which would not be reflected in the structural proteins investigated.
The method of induced growth restriction in the current studies is a less severe insult at the time of surgery compared with previous artery ligation and ablation models. The restriction of blood flow from the uterine artery, while occurring at the same time during gestation, is gradualReference Herrera, Alegría and Farias 54 , Reference Dickinson, Miller and Nitsos 92 as opposed to instantaneous in previous models,Reference Mallard, Loeliger, Copolov and Rees 13 , Reference Lafeber, Rolph and Jones 93 , Reference Turner and Trudinger 94 and we contend is more representative of human onset of IUGR than the previous methods. The changes seen in MBP and allopregnanolone in this model may reflect a later onset of IUGR, compared with previous models that display changes in neuronal markers reflecting an early onset of insufficiency.Reference Mallard, Loeliger, Copolov and Rees 13 , Reference Dieni and Rees 95 However, many studies, particularly involving children from premature deliveries, suggest that even offspring with seemingly normal neurodevelopment following an impaired in utero environment are still at a greater risk of developing disorders such as schizophrenia, ADHD, depression and anxiety. The model used here may provide greater insight with longitudinal studies, in investigating the changes of the neural microenvironment and changes in behaviour at neonatal and juvenile equivalence, and whether the differences seen between IUGR and IUGR+ PS induce differing behavioural development at these time points. This in turn may aid the development of interventions or treatments to prevent the onset of these problems within this vulnerable population.
Acknowledgements
This study used the service of Hunter Medical Research Institute’s Critical Research Design, Information Technology and Statistical Support (CReDITSS) team, with assistance from Kerrin Palazzi. Thank you to Britt Saxby for conducting the allopregnanolone radioimmunoassay.
Financial Support
This research was supported by the National Health and Medical Research Council (grant number 1044846).
Conflicts of Interest
None.
Ethical Standards
The authors assert that all procedures contributing to this work comply with the ethical standards of the National Health and Scientific Research Council Australian Code of Practice for the Care and Use of Animals for Scientific Purposes (8th edition, 2013) and have been approved by the University of Newcastle Animal Care and Ethics Committee.
Supplementary Material
To view supplementary material for this article, please visit https://doi.org/10.1017/S2040174417000307