Introduction
Over the long term, the ability of a population to respond adaptively to environmental changes depends on the level of genetic variability or diversity that it contains (Ayala and Kiger, Reference Ayala and Kiger1984). Understanding the relative importance of processes that structure diversity within and among populations can provide both a means to assess future risk of erosion of diversity and a means to design effective conservation strategies for rare taxa (Neel and Ellstrand, Reference Neel and Ellstrand2003). Information on genetic diversity pattern of economically important, rare and threatened plant species is a prime concern to develop strategies for sustainable harvesting of secondary metabolites and, where appropriate, reintroduction to its natural habitat (Neel and Cummings, Reference Neel and Cummings2003). Nothapodytes nimmoniana Graham (Icacinaceae) syn. Mappia foetida Miers is one such threatened species having great medicinal value.
Nothapodytes nimmoniana, commonly known as ‘stinking tree’, is a medium-sized tree distributed in the evergreen, semi-evergreen and deciduous forests of Western Ghats of India, North East India, Srilanka, Myanmar and Thailand (Hombegowda et al., Reference Hombegowda, Vasudeva, Georgi, Shaanker and Ganeshaiah2002). It is a rich source of anti-cancer alkaloids camptothecin (CPT) and 9-methoxy CPT (9-mCPT) (Govindachari and Viswanathan, Reference Govindachari and Viswanathan1972). CPT is regarded as one of the most promising anti-cancer drugs of the 21st century (Li and Adair, Reference Li and Adair1994). It is shown to be effective in the complete remission of lungs, breast (Takeuchi et al., Reference Takeuchi, Dobashi, Fujimoto, Tanaka, Suzuki, Terashima, Hasumi, Akiya, Negishi and Tamaya1991) and uterine cervical cancers (Potmesil, Reference Potmesil1994). Its primary cellular target is topoisomerase I, and the anti-tumour activity is attributed to the inhibition of topoisomerase I (Hsiang et al., Reference Hsiang, Hertzberg, Hecht and Liu1985). Irinotecan and Topotecan, two water-soluble derivatives of CPT, have been approved by the FDA of the USA for treating colorectal and ovarian cancers (Vladu, Reference Vladu2000). In recent years, because of the enormous demand for the chemical worldwide, there has been an indiscriminate felling of N. nimmoniana from Western Ghats. In fact, it is estimated that in the last decade alone, there has been at least a 20% decline in the population leading to the red listing of the species as vulnerable (Ved, Reference Ved1997; Ravikumar and Ved, Reference Ravikumar and Ved2000). The species is now confined only to the remnant of forest pockets. Thus, an understanding of the genetic diversity and structure of N. nimmoniana is important for developing effective conservation strategies for this species in Western Ghats of India, which has not been investigated so far.
DNA markers are able to detect the genetic variation beyond coding loci and to provide broader information on the amount of genetic variation and the genetic divergence among populations (Winter and Kahl, Reference Winter and Kahl1995). Dominantly expressed multilocus DNA markers such as inter simple sequence repeat (ISSR) have been successfully used to provide valuable information about the genetic diversity and structure of natural plant populations including medicinal plants (Souza and Lovato, Reference Souza and Lovato2010; Wu et al., Reference Wu, Guo, He, Lin, Luo and Liu2010). It amplifies DNA sequence between the two adjacent, inversely oriented repeats of microsatellites (Zietkiewicz et al., Reference Zietkiewicz, Rafalski and Labuda1994). In comparison with molecular assays such as amplified fragment length polymorphism (AFLP) and restriction fragment length polymorphism, ISSR is cost-efficient, overcomes hazards of radioactivity and requires lesser amounts of DNA (25–50 ng). Furthermore, ISSR markers have higher reproducibility than random amplified polymorphic DNAs (RAPDs) (Meyer et al., Reference Meyer, Mitchell, Freedman and Vilgays1993; Fang et al., Reference Fang, Roose, Krueger and Federici1997), are more informative, (Nagaoka and Ogihara, Reference Nagaoka and Ogihara1997), require no prior sequence information and hence were the choice markers for this study. This study consists of exploration and collection of N. nimmoniana from Western Ghats of India, mapping its distribution using DIVA GIS software (Hijmans et al., Reference Hijmans, Guarino, Jarvis, O'Brien, Mathur, Bussink, Cruz, Barrantes and Rojas2005) and analysing its population genetic diversity and genetic structure using ISSR markers.
Materials and methods
Exploration and collection
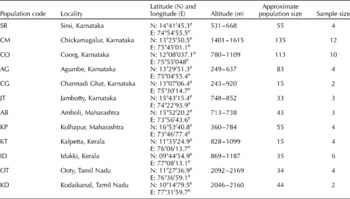
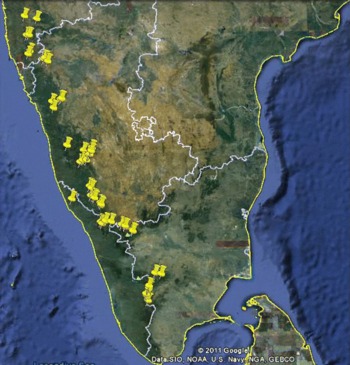
An extensive floristic survey was conducted to collect N. nimmoniana from Western Ghats of India. The study area covered four states of South India, namely Kerala, Tamil Nadu, Karnataka and Maharashtra and 12 populations. The geographic location data (latitude, longitude and altitude) for 57 accessions from the 12 populations of N. nimmoniana were collected using global positioning system. The latitudes of the collection sites ranged from 09°34′39.2″ to 16°48′26.0″ and the altitudes ranged from 243 m (Charmadi Ghat, Karnataka) to 2169 m (Ooty, Tamil Nadu). Details of the accessions collected and analysed were given in Table 1. DIVA GIS software was used to map geographical distribution of the species (Fig. 1).
Details of N. nimmoniana populations taken for inter simple sequence repeat analysis

Geographical distribution map of N. nimmoniana. A colour version of this figure can be found online at journals.cambridge.org/pgr.

DNA extraction and ISSR-PCR analysis
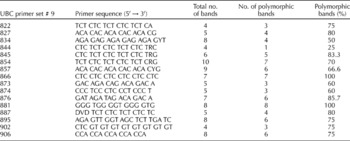
Total genomic DNA was isolated from the fresh leaves (0.5 g) of N. nimmoniana using modified cetyltrimethyl ammonium bromide method (Doyle and Doyle, Reference Doyle and Doyle1987). Quantity and quality of the DNA samples were estimated by comparing band intensities on a 0.8% agarose gel and using a spectrophotometer. The components of the ISSR-PCR were optimized with varying concentrations of template DNA, dNTPs, Taq DNA polymerase and annealing temperature. The reaction was performed in a volume of 10 μl containing 50 ng template DNA, 0.5 mM dNTPs (Chromous Biotech, Bangalore, India), 0.15U Taq DNA polymerase (Chromous Biotech), 0.5 mM ISSR primers of UBC set # 9 (The Michael Smith Laboratories, University of British Columbia, Vancouver, BC, Canada) and 1X PCR buffer (10 mM Tris–HCl, pH 8.3, 50 mM KCl, 3 mM MgCl2) (Merck, Darmstadt, Germany). A total of 16 reproducible primers were selected from 100 ISSR primers for this study (Table 2). A control PCR tube containing all components but no genomic DNA was run with each primer to check any contamination. The reactions were carried out in a DNA thermocycler (Eppendorf, Hamburg, Germany). The PCR program consisted of an initial denaturation step of 94°C for 4 min, followed by 34 cycles at 94°C for 1 min, 45 s at the specific annealing temperature of each primer (45–69°C), 72°C for 1 min, and a final extension at 72°C for 8 min and a hold temperature of 4°C at the end. After amplification, the reaction products were subjected to electrophoresis in 1.5% agarose gels in 1 × Tris Acetate EDTA (40 mM Tris-acetate, 1 mM EDTA, pH 8.3) buffer stained with 5 μg/ml ethidium bromide and photographed under UV light with the help of a gel documentation system (Bio-Rad, Hercules, CA, USA). A 1 kb molecular ladder was used as a marker to know the size of the fragments. All the PCR results were tested for reproducibility at least three times. Bands that did not show fidelity were eliminated.
Inter simple sequence repeat primers used for PCR amplification of N. nimmoniana and total number of amplified fragments generated from 57 individualsa
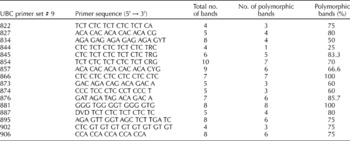
UBC, University of British Colombia.
a Y, (C, T); D, (A, G, T); V, (A, C, G); R, (A, G).
Data analysis
Amplified fragments for the 16 ISSR primers, which were reproducible and consistent in performance, were scored for band presence (1) or absence (0) and a binary qualitative data matrix was constructed. Percentage of polymorphic bands (PPB) was calculated by dividing the number of polymorphic bands by the total number of bands surveyed. The binary matrix was used to determine the genetic diversity, genetic differentiation and gene flow using the program PopGene 32 version 1.31 (Yeh et al., Reference Yeh, Yang and Boyle1999). Genetic diversity within and among populations was measured by the PPB, effective number of alleles (n e), observed number of alleles (n a), Nei's (Reference Nei1973) gene diversity (h) and Shannon's information index (I). At the specieswide level, total genetic diversity (H T), genetic diversity within populations (H S) and Nei's coefficient of genetic differentiation among populations (G ST = (H T − H S)/H T) were calculated. Corresponding estimates of gene flow (N m), i.e. the average number of migrants per generation exchanged among populations, was calculated using the formula N m = 0.5(1 − G ST)/G ST (Nei, Reference Nei1978). Analysis of Molecular Variance (AMOVA) (Excoffier et al., Reference Excoffier, Smouse and Quattro1992) was performed to calculate the partitioning of genetic variance among and within population using GenAlEx version 6.41 (Peakall and Smouse, Reference Peakall and Smouse2006). The permutation number for significance testing was set to 999 for all the analysis. Given that the above estimation of allele frequencies from dominant markers requires the assumption of the Hardy–Weinberg equilibrium. For elucidating the relationship between the populations, unweighted pair-group method with arithmetic averages dendrogram was constructed based on Nei's (Reference Nei1978) unbiased genetic diversity. Bootstrap analysis of 1000 replicates was used to assess the statistical support of each branch by using the TFPGA program version 1.3 (Miller, Reference Miller1997).
Results
Exploration and collection of N. nimmoniana
A total of 12 distinct populations of N. nimmoniana were located and 57 representation accessions were collected during our exploration and collection missions along the Western Ghats of India. It has been observed that the distribution of the population was discontinuous and the number of individuals in most of the populations was few. Due to the anthropogenic activities and unsustainable harvesting of CPT, most of the trees were cut. The flowering time varied from June to January and ripened fruits were available from October to June in the different populations of Western Ghats. This variation in flowering and fruiting time is due to different agroclimatic conditions prevalent along the Western Ghats.
Genetic diversity
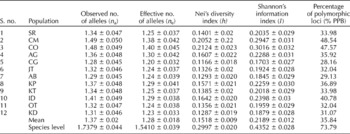
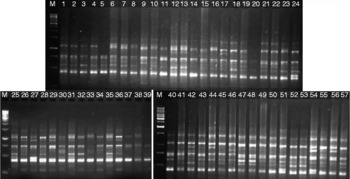
Using the 16 ISSR-University of British Colombia (UBC) primers that showed the best resolution in the amplification profiles, 103 clearly identifiable bands were obtained from 57 accessions of 12 populations from four states. Of these, 76 (73.7%) bands were polymorphic and remaining 27 (26.2%) were monomorphic bands. But, at the population level, the PPB ranged from 28.16 to 48.54%, with an average of 35.84% (Table 3). Each primer yielded four to ten bands with an average of 6.44 bands per primer. The sizes of bands ranged from 350 to 2000 bp (Fig. 2). From UBC 866 and UBC 881, 100% polymorphic bands were recorded. Since ISSR markers are dominant, each band represents the phenotype at a single biallelic locus. The ISSR primers identified in this study will be used for further genetic analysis of N. nimmoniana.
Genetic variability parameters of N. nimmoniana based on inter simple sequence repeat markers

ISSR fingerprint of 57 accessions of N. nimmoniana using primer University of British Colombia 857. Lane M, 1 kb marker.

Assuming the Hardy–Weinberg equilibrium, the average Nei's (Reference Nei1973) gene diversity (h) ranged from 0.1166 ( ± 0.1872) to 0.2124 ( ± 0.2334), with an average of 0.1518 ( ± 0.0246) at the population level and 0.2965 ( ± 0.0419) at the species level. Shannon's index (I) ranged from 0.1703 ( ± 0.2733) to 0.2947 ( ± 0.3184), with an average of 0.2189 at the population level and 0.4352 ( ± 0.2829) at the species level. Among the 12 populations, CM population exhibited the highest level of genetic diversity (PPB = 48.54%, h = 0.2124 and I = 0.2947), whereas CG population showed the lowest variability (PPB = 28.16%, h = 0.1166 and I = 0.1703). The genetic diversity of populations from high to low ranked as follows: CM>CO>ID>KP>AG>SR>KT>OT>JT>KD>AB>CG. The same results were also obtained by observing the number of alleles (n a) and effective number of alleles (n e) (Table 3). When calculated across the populations, the n a and n e values equalled 1.7379 and 1.5410, respectively.
Population genetic structure
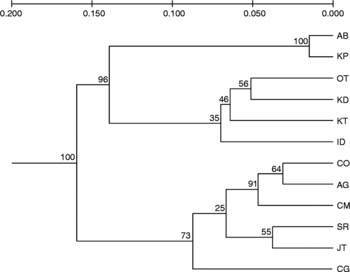
Across the 12 populations of N. nimmoniana surveyed for ISSR variation, Nei's estimator of population substructure (G ST) indicated a fairly high level of population differentiation (G ST = 0.4882). These G ST values translated into correspondingly low levels of gene flow (N m), with 0.5242 migrants exchanged between populations (on average) in each generation. The AMOVA also revealed highly significant genetic differences among the 12 populations of N. nimmoniana (Table S1, available online only at http://journals.cambridge.org). The analysis revealed that a larger part of the genetic variation exists within the populations (73%) than among the populations (27%) (ΦPT = 0.271, P < 0.001). The dendrogram obtained using the UPGMA algorithm based on Nei's (Reference Nei1978) genetic distance is presented in Fig. 3. The analysis of groupings showed the formation of two groups, one comprising the samples of the SR, CM, CO, AG, CG and JT, and the other the populations of AB, KP, KT, ID, OT and KD. As observed by the mean values of similarity, the populations of AB and KP were genetically close related, while populations CG and ID were more distantly related. Genetic distances between the populations ranged from 0.0252 (between AB and KP) to 0.3230 (between CG and ID), and the Nei's genetic identity ranged from 0.7240 to 0.9751 (Table S2, available online only at http://journals.cambridge.org).
UPGMA dendrogram illustrating the genetic relationships among 12 populations of N. nimmoniana, based on Nei's (1978) unbiased genetic diversity. Numbers on branches indicate bootstrap values from 1000 replicates.

Discussion
Threatened medicinal plant species have become the focus of world attention, because they represent a vanishing and decreasing flora in need of protection and conservation and their role as an essential commodity for health care cannot be neglected (Kala, Reference Kala2005). Scientific approaches for conservation and utilization of plant resources require accurate assessment of the amount and distribution of genetic variation within and among populations (Shah et al., Reference Shah, Li, Gao, Li and Moller2008). Several aspects of conservation biology, such as loss of genetic diversity and restoration of threatened populations, can only be addressed by detailed population genetics studies (Hamrick and Godt, Reference Hamrick, Godt, Brown, Clegg, Kahler and Weir1989). A species without enough genetic diversity is thought to be unable to cope with changing environments and demographic fluctuations, both in the short and long term (Reisch et al., Reference Reisch, Poschold and Wingender2003).
This study clearly showed that relatively high level of genetic variation (PPB = 73.7%; h = 0.3001; I = 0.4353) exists among N. nimmoniana. Similar result was reported in Rheum tanguticum, an endangered perennial medicinal herb in China, (h = 0.2689 and I = 0.4163) using ISSR markers (Hu et al., Reference Hu, Wang, Xie, Yang, Li and Zhang2010). Rare and endangered species are generally known to have low genetic variability. However, some endangered species also showed high levels of genetic variation even within extremely narrow distributions such as Apterosperma oblate (h = 0.275) (Su et al., Reference Su, Zan, Wang, Ying and Ye2008) and Heptacodium miconioides (h = 0.2469) (Jin and Li, Reference Jin and Li2007), both were assessed by ISSR markers.
Restricted gene flow and genetic drift might have influenced the extent of differentiation among N. nimmoniana populations. The G ST-derived N m value of 0.4709 is indicative of restricted gene flow among natural populations, and this value is actually below the level (N m≈1) needed to counteract genetic drift (Slatkin, Reference Slatkin1993). Equivalently the high G ST value of 0.515 (GsT>0.15) also implied the rapid genetic differentiation among the populations. The high genetic differentiation was also confirmed with the AMOVA (ΦPT = 0.271). Similar results were obtained in Dysosma pleiantha, a threatened medicinal plant, (AMOVA: ΦST = 0.500; Nei's genetic diversity: G ST = 0.465) by using ISSR markers (Zong et al., Reference Zong, Liu, Qiu, Yang, Zhao and Fu2008). The data on genetic structure of N. nimmoniana obtained in this study showed that the among-population differentiation coefficients (ΦPT = 0.271and G ST = 0.4882) were almost similar to, but a little higher than, the perennial endangered plants (ΦST = 0.290 and G ST = 0.3585) (Hu et al., Reference Hu, Wang, Xie, Yang, Li and Zhang2010). The result was in contrary to the earlier report on higher genetic variance (69.55%) among the populations than that within the populations (30.45%) of N. nimmoniana of Taiwan as assessed by AFLP markers (Qiuying et al., Reference Qiuying, Xiu, Jucai, Yuan, Chang and Tsai2005). The reason for the contradiction between these two studies might be the entirely different geographical populations investigated.
It is widely accepted that genetic diversity and population genetic structure are influenced by factors such as historical events, breeding system, genetic drift and natural selection (Barrett, Reference Barrett, Jain and Botsford1992). Nothapodytes nimmoniana propagates naturally by seeds. Seed germination in natural habitat is very less and due to the lack of appropriate germination conditions and hard seed-coat. In a study conducted for seed germination behaviour of N. nimmoniana in our laboratory, the recalcitrant behaviour of this seed was revealed as they showed a tendency to lose viability quickly at room temperature (data not shown). The low seed germination percentage might be one of the reasons for discontinuous and restricted distribution of this species. It was observed that very less flowering and fruit setting in some of the years (Sharma et al., Reference Sharma, Shaanker, Vasudeva and Shivanna2010), may be due to physiological reasons, might also be contributed to the vulnerable status of this species. It is important to note that the species is polygamous in nature (Hombegowda et al., Reference Hombegowda, Vasudeva, Georgi, Shaanker and Ganeshaiah2002) and is reported to be self-pollinated (26.7%) along with the widely observed cross-pollination (Sharma et al., Reference Sharma, Shaanker, Vasudeva and Shivanna2010). It is obvious that self-pollination will reduce the genetic diversity among the populations and will lead to homozygosity. But it has been observed that transition of one sex type to another every year in some of the physically disturbed individuals of N. nimmoniana resulted in ‘sex lability’ (Sharma et al., Reference Sharma, Shaanker, Vasudeva and Shivanna2010). Some of the polygamous individuals, which produced male, female and bisexual flowers during the first year, were reported to become male in the second year and the female individuals changed to polygamous. But male trees remained male across the years. This phenomenon of rotation of sexes has got great significance for genetic diversity of this species on the special context of self-pollination. It is believed that the ‘sex lability’ may reduce the risk of erosion of genetic diversity developed due to self-pollination.
The size of populations has a great effect on the long-term persistence of a species. A population with large number of individuals is proposed to have more genetic diversity, which increases their ability to adapt to changing environmental conditions (Vrijenhoek et al., Reference Vrijenhoek, Douglas and Meffe1985). On the other hand, reduction in population size usually results in loss of genetic diversity and allelic richness, inbreeding and increased extinction risk (Frankham et al., Reference Frankham, Ballou and Briscoe2002). In this study, the populations of CM and CO showed relatively more number of individuals and high population abundance than the other populations, which indicated that the agroclimatic conditions prevalent in these regions are the most favourable for this species. Due to the enormous demand for the CPT worldwide, habitat destruction of N. nimmoniana has been increased. During our survey along the Western Ghats, we could observe a drastic decrease in the number of wild populations and individuals of the species. Its habitat has been extremely threatened, mainly by overcollection, and its distribution has been reduced to a very restricted area. The consequent reductions in its distribution and population size may have promoted genetic differentiation among isolated populations (Ellstrand and Elam, Reference Ellstrand and Elam1993).
Implication for conservation and sustainable utilization
Knowledge of genetic variation within and among populations provides essential information in the formulation of appropriate management strategies for conservation (Francisco-Ortega et al., Reference Francisco-Ortega, Santos-Guerra, Kim and Crawford2000). As this study revealed, the high population differentiation and discontinuous distribution along with sharply decreasing numbers of populations and individuals remain a serious threat to N. nimmoniana. Our findings would provide ample genetic information for developing conservation strategies and sustainable harvesting of this important medicinal plant. Conservation goals may be achieved by protection of all extant populations, ex situ conservation of seeds and re-introduction of saplings to its natural populations as well in new sites. To increase an artificial gene flow among populations, we propose to collect the seeds from different populations and exchange the saplings among the populations. Translocation and establishment of new populations are frequently used to curtail the extinction risk of rare plant species (Holl and Hayes, Reference Holl and Hayes2006). For those populations with high levels of genetic variation and abundance such as CM and CO, we suggest that their habitats be protected and overexploitation be forbidden. Promoting domestication and cultivation of this species is necessary to satisfy market demand and protecting the wild resource. We have observed that N. nimmoniana could be successfully grown as an intercrop in coffee and cardamom plantations. We also suggest to adapt non-destructive harvesting of CPT without cutting the entire tree as we proposed earlier (Kavitha et al., Reference Kavitha, Kumar, Rajasekharan, Kareem and Rao2010). Our results indicate the existence of high genetic diversity among N. nimmoniana populations of Western Ghats along with high population differentiation, which enlighten the necessity to adapt conservation strategies and sustainable exploitation.