Unhealthy behavior is an important independent risk factor for several diseases such as cardiovascular disease. Next to the personal burden of cardiovascular disease, the associated costs are a burden on society as cardiovascular disease consumes 12 percent of total healthcare expenditure in the European Union (Reference Leal, Luengo-Fernandez and Gray16). Guidelines on the prevention of cardiovascular disease include advices targeted at medical and behavioral risk factors (Reference De Backer, Ambrosioni and Borch-Johnsen8). Consequently, cardiovascular prevention programs should be targeted at these risk factors.
In the current health economic climate, it is important to report both on the effectiveness and on the cost-effectiveness of such programs. A recent review was positive about the cost-effectiveness of behavior-change interventions targeted at high-risk groups (Reference Gordon, Graves, Hawkes and Eakin10). The behavior-change programs that were analyzed were intensive and did not make use of cheaper alternatives such as computer-tailored interventions (Reference Gordon, Graves, Hawkes and Eakin10;Reference Kroeze, Werkman and Brug15). Nevertheless, computer-tailored interventions have several merits: they are cheaper than face-to-face interventions; they were found to be effective and participants can consult the intervention whenever they choose. One can expect this intervention type to be cost-effective, but this has not been investigated yet. Cost-utility analyses using Markov modeling have been performed previously with positive results (Reference Annemans, Lamotte, Clarys and Van Den Abeele3;Reference Graves, McKinnon and Reeves11). However, modeling techniques have several disadvantages. First, they do not make use of real-time observations. Second, the connection between costs and effects is often unclear. Several cardiovascular prevention programs can be found in the literature but do not report on a trial-based cost-utility analysis yet (Reference Claes and Jacobs6;Reference Ronckers, Groot and Steenbakkers20;Reference van Keulen, Mesters and Brug23). The reasons for this lacuna are, among other things, the need for a randomized trial, the need for a detailed monitoring of the personnel and material input, and the need to be in line with the guidelines for economic evaluation.
The aim of the current study is to assess the cost-utility of an intervention versus usual care using data from a randomized controlled trial (PreCardio) (Reference Claes and Jacobs6). The main research question was whether a tailored intervention targeting medical and behavioral cardiovascular risk factors was cost-effective compared with a usual care intervention only targeting medical risk factors. The trial complies with the Declaration of Helsinki, was approved by the Hasselt University Ethics Committee, and was registered (ISRCTN23940498).
METHODS
Study Design
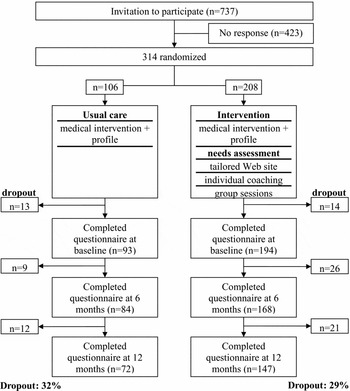
Seven hundred thirty-seven potential participants, insured by De Onderlinge Ziekenkas (a company that offers income protection insurance in case of illness or an accident) received an invitation to take part in the study. Figure 1 shows the flow-chart of the participants throughout the trial. They were highly educated (Master degree in Law—5 years of education) and lived in Belgium. Eligible participants were between 25 and 75 years with Internet access and a signed informed consent. Three hundred fourteen participants (43 percent) enrolled in the program and signed an informed consent. The participants were randomized to usual care and intervention conditions using a 1/3 versus 2/3 ratio to keep enough power to study the dose-response effects of the intervention. The nonstratified randomization was performed by an independent person. The names of the participants were written on papers that were put in sealed envelopes. Next, the envelopes were randomly assigned by hand to two baskets. The participants were blinded to group assignment. The intervention started in April 2007 and will end in April 2010. This study includes intermediate results after 1 year of intervention.
Flow chart of the participants throughout the trial.

Sample Size
The power calculation was performed with Nquery Advisor 4.0®, and it was based on the literature on sample size calculations for health-related quality of life data (Reference Walters and Brazier27). A two group t-test with a .05 two-sided significance level will have 92 percent power to detect an effect size of 0.420 and a difference in means of 0.05, assuming that the common standard deviation is 0.12, when the sample sizes in the two conditions are 200 and 100, respectively (a total sample size of 300) (Reference Walters and Brazier27).
Study Conditions
Participants in the usual care condition were invited to Hasselt University for a medical intervention. This condition was comparable to a preventive consultation in general practice following the guidelines. The risk of dying from cardiovascular disease within 10 years using the SCORE algorithm was determined (Reference De Backer, Ambrosioni and Borch-Johnsen8). The participants in the usual care condition received a general risk profile after the medical intervention. Depending on their cardiovascular risk, the participants were referred to their general practitioner for follow-up treatment (e.g., medication for hypertension).
The intervention condition additionally provided a tailored risk profile based on the medical intervention, access to a tailored Web site, individual coaching, and group sessions. The conceptual framework underpinning the tailored Web site, the individual coaching, and the group sessions was based on the Theory of Planned Behavior and the Self-Determination Theory (Reference Ajzen2;Reference Jacobs and Claes14;Reference Ryan and Deci22). The tailored Web site included several behavior-change techniques for nutrition, physical activity, and smoking cessation (e.g., self-monitoring), self-tests, and tailored advice. The individual coaching was conducted by an experienced psychologist assisted by undergraduate students Sports and Nutrition. The individual coaching was based on a needs assessment that was performed by the psychologist at baseline. The participants could determine the target behavior(s) they wanted to change, the dose of the coaching (frequency and duration), and the delivery mode (e-mail, face-to-face, and/or telephone).
Costs
A prospective cost registration was carried out alongside this trial. The cost analysis was performed using data from all the participants that enrolled in the study (n = 314). The cost data included personnel, material costs, and transportation costs. To determine personnel costs, each activity provided to a participant was electronically registered. The duration of the activities in minutes was used as a quantity for the calculation of the costs for personnel input. These quantities were multiplied with the unit costs (i.e., wages per hour) (Supplementary Table 1, which is available at www.journals.cambridge.org/thc2010001). For the personnel costs for health professionals that delivered medical interventions after referral, the duration of a consultation was based on the literature (Reference Claes, Moeremans and Frank7).
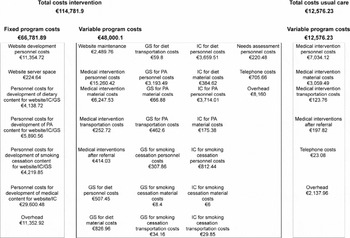
The intervention costs included fixed and variable program costs. The fixed program costs included developmental costs, a fixed cost, and overhead costs. The developmental costs consisted of Web site development personnel costs, and personnel costs for preparation of medical content and content for dietary behavior, physical activity, and smoking behavior interventions. The fixed cost was the cost for Web site server space. The overhead costs (e.g., rent, heat, electricity) equaled 17 percent and were calculated using a standard formula [(cost*0.17)/(1–0.17)]. The variable program costs are presented in Figure 2.
Results cost analysis. IC, individual coaching; GS, group session; PA, physical activity.

The usual care costs only included variable program costs. The variable program costs included personnel, material, transportation, and overhead costs. The personnel costs included costs for medical interventions at Hasselt University and costs for medical interventions by a GP or cardiologist after referral. The material costs included material costs for medical interventions and telephone costs.
The costs for participants for drug treatment were not included in the analysis because these were considered to be comparable in both conditions.
The unit costs are expressed in Euros at 2008 prices, and the costs were not discounted.
Cost-Utility Analysis and Cost-Effectiveness Analyses
The cost-utility analysis and the cost-effectiveness analyses were performed using data of the participants that filled out the questionnaires at baseline, and 6 and 12 months (n = 219). These questionnaires were used to gather the effect data. A healthcare perspective was chosen, and on-treatment analysis was performed. Baseline differences for demographic, cost, and effect data between the study conditions were examined with student t-tests and Chi-squared tests. The same methods were used for a drop-out analysis for which only the noncompleters who filled out the questionnaire at baseline were selected (n = 68). Between-group changes since baseline were analyzed using repeated-measures ANOVAs. Because of the electronic questionnaires and prospective cost registration, there were no missing data. If standard errors of skewness were less than −2 or higher than 2, the data were not considered to be normally distributed.
For a cost-utility analysis (CUA), the effect data are quality-adjusted life-years (QALYs). The Short Form 36 (SF-36)© was used to measure health-related quality of life (Chronbach's alpha 0.81–0.91) (Reference Aaronson, Muller and Cohen1). SF-36 data were converted into health state utility values for the calculation of QALYs (Reference Brazier, Roberts and Deverill5). The QALYs for the intervention and usual care conditions were calculated using the area under the curve method:

These QALYs per participant were adjusted for baseline utility differences using the DELTA QALY method (Reference Manca, Hawkins and Sculpher17):

The DELTA QALY per participant is calculated by adding the difference between the mean baseline utility of the total sample and the mean baseline utility for the study group to the QALY. For the CUA, the incremental cost-effectiveness ratios (ICER) for the intervention were calculated by dividing the incremental cost by the incremental (DELTA) QALY.

For a cost-effectiveness analysis (CEA), the effect data depend on the intervention. In the present study, behavioral effects were measured using computerized versions of the International Physical Activity Questionnaire (IPAQ) and a validated fat intake questionnaire (Reference Vandelanotte, De Bourdeaudhuij, Philippaerts, Sjöström and Sallis25;Reference Vandelanotte, Matthys and De Bourdeaudhuij26). The outcome measure for physical activity was the change in weekly physical activity of vigorous intensity in minutes. To control for over-reporting, the household activities were left out of the analysis and the final result was multiplied with .80. Physical activity of vigorous intensity was chosen because guidelines on cardiovascular prevention advise sports. The outcome measure for fat intake was the change in daily fat intake (in grams per day) (1 gram = .035 ounces). For the CEAs, the ICERs were the cost per incremental change in weekly physical activity of vigorous intensity in minutes or the cost per incremental change in fat intake (in grams).
To report the uncertainty due to sampling variation, a nonparametric bootstrapping technique was used. Bootstrap estimation is based on random sampling (1,000 replications) with replacement of several of the patients in the trial, using the original data. ICERs were calculated for each bootstrap replicate. The bootstrapped cost-effect pairs were graphically represented on cost-effectiveness planes. The planes were determined for the outcomes in DELTA QALYs and for the behavioral outcomes.
SPSS 16.0 was used to perform the statistical analyses. The bootstrapping was performed using a macro in Excel for Microsoft Windows 2007 and the significance level was set at p < .05.
Sensitivity Analyses
Because decision making in health care is undertaken in a context of uncertainty concerning the effectiveness and costs of an intervention, a sensitivity analysis has to be included and the uncertainty can be represented by a cost-effectiveness acceptability curve (CEAC). This curve gives information on the probability that the intervention is optimal, given a certain limit for the money the government is willing to spend per QALY. In Belgium, there is no official threshold. In neighboring countries, the thresholds range from £20,000 to £30,000 per QALY (United Kingdom) to a maximum threshold of €80,000 (The Netherlands) (21). The latter cutoff value is high for a cardiovascular prevention program (mostly healthy individuals with no current burden of disease). The potential burden of disease, however, can be significant because ischemic heart disease is considered as one of the leading disabling conditions by the World Health Organization (28). Furthermore, a cardiovascular prevention program can lead to benefits that may not have been fully captured in the QALY measure (e.g., behavior change, weight loss). Arguments like these are valuable to the National Institute for Health and Clinical Excellence in the United Kingdom for interventions with an ICER between £20,000 and £30,000 per QALY (19). Therefore, the cutoff score was set at €30,000 per QALY. The sensitivity analyses were performed using the same data as used in the CEA/CUA. Three sensitivity analyses were performed using the total costs and DELTA QALYs. Because computer-tailored interventions are supposed to be implemented on the large scale, the first analysis examined the effect of changes in the number of participants. Two scenarios were used: 3× more participants and 48× more participants (total of 10,000). In the latter scenario, the developmental costs become almost negligible. For this sensitivity analyses, CEACs were plotted. The second analysis examined the variations due to changes in the effectiveness of the intervention using the upper limit of the confidence interval of the mean incremental DELTA QALY. The third analysis explored the possible effect of a different intervention effectiveness, namely that in an unhealthy population. To examine this effect, the mean incremental QALY from another CUA of a walking program in a group of moderately depressed elderly women was used (Reference Gusi, Reyes and Gonzalez-Guerrero13). The incremental effectiveness in the latter study was 0.132 QALY.
After 3 years of intervention, all participants will undergo a medical intervention to determine their cardiovascular risk and gather data on (adherence to) the medication regimens prescribed by their general practitioner after referral. Adherence to the behavior-change interventions will be described elsewhere. Data on adherence were not included in the sensitivity analyses.
RESULTS
Patients
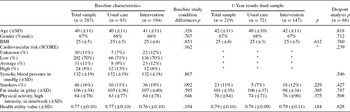
Seventy percent (219/314) of the participants at baseline completed questionnaires after 6 and 12 months. The baseline characteristics and the results of the drop-out analysis are presented in Table 1. No significant differences were found for both study groups at baseline or after 1 year of intervention. The drop-out analysis showed there were no significant baseline differences between completers and noncompleters.
Baseline Characteristics, Final Sample Results and Dropout Analysis

*Measurement of all participants at Hasselt University after 3 years.
Costs
Figure 2 shows the results of the cost analysis. The costs of the intervention equaled €114,782. Without the developmental costs, these costs equaled €48,271. The costs of usual care were €12,576. For the 147 participants in the intervention condition, the mean cost was €568. For the seventy-two participants in the usual care condition, this was €136. The mean incremental cost was €433. There was a significant difference between these costs (t = −24.661; df = 217; p = .000). The cost data were normally distributed.
Effects
The QALYs gained by the intervention and usual care were 0.770 and 0.765, respectively (t = −0.431; df = 217; p = .667). The mean incremental effectiveness of the intervention was 0.005. The effect data were normally distributed. If the QALYs were adjusted for baseline utility differences, the DELTA QALYs gained by the intervention and usual care were 0.774 and 0.758, respectively (t = −1.287; df = 217; p = .200). Supplementary Table 2, which is available at www.journals.cambridge.org/thc2010001, shows the utility values, the QALYs, and the DELTA QALYs. The mean incremental effectiveness of the intervention was 0.016. For physical activity, the mean incremental effectiveness equaled 11.20 minutes, and for fat intake, the mean incremental effectiveness was −4.40 grams of fat per day.
Cost-Utility Analysis and Cost-Effectiveness Analyses
If the unadjusted QALYs were used, the ICER was €80,421 per QALY. If the ceiling of investment is €30,000 per QALY, the probability that the intervention is cost-effective is 23 percent. If the DELTA QALYs were used, the ICER was €26,910 per QALY. If the ceiling of investment is €30,000 per QALY, the probability that the intervention is cost-effective is 55 percent. The ICER for increasing physical activity was €39 per minute. The ICER for decreasing fat intake was €98 per gram of fat. Supplementary Figure 1, which is available at www.journals.cambridge.org/thc2010001, shows the cost-effectiveness planes for the outcomes in DELTA QALYs (a) and the behavioral outcomes (b, c). For the outcomes in DELTA QALYs, the majority (90 percent) of the cost-effect pairs after bootstrap analysis were located in the northeast quadrant, suggesting more effect but at higher costs. Nevertheless, 10 percent of the cost-effect pairs were located in the northwest quadrant, suggesting higher costs without additional effect. For changes in physical activity (b) and fat intake (c), 83 percent and 89 percent and of the cost-effect pairs were located in the northeast quadrant.
Sensitivity Analyses
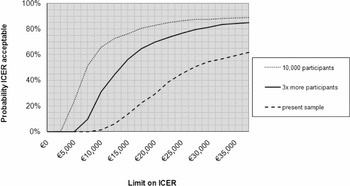
The results of the CUA were very dependent on the number of participants and the effectiveness of the intervention in this specific and overall healthy study group. Figure 3 shows the CEACs for the outcomes in DELTA QALYs for the present sample, for 3× more participants, and for 10,000 participants. The CEAC with 3× more participants showed a 81 percent probability that the intervention is an acceptable strategy if the ceiling of inversion is €30,000 per QALY. The mean incremental cost of the intervention would drop from €433 to €219. In this scenario, the ICER changed from €26,910 per QALY to €13,610 per QALY. If 10,000 participants would receive the intervention, the mean incremental cost would drop to €119. The ICER would change from €26,910 per QALY to €7,402 per QALY. The CEAC with 48× more participants showed an 88 percent probability that the intervention is an acceptable strategy if the ceiling of inversion is €30,000 per QALY. Using the higher limit of the confidence interval of the mean incremental DELTA QALY, the original ICER changed from €26,910 per QALY to €25,335 per QALY, and 91 percent of the cost-effect pairs were located in the northeast quadrant. The CEAC showed a 58 percent probability that the intervention is an acceptable strategy if the ceiling of inversion is €30,000 per QALY. If one assumes that the intervention from the present study can lead to an incremental effectiveness of 0.132 QALYs in an unhealthy sample, then the ICER would drop from €26,910 per QALY to €3,349 per QALY. In this analysis, all the cost-effect pairs were located in the northeast quadrant.
Cost-effectiveness acceptability curves. ICER, incremental cost-effectiveness ratio.

DISCUSSION
In this trial-based cost-utility analysis, a cardiovascular prevention program was compared with usual care in a general sample of highly educated adults after 1 year of intervention. The study pointed out that the intervention was cost-effective. The ICER was €26,910. The cost-effectiveness of an intervention, of course, depends on the ceiling of inversion used. The cutoff value was set at €30,000 per QALY. In case of a large scale implementation the ICER would drop to €7,402 per QALY making it highly cost-effective. In the United Kingdom, this ICER would result in a recommendation to provide the intervention, taking into account the sensitivity analyses. In the present study, the decision was made to include the developmental costs. This is not a commonly used practice because it results in a high ICER. Nevertheless, this way complete information on the costs of the intervention is included in the ICER. Moreover, the intervention from the present study was cost-effective even with the inclusion of the developmental costs.
Comparable studies on behavior-change or cardiovascular prevention interventions can be found in the literature. However, there is a large variance in the ICERs that are reported. Two other trial-based cost-utility analyses, both stimulating an increase of physical activity, reported ICERs ranging from €311 to €17,174 per QALY (Reference Gusi, Reyes and Gonzalez-Guerrero13;Reference Munro, Nicholl and Brazier18). However, these studies both targeted specific high-risk groups: groups of elderly women, with or without a moderate depression. In these studies, only one behavior was targeted, the developmental costs were not included, the interventions were less intensive and were not based on behavioral theories. Other studies using modeling reported comparable ICERs as well (Reference Bemelmans, van Baal and Wendel-Vos4). However, important costs such as the cost to screen and approach participants were not included, disregarding considerable implementation barriers.
The present study included a highly educated and overall healthy study group. Because of the higher education of these participants, the findings from the present study might not be generalizable to the Belgian population. It is indeed not our intention to generalize to other populations than the highly educated. Behavior-change interventions have to be tailored to a specific target group, and cost-utility analyses may differ by target group as well. The difference between these target groups and its relevance for the design of prevention programs and cost-utility issues have to be studied thoroughly. The highly educated are expected to live healthier and they might be the group that benefits least from cardiovascular prevention programs. In general, intervention effectiveness is higher for people with a lower socioeconomic status, but because of more barriers to deliver the intervention, the costs increase as well.
The sensitivity analysis in the present research showed that, if the intervention would be given to a less healthy target group, the ICER would change from €26,910 to €3,349 per QALY. The baseline utility values in the present study sample were indeed very high when compared with other study samples in cost-utility analyses (e.g., 0.77 versus 0.69) (Reference Gusi, Reyes and Gonzalez-Guerrero13). The incremental effectiveness found in the present study was low, 0.016 QALYs, but remains comparable to other findings (e.g., incremental QALY gain of 0.011 after 2 years) (Reference Munro, Nicholl and Brazier18).
This study has several strengths. First, this is a trial-based cost utility analysis. Second, the costs for different medical and behavioral interventions were determined in a detailed manner. Third, three behavioral risk factors were targeted in this prevention program. Furthermore, cost-effectiveness planes were determined for the behavioral outcomes. The cost-effectiveness planes showed that an investment of €400–€450 per person leads to different effects. More information is needed on the cost-effectiveness of different components of prevention programs for different target groups (different risk profiles, and so on). The present study might underestimate the intervention effects because of the more favorable behavior of our highly educated sample at baseline. The total sample consisted of 16 percent smokers compared with 21 percent/31 percent (women/men) in the general Belgian population (Reference De Bacquer and De Backer9). The fat intake in the present sample was 106 grams per day compared with 109 grams per day in the general Belgian population (Reference Vandelanotte, De Bourdeaudhuij and Sallis24). The number of smokers decreased more in the intervention condition compared with the usual care condition; however, there was no significant difference. The number of smokers was lower in our sample than in the general Belgian population, and our sample size might have been too small to detect significant effects on this outcome measure.
This study has several weaknesses. First, the present study included a small number of participants for the cost-utility analysis. Second, no modeling was used to extrapolate the results to a longer time horizon. The present study might depict an underestimation of the benefits on the long-term. The suggestion was made in the literature to use modeling to fully grasp the effects of a prevention program on the long-term (Reference Grover, Coupal and Lowensteyn12).
The results from the present study can be used in policy decisions. It is cost-effective to offer this cardiovascular prevention program to a highly educated subgroup of the population. Nevertheless, the results from health technology assessment should be considered carefully when used to inform resource allocation (Reference Gordon, Graves, Hawkes and Eakin10). The program can be financed by the ones that potentially benefit from the desired health changes, that is, the government, the insurers, and the users. More research is needed to test whether this program is cost-effective in other target groups as well.
CONCLUSION
This is the first trial-based cost-utility study of a cardiovascular prevention program in a general sample of highly educated adults. The intervention was cost-effective after 1 year of intervention. A large scale implementation would make this intervention highly cost-effective.
SUPPLEMENTARY MATERIALS
Supplementary Table 1
Supplementary Table 2
Supplementary Figure 1 www.journals.cambridge.org/thc2010001
CONTACT INFORMATION
Nele Jacobs, MSc (nele.jacobs@uhasselt.be), PhD student, Faculty of Business Economics, Patient Safety, Hasselt University, Agoralaan Building D, 3590 Diepenbeek, Belgium
Silvia Evers, MSc, PhD (s.evers@beoz.unimaas.nl), Associate Professor, Andre Ament, MSc, PhD (a.ament@beoz.unimaas.nl), Associate Professor, Department of Health Organization, Policy and Economics, Maastricht University, Universiteitssingel 40, 6229 ER Maastricht, The Netherlands
Neree Claes, MD, PhD (neree.claes@uhasselt.be), Associate Professor, Faculty of Business Economics, Patient Safety, Hasselt University, Agoralaan Building D, 3590 Diepenbeek, Belgium