I. INTRODUCTION
Frequency-selective surfaces (FSS) are passive spatial components usually made of periodic metallic elements placed over a dielectric substrate [Reference Munk1]. They present the interesting property of filtering electromagnetic waves (EMW). Depending on the pattern chosen, low-pass, high-pass, band-pass, as well as band-stop filters can be designed. Their polyvalence and simplicity make them very attractive for several applications, like radomes, dichroïc filters, or artificial magnetic conductors. Among them, one application that is getting more and more interesting from the scientific community is the development of an electromagnetic shielding for a safe indoor environment [Reference Kiani, Weily and Esselle2–Reference Stefanelli and Trinchero8]. Several reasons explain this. First, with the recent important growth of wireless telecommunication systems, EMW are now present everywhere in our urban environment. Even if it is still a controversial subject, some studies report on the harmful effects of an overuse of wireless Global System for Mobile Communications (GSM) technology [9]. It is thus natural that a part of the population is seeking for protection against EMW. A second reason is the need to protect the data that transit through WiFi networks. All wireless communications are a weakness in a secure system [Reference Arbaugh, Shankar, Wan and Kan10] and confining the EMW within a secure zone is the only protection which is 100% safe. A third reason to control EMW comes from the fact that the efficiency of a wireless communication decreases when its surrounding is too densely populated with wireless networks [Reference Eckhardt and Steenkiste11]. Physical separation of the networks would thus be beneficial.
Whatever the need for an EM shielding is, its practical realization on an industrial basis requires a reliable and low-cost production technique. Moreover, the final shielding product must be light and easy to implement in new constructions as well as in existing buildings. For such reasons, wallpaper on which FSS patterns are printed with a conductive ink is an interesting and attractive solution [Reference DeBarros, Eymin Petot Tourtellet, Piette, Lemaitre-Auger and Vuong12, Reference Sung13]. The printing process must, however, be compatible with the current industrial printing machines that are used for large-scale production, as, for example, offset printing, serigraphy, flexography, and heliography.
Unfortunately, it is more complicated to print electromagnetic conductive patterns than texts or pictures with classical inks. The development of the ink printing process is therefore an important and essential step toward an FSS wallpaper that needs to be well mastered. For that, several prototypes must be realized, each one needing to be tested. This is problematic because of the limited size of samples. Indeed, printing trials with real industrial machines are very costly, so a more realistic way is to produce the first prototypes with a semi-industrial pilot printing machine. But, often, the latter produces prototypes that are too small for an experimental characterization in free space [Reference Sung, Sowerby and Williamson5]. A previous study showed that the sample size must be greater than the biggest wavelength considered, which approximately corresponds to a paper size A4 at 2 GHz [Reference Parker, Robertson, Sanz-Izquierdo and Batchelor14]. The experience of the authors showed them that a size A3 is, however, preferable.
We thus report here on a very simple way to rapidly but partially characterize the electromagnetic response of spatial FSS filter prototypes with a limited size. We show here that it is possible to do measurements inside a rectangular waveguide and moreover that the results are a good indication of the fabrication quality process. For FSS patterns that have two axes of symmetry, the measurements inside a waveguide are identical to the ones that would be done in free space at a specific angle of incidence. For FSS patterns that do not have those two symmetries, direct comparison is no longer valid, but the comparison of the measurements with full-wave electromagnetic simulations is an assessment tool of the printing quality. The proposed technique is thus a complementary experimental investigation tool well adapted to preliminary measurements during a technological development process. Measurements are rapidly done, and the prototypes production costs are decreased, thanks to their limited size.
The combined use of FSS with waveguides is not a novel idea. In fact, it is a well-known technique to realize waveguide filter components [Reference Amjadi and Soleimani15–Reference Ohira, Deguchi, Tsuji and Shigesawa18]. In that case, the free-space response of FSS is not considered because the FSS and the waveguide are both considered as a single global structure during the filter synthesis procedure. Another combined use of FSS and of waveguide consists in modifying the guiding conditions by adding FSS to the waveguide walls. For example, quasi-transverse electro-magnetic (TEM) waveguides were obtained that way [Reference Cucini, Caiazzo, Bennati and Maci19]. However, few works reported in the literature directly focus on the possibility of characterizing inside a waveguide FSS which were originally designed for spatial filtering purposes. Nevertheless, Hannan and Balfour in 1963–1965 did a rigorous and detailed analysis of this phenomenon for a phased-array antenna [Reference Hannan and Balfour20, Reference Hannan, Meier and Balfour21]. They studied circular patches periodically spaced and showed that the response inside a rectangular waveguide is equal to the one in free space for precise incidence angles. They also extended this concept to triangular waveguides [Reference Balfour22]. Bielli et al. [Reference Bielli, Contu, Savini, Saitto and Tascone23] did some FSS characterizations in a waveguide to check the validity of the FSS model that they developed. Pearson et al. [Reference Pearson, Phillips, Mitchell and Patel24] proposed in 1996 to extend this concept to numerical simulations of FSS based on a finite-element modeling. More recently (in 2003), Mias [Reference Mias25] reported on tunable FSS with varactors that were characterized in free space and in a waveguide, but both measurements were not directly compared in his work. The aim of the present study is to show that the comparison of the measurements in a waveguide with numerical simulations is an easy and interesting tool to check the fabrication quality of FSS, weather or not they have x- and y-axis symmetries.
The physical principle of the measurement technique is explained and discussed in Section II. In Section III, the description of the measurements made and of the full-wave electromagnetic simulations performed are presented. Finally, in Section IV, the results obtained for the first three FSS-groups proposed by Munk [Reference Munk1] are presented and discussed. Results obtained for a non-symmetric FSS structure consisting of densely packed tripoles are also given. Finally, experimental characterizations of FSS with fabrication defects prove that this method is potentially adapted for fabrication quality assessments.
II. PHYSICAL PRINCIPAL
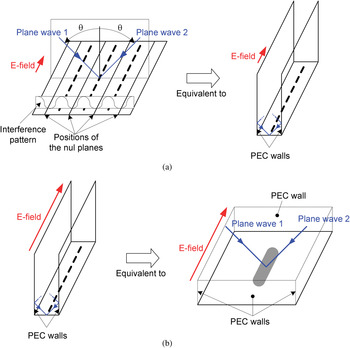
Like it was very well explained by Hannan and Balfour [Reference Hannan and Balfour20], even if spatial FSS are designed to work with plane waves, under certain conditions, their response when they are illuminated with the fundamental mode of a rectangular waveguide is identical to the one they would have in free space. Indeed, the fundamental guided mode of a rectangular waveguide can be exactly expressed as the sum of two TEM plane waves that have identical polarizations, amplitudes, and frequencies but with opposite angles of incidence [Reference Chu and Barrow26]. Now, let us consider two such plane waves in free space which are incident on an infinite and periodic structure, such as an FSS one. Interference of the two incident waves creates periodic null planes perpendicular to the incidence plane. For a specific incidence angle, the periodicity of those null planes is equal to the one of the periodic structure. Moreover, if the density of the periodic structure elements is high enough to avoid secondary lobes or reflection, the same null planes are present for the reflected fields, and they are located at the same positions as in the incident case. For electric fields that are oriented perpendicularly to the incidence plane, perfect electric conductor (PEC) walls can thus be placed at the positions of those null planes without any perturbation of the fields. In other words, there is no difference between a 2D infinite periodic structure illuminated with two incident plane waves that have opposite directions and a 1D infinite array bounded by two infinite PEC side walls illuminated by the same two plane waves that bounce between the side walls. This equivalence is illustrated in Fig. 1(a). Finally, if two other PEC walls are inserted perpendicularly to the two side walls at half-distance between two adjacent elements of the 1D structure, like shown in Fig. 1(b), the situation is still not modified. The electric fields are indeed perfectly perpendicular to the top and bottom PEC walls.
Schematic representation of the equivalence principles: (a) for the PEC side walls and (b) for the top and bottom PEC walls.

A possible and physical interpretation of the precedent discussion is that a rectangular waveguide exited with his fundamental mode forms two pairs of image planes in such a way that, for the reflective elements inside it, those image planes emulates an infinite periodic structure. Thus, FSS patterns that have two orthogonal axes of symmetry (x-axis and y-axis) can be characterized and simulated inside a waveguide. The incidence angle at which the characterization can be done is given by [Reference Chu and Barrow26]

where fc 10 is the cut-off frequency of the guided mode TE10, f is the frequency, μ and ɛ are the permeability and the permittivity of the dielectric contained inside the waveguide (air in the present case), and a is the largest inner dimension of the waveguide (conventionally its width).
If some FSS patterns do not possess the two orthogonal axes of symmetry mentioned above, their response inside a waveguide will be different than the one in free space and, therefore, both transmission curves can no longer be directly compared. Nevertheless, in that case, measurement inside a waveguide is still an interesting preliminary mean to assess the fabrication quality of the metallic parts of FSS. Indeed, like it will be seen in the next section, any deviation of the measurements from a full-wave electromagnetic simulation of the FSS inside a waveguide indicates a problem in the fabrication process. This can be due, for example, to an enlargement of the width of the conductive lines or to the presence of unwanted open circuits or short circuits.
III. EXPERIMENTAL SETUP AND SIMULATIONS
A) Experimental setup
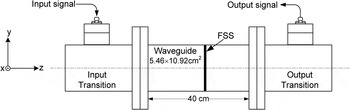
The experimental setup is illustrated in Fig. 2. It consists of a 40-cm-long straight-waveguide attached to two transition sections that adapt the fields from a coaxial cable to the rectangular waveguide and inversely. The straight waveguide and the two transitions are commercial products from the Vector Telecom company. The transverse inner dimensions of the waveguide are 5.46 × 10.92 cm2. With those dimensions, the waveguide is single mode (mode TE10) from 1.37 to 2.7 GHz. According to equation (1), the angle between the directions of the two plane waves that constitute the mode TE10 with the longitudinal direction is 36.64° at f = 2.3 GHz and 34.88° at f = 2.4 GHz.
Schematic view of the experimental setup.

The signal delivered from a vectorial network analyzer (VNA model 8720ES from Agilent) is coupled to the waveguide and crosses the FSS inside it. It is then coupled back to the vectorial analyzer, thanks to the output transition. The FSS is positioned at half-length of the straight-waveguide section. This ensures a mechanical stability of the latter during the measurements; the FSS are placed against a thick polystyrene substrate of permittivity close to 1 and with negligible losses.
The FSS samples are fabricated on a 0.8-mm-thick FR4 substrate. In the frequency range of 1.37–2.7 GHz (i.e. single-mode region of the waveguide), the relative permittivity and the loss coefficient of the substrate are considered invariant, and they worth: 4.3 and 0.025, respectively.
The calibration of the VNA is carried out in the following way. First, the calibration of the reflection of each coaxial cable is done with open, short, and matched loads. The positions of the reference planes are thus located at the end of the two coaxial cables. This is not problematic because phase information is not useful here. Second, the transmission calibration is done with the two coaxial cables connected to the empty straight waveguide.
After calibration, a transition is screwed off from the straight-waveguide section, and the FSS (with the polystyrene support) is inserted in the latter. The transition is screwed back and the measurement of the transmitted power is carried out. It worth noting here that in a preliminary experiment, the position of an FSS was varied along the straight waveguide. No noticeable differences in the transmitted power could be observed. This indicates that a good coupling exists between the coaxial cables and the transition and that there is no standing wave in the straight-waveguide section. This is important because, otherwise, longitudinal resonances would perturb the measurements. It also indicates that the evanescent modes that could be excited by the FSS decay very rapidly and thus, do carry a negligible amount of power in the experiments.
B) Full-wave electromagnetic simulations
The electromagnetic simulations were carried out with the commercial software CST Microwave Studio. The first type of simulations concerns the response of FSS cells inside the waveguide. The target working frequency is 2.4 GHz. The size of the different FSS considered here is ranging from approximately 35 to 50 mm. This is slightly lower than half of the inner dimensions of the waveguide. So, two cells of 5.46 × 5.46 cm2 are simulated inside the waveguide (each basic cell comprises one FSS pattern). The fundamental mode of the waveguide (TE10) is numerically excited by the input port. The walls of the waveguide are considered to be PECs. The software is configured to compute the power carried out by the first four evanescent modes. The transmitted power of each mode is calculated on the output port. No reflections are present on the ports so, like in the case of the experiment, the length of the waveguide and the position of the FSS have no influence on the guided power. For the evanescent modes, their decay is such that, for a distance of 5 cm between the FSS and the output port, their power is always at least 40 dB smaller than the minimum guided power over the whole frequency range. Thus, evanescent modes, even if they could be excited by the presence of the FSS inside the waveguide, do not play a significant role in the experiments.
The second type of simulations concerns infinite and periodic FSS illuminated with a plane wave. Here, only a single basic cell of dimension 5.46 × 5.46 cm2 is simulated with the periodic boundary conditions. The angles of incidence used are the ones corresponding to the ray model of a guided mode, as previously discussed in Section II (36.64° at f = 2.3 GHz and 34.88° at f = 2.4 GHz).
IV. Results
A) Structures with two orthogonal symmetries
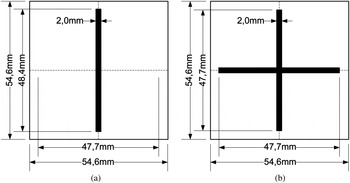
Some FSS structures that belong to the first group according to Munk's [Reference Munk1] classification and that also have the two axes of symmetry discussed in Section II were fabricated, simulated, and tested. Munk's FSS of the first group are patterns that are electrically connected in their center. In the present study, monopole and cross patterns were considered. They are illustrated in Fig. 3.
Design and dimensions of some FSS of the first group, which have symmetries along the x- and y-axis: (a) monopole FSS and (b) cross FSS.

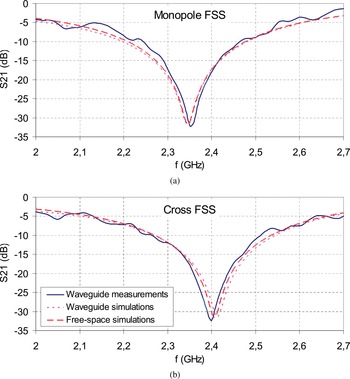
Simulations and experiment results are shown in Fig. 4. Like expected, for those two FSS patterns, the agreement between the simulations in free space with an incidence angle of 34.88°, the simulations inside the waveguide and the experimental measurements are in good agreement. The attenuation levels, the width of the band stop, and its central resonant frequency are almost identical. In the worst case (i.e. for the cross FSS pattern), differences of 13 MHz (0.5%) and of 0.95 dB are observed at the resonant frequency between the experimental data and the simulations. Those differences are caused by the fabrication tolerances.
Simulation results in free space (incidence angle of 34.87°), inside the waveguide, and experimental results for the first group FSS structures with two symmetry axes: (a) monopole FSS and (b) cross FSS.

The very small differences observed between the simulation results in free space and inside the waveguide are explained by the fact that, inside the waveguide, a frequency change causes a modification of the incidence angle. The latter is naturally directly taken into account during waveguide simulations but it is not taken into account when simulating the FSS in free space. In fact, a unique value corresponding to the incidence angle inside the waveguide at the resonant frequency of the FSS was used. However, all the simulations results (Figs 4, 6 and 7) show that a strict and exact comparison is not necessary.
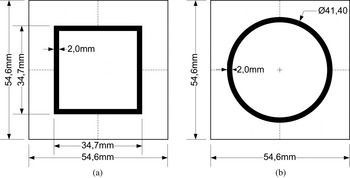
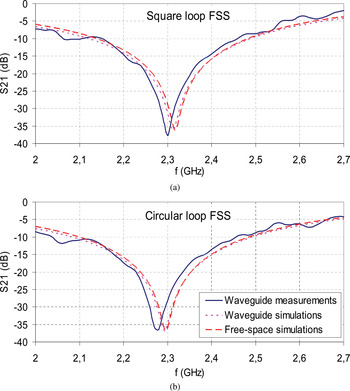
Some FSS of the second group (i.e. that form a loop) with the two required orthogonal axes of symmetry were also studied. More specifically, square and circular loops, both illustrated in Fig. 5, showed very good agreement between simulations and experimental results. They are shown in Fig. 6. Differences concerning the central resonant frequencies are: 17 MHz (0.74%) and 1.4 dB for the worst case, i.e. the square loop. Those differences are observed between the free-space simulation and the measurements inside the waveguide.
Design and dimensions of some FSS of the second group, which have symmetries along the x- and y-axis: (a) square loop and (b) circular loop.

Simulation results in free space, inside the waveguide, and experimental results for the second group of FSS with two axes of symmetry: (a) square loop and (b) circular loop.

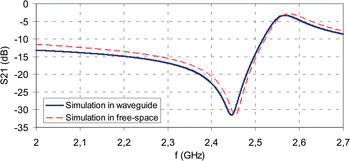
Finally, an example of FSS of the third group was also simulated. It consists of conductive square patches of 51.6 mm separated by a 3 mm gap. Once again, the transmission attenuation coefficients obtained in free space with a periodic structure or inside the waveguide with two elementary cells are in good agreement, like it is shown in Fig. 7.
Comparison of the simulation results in free space and inside the waveguide for the square patch which belong to the third group.

The results obtained confirm the idea of a waveguide simulator for some FSS of the first three groups as long as they have symmetries along x- and y-axis. FSS of the fourth group are a combination of the three preceding groups. It is thus expected that the concept of a waveguide simulator would also be extendable to that group as long as the symmetry condition is respected.
B) Densely packed tripole FSS
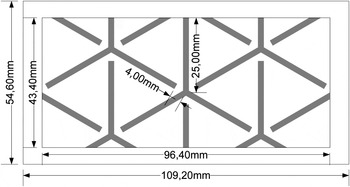
A more complex FSS structure that do not present the two symmetries discussed before was also studied. It is composed of densely packed tripoles that are made of three linear segments joined at one of their extremities and making an angle of 120° [Reference Pelton and Munk27] with each other. In its infinite version, such an FSS pattern is obtained by spatial translation of the tripoles in the same directions of the three linear segments of the initial tripole. As can be seen in Fig. 8, a tripole is thus directly surrounded by six other tripoles. The center-to-center distance between two adjacent tripoles is equal to the length of a linear segment plus a small additional gap, e. The great interest of such a structure is that its response is insensible to the incidence angle (between 0 and ±60°). That makes it a good candidate for spatial filtering. However, in contrast to the previous cases studied so far, this kind of FSS has three axis of symmetry separated by 60°. So, in the case of Fig. 8, only the symmetry with the y-axis remains pertinent.
Design and dimensions of the densely packed tripole FSS.

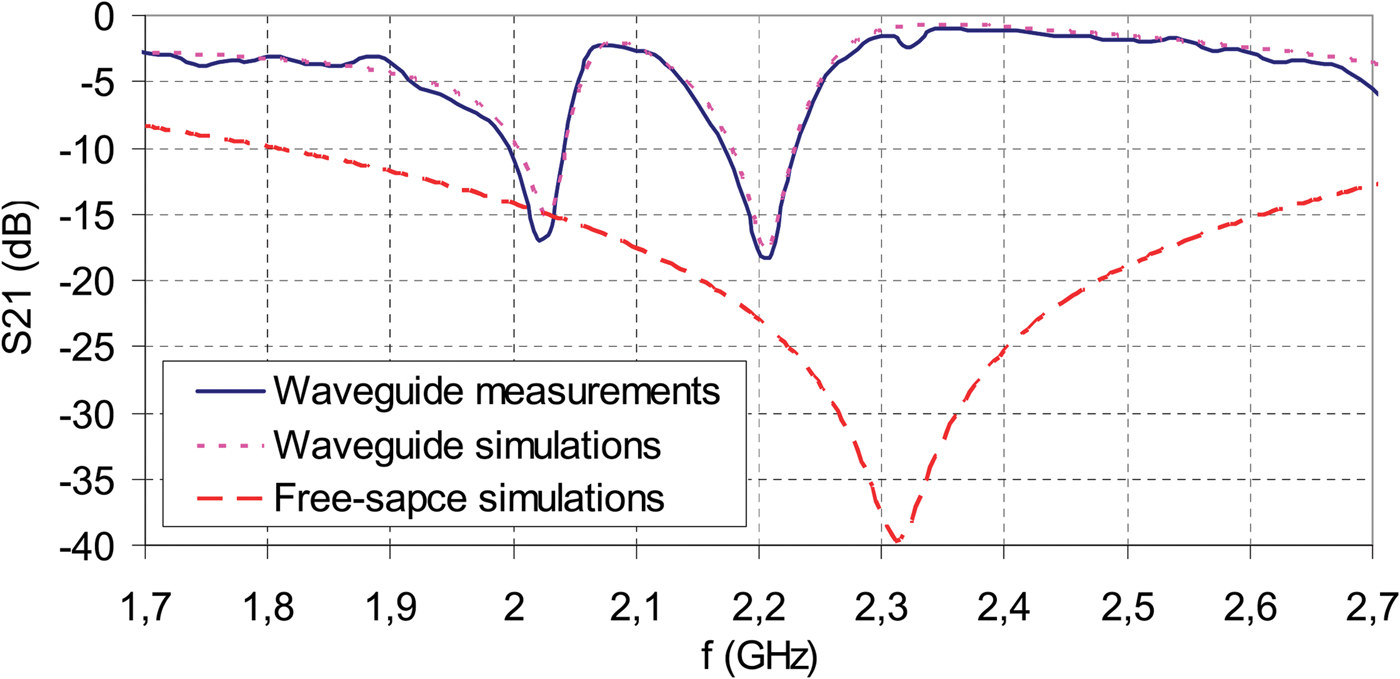
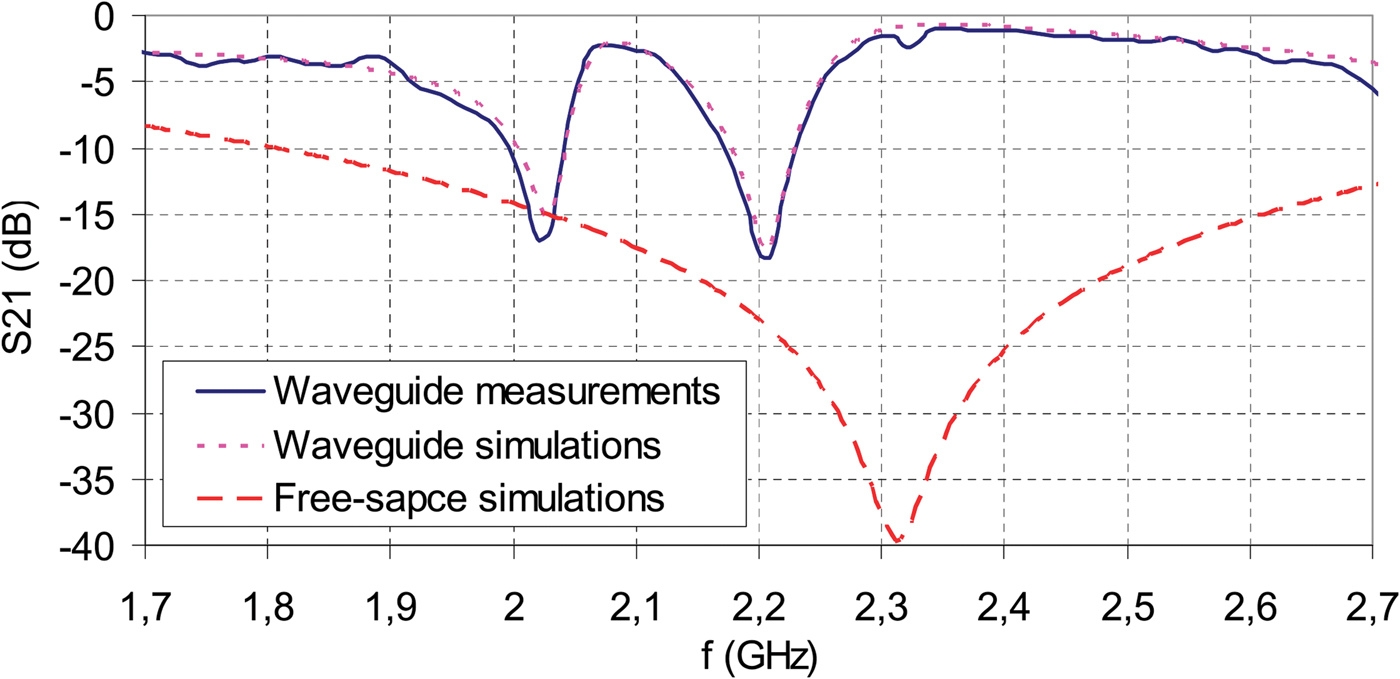
Nevertheless, to further explore the possibility of characterizing such a structure inside a waveguide, a densely packed tripole FSS was simulated in free space and inside the waveguide and its transmission attenuation in the latter was measured. The results are shown in Fig. 9. Like it was expected, the response in free space is totally different than the one inside the waveguide. Free-space FSS has a single stop-band region centered at 2.32 GHz while this FSS inside a waveguide has two rejection bands at 2.03 and 2.2 GHz. The maximum attenuation level is also changed from −40 dB to −17 and to −18 dB, respectively.
Simulation results in free space, inside the waveguide, and experimental results for the densely packed tripole FSS.
The differences observed are explained by several facts. A first obvious reason already mentioned is the absence of the second symmetry along the x-axis. A second reason is due to the mandatory presence of a gap between the end of the FSS pattern and the walls of the waveguide. Indeed, a densely packed pattern can no longer be represented by a unique unit cell and, whatever the limits are, conductive lines will always cross the chosen limits and be cut. Thus, to prevent short circuits with the walls of the waveguide, a gap is necessary. A third reason is caused by the limit-cutting procedure just described which will always result in the presence of incomplete conductive parts. Each of those causes new resonances that can be potentially visible in the frequency test region.
The weak attenuation levels in the case of the FSS in the waveguide are explained by the fact that only one complete tripole is present for the studied pattern. A different choice of the FSS-cell limits comprising two complete tripoles would have presented a more important attenuation level. Another reason is the presence of the gap between the FSS and the waveguide. This space has no blocking effect and energy is free to cross through it.
C) Waveguide simulator for the assessment of the fabrication quality
Figure 9 also shows an interesting fact: there is an excellent agreement between the simulation of non-symmetric FSS inside a waveguide and their measurement. Thus, a waveguide simulator could be a good and simple investigation tool for the assessment of the fabrication quality, like in the case of ink printing on a soft substrate. Indeed, any observed differences have to be put on the account of a problem during the fabrication or on different parameter values than the expected ones for the substrate.
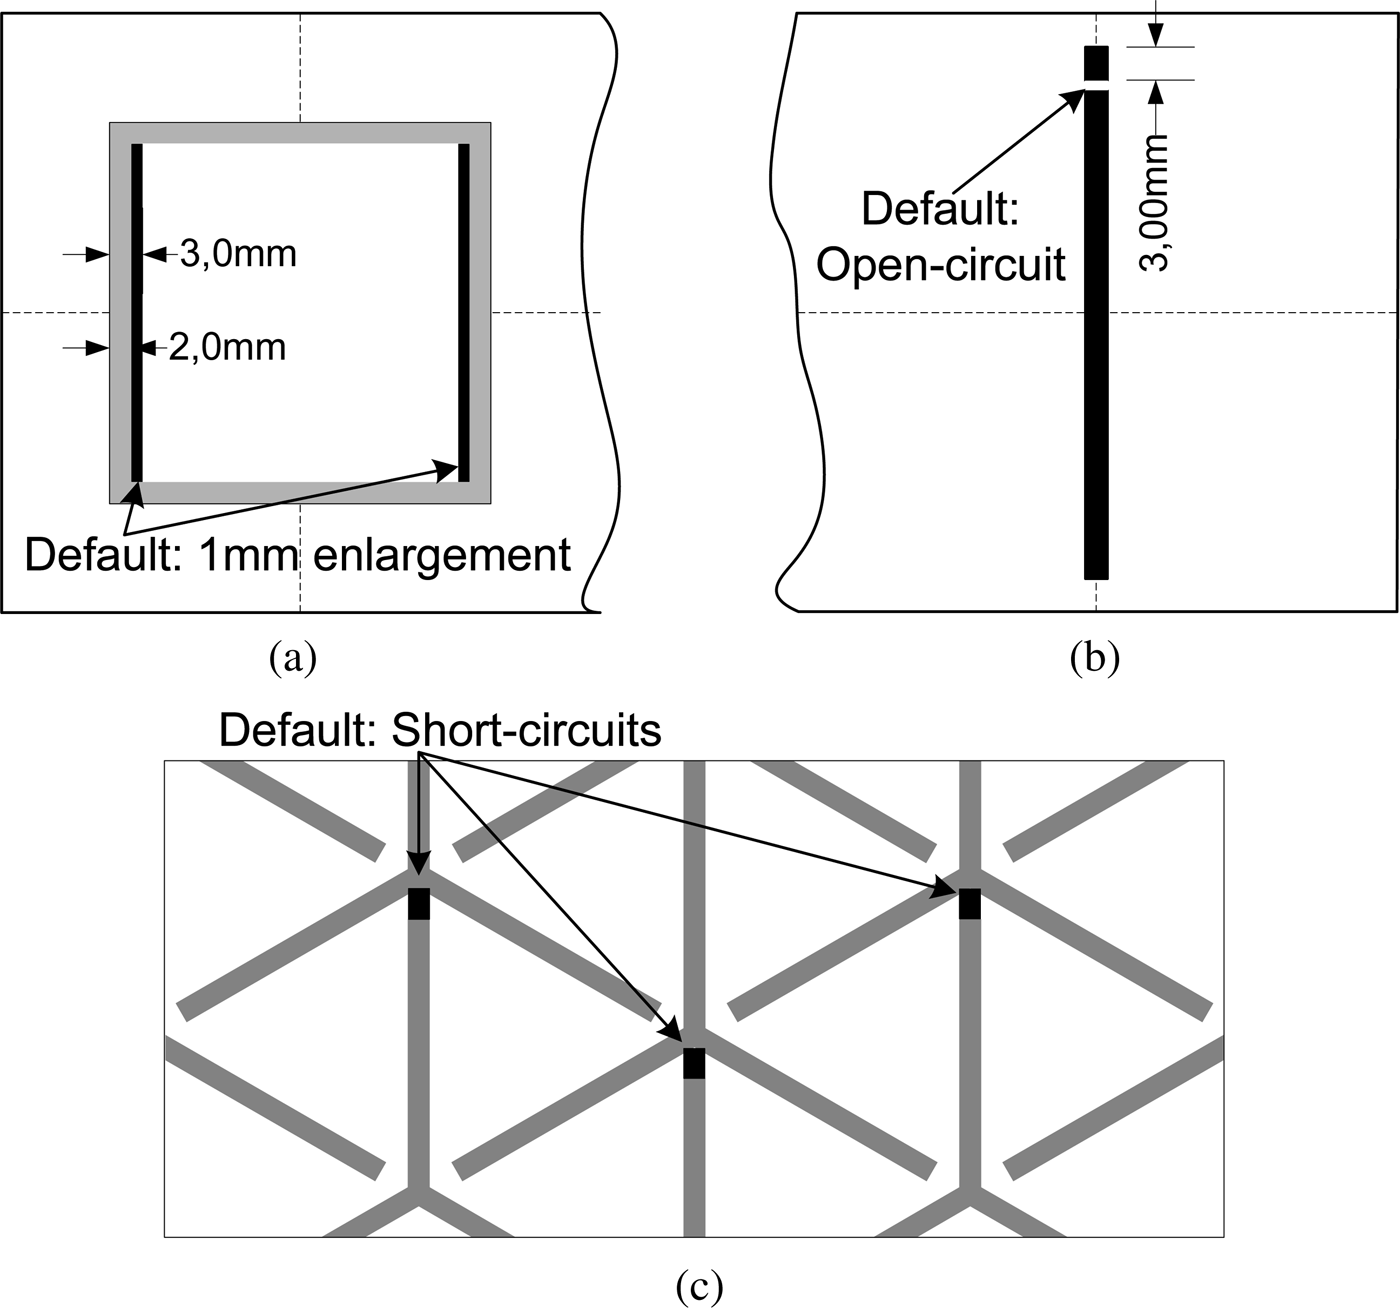
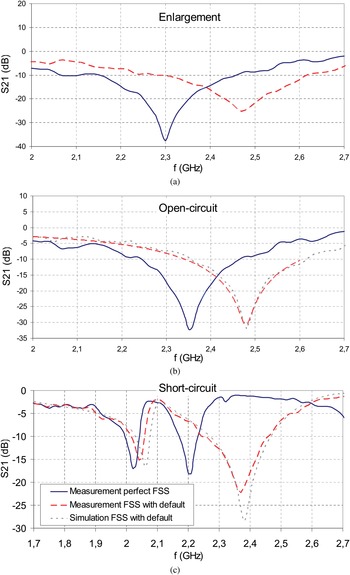
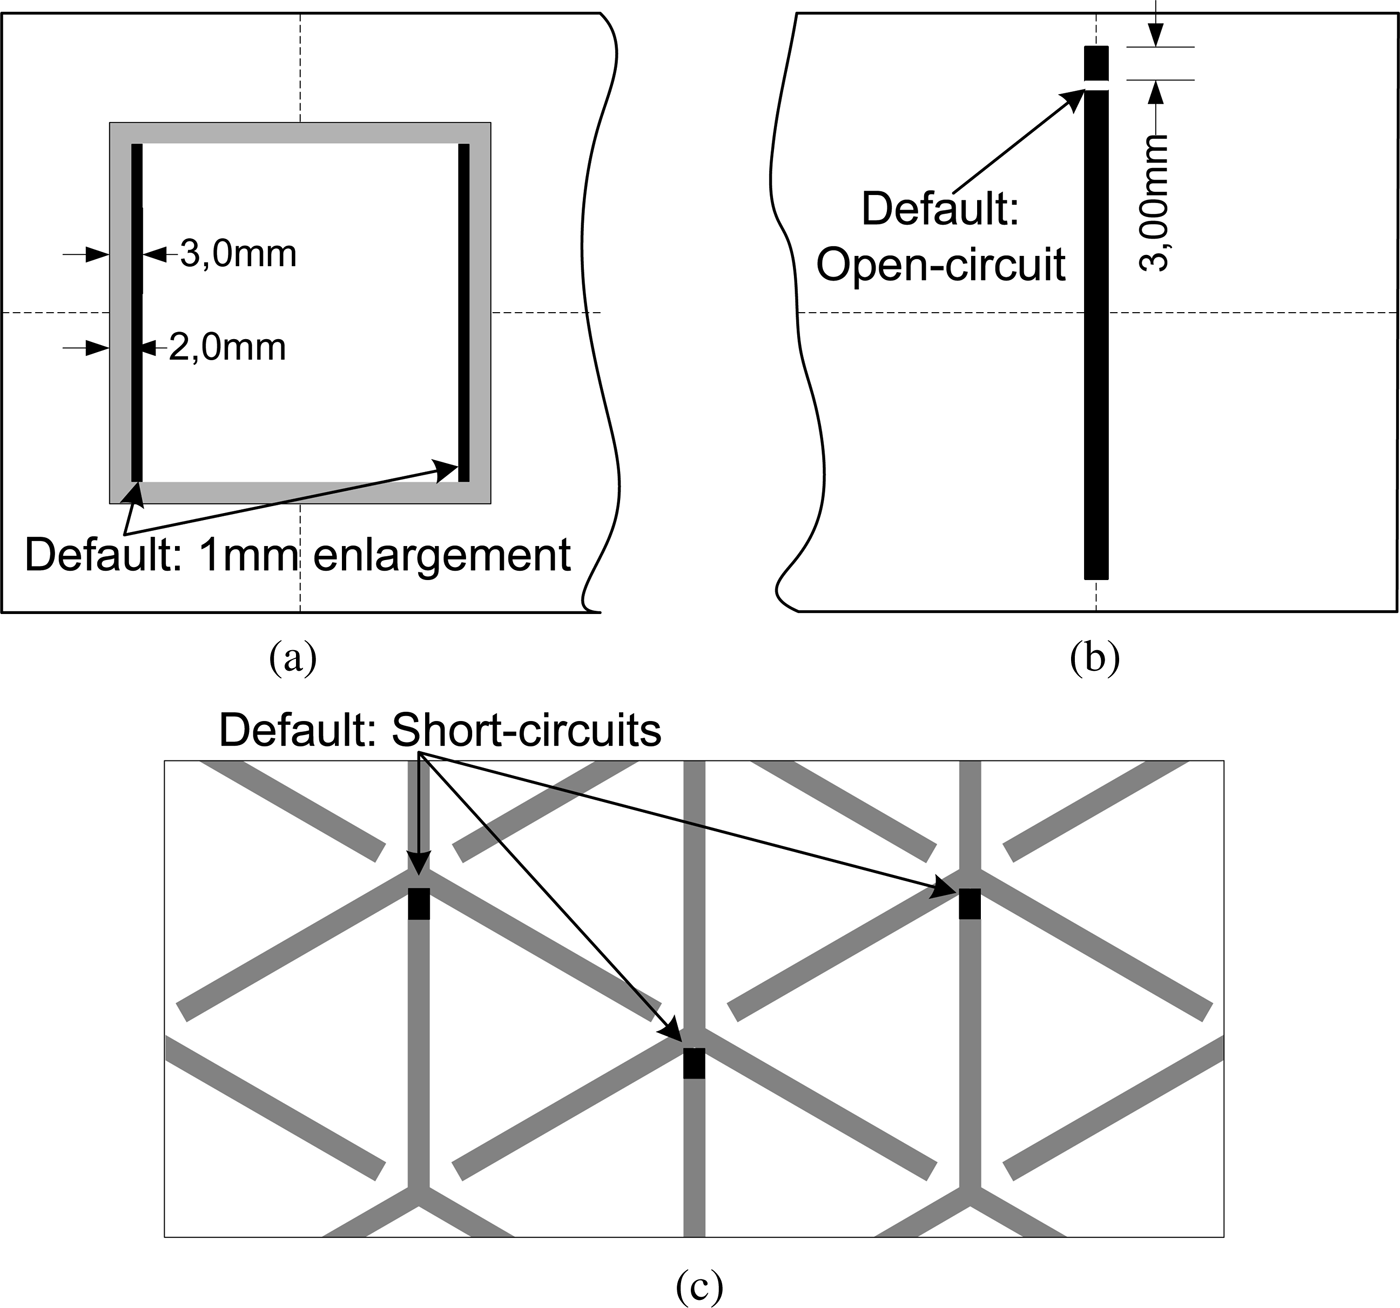
This was tested for three different cases: an enlargement of the FSS pattern, a small punctual absence of conductor (i.e. an open-circuit), and a punctual short circuit between two adjacent patterns. For a practical demonstration, all defects were created from some patterns already tested. More precisely, the width of the two vertical lines of the square loop was enlarged with a 1 mm aluminum conductive tape to create the first defect. A part of the conductive line of the monopole FSS type was mechanically removed to form the second defect. Finally, the third defect consisted in short circuits between two adjacent tripoles. This was done with the help of the aluminum conductive tape. The three defects are illustrated in Fig. 10. They represent real problems that can happen with ink printing. Measurement results and simulations are shown in Fig. 11.
Representation of three defects present on different FSS patterns: (a) enlargement of parts of the square FSS, (b) open circuit on a monopole FSS, and (c) short circuit on a densely packed tripole FSS.
Comparison of the measured transmission coefficients of a perfect structure with an imperfect one. Numerical simulation of the defect is also given: (a) enlargement of a part of the square FSS, (b) open circuit on a monopole FSS, and (c) short circuit on a densely packed tripole FSS.

Like expected, each of these defects creates a shift of the resonant frequency from which it can be detected qualitatively. For the first defect (Fig. 11(a)), a frequency shift and an attenuation decrease are observed. This latter fact can probably be explained by the fact that the electrical conductivity of the added aluminum is less than the one of copper. In the last case, the frequency shift is small for the first resonant frequency, but it is much more important for the second one. In all three cases considered, the main frequency shift is greater than 130 MHz (5.5%), which is more than the differences observed between simulations and measurements for perfect circular FSS (73 MHz; 2.8%). This technique thus seems adequate for the assessment of the fabrication quality of small samples. A more detailed study of its sensitivity would, however, be necessary.
D) Limitations and drawbacks of the waveguide characterization technique
The characterization of FSS structures inside a rectangular waveguide has however physical intrinsic limitations. First, like mentioned previously, only the FSS patterns that have x- and y-axis symmetries and that are perfectly contained in a unit cell can be characterized. The categories of FSS covered are thus reduced. Second, the frequency sweep is limited to the unimodal band of the waveguide. Third, according to equation (1), the angle of incidence of the fundamental guided-mode TE10 is a function of both the frequency and of the incidence angle. So, inside the waveguide, it is not possible to realize a frequency sweep at a fixed angle or to test several angles at a fixed frequency. Testing is always done in frequency and in angle at the same time. However, for several practical cases, the angle dependence can be omitted without introducing a too big error. In the present study, an incidence angle of 43.4° corresponds to the frequency of 2 GHz and 30.1° to 2.7 GHz. The total angle variation is 13.3° for which the response of the FSS is changing very slowly. Nevertheless, that fact may complicate the analysis of the in-guide experiments in some situations.
Other limitations not mentioned yet are to be considered. The plane wave incidence is limited to the H-plane (i.e. the xz plane in the present case) for single-mode waveguides. Oblique incidence is, however, possible with higher-order mode waveguides but for a simple analysis, only one mode should be excited at a time [Reference Hannan and Balfour20] which is not an easy task in practice. Finally, the inner dimensions of the waveguide must be an integer of the periodicity of the FSS. As the latter are fixed for the free-space application, most likely non-standard waveguides must be used. Moreover, for different unit cell dimensions, different waveguides must be used.
V. CONCLUSION
In this paper, the principle of a waveguide simulator for spatial FSS has been presented and explained. The physical principle relies on the fact that the electromagnetic field of two symmetric incident plane waves is equivalent to the TE10 guided mode of a rectangular waveguide and that the same equivalence exist between the reflected fields. The physical interpretation of this is that the walls of a waveguide play the role of mirrors with which the elementary cells inside the waveguide are duplicated. Thus, FSS patterns that have two orthogonal axes of symmetry can be characterized at a specific angle of incidence with few elementary cells. This assumption is confirmed by the good agreements that exist between all experimental results and the full-wave simulations presented.
This characterization technique can be an interesting investigation tool during the development process of new products based on spatial FSS (like an FSS wallpaper made with conductive ink printing), even if the FSS patterns are non-symmetric like it was shown. To fully know the potential of this technique, a detailed study of its sensitivity with respect to fabrication tolerances would have to be performed.
 Fabien De Barros received his engineering degree in electronics, informatics and automatic from the Grenoble Institute of Technology, in Valence, France, with a specialization in electronics of embedded systems. During the same year, 2008, he also obtained a master degree in optics and radiofrequency from the same university. Still with this university and with the Centre Technique du Papier, he has undertaken Ph.D. studies that will end in 2012. His research activity includes frequency-selective surface and their means of characterization, electromagnetic simulations, and industrial conductive printing technology and their means of characterization. He is using these technologies on a paper substrate to make new wallpapers that can filter electromagnetic waves selectively in indoor environments.
 Pierre Lemaître-Auger received the B.Ing. and the M.Sc.A. degrees from the École Polytechnique de Montréal, Canada, in 1992 and 1994, respectively, in physical engineering. He obtained his doctoral degree in optoelectronics and microwave from the Institut National Polytechnique de Grenoble, France in 1998. The same year, he became an associate professor at Esisar, an engineering school of Grenoble INP, France, where he directed the physical department for 8 years. He was the Director of Study of that school for 4 years. His first research topics were photonics applied to sensor applications. Since 2006, his new research interests are antennas and array antennas, frequency-selective surfaces, electromagnetic waves propagation, and localized waves. He is the author/co-author of more than 40 international publications. In 2010/2011, he is an invited professor at École Polytechnique de Montréal to work with professor Christophe Caloz on Bessel beams.
 Alysson Vasconcelos Gomes de Menezes was born in João Pessoa-PB, Brazil, on March 28, 1988. He is an electrical engineering undergraduate student at the Federal University of Campina Grande (UFCG). In 2009–2010, he participated to the BRAFITEC program, which is a student exchange program between Brazil and France, supported by the Brazilian government. From January until June, 2010, he was with the Laboratoire de Conception et d'Intégration des Systèmes (LCIS), in Valence, France, where he did research on waveguides and the characterization of frequency-selective surfaces. His interests comprise wind energy systems and telecommunications systems. Currently, he works on power electronics and control applied to wind energy systems.
 Romain Siragusa was born in Paris, France. He received his engineering and master (with honors) degrees in optical and radiofrequency from the Institut National Polytechnique de Grenoble (Grenoble-INP) in 2006. He received his doctoral degree from the Grenoble Institute of Technology in 2009. From September 2007 to March 2008, he was with Professor Caloz's group at Ecole Polytechnique de Montreal as a visiting Ph.D. student. In 2009–2010, he was a post-doctoral fellow at the Laboratoire de Conception et d'Intégration des Systèmes in Valence. Since 2010, he is research RF engineer at the Atomic Energy Commission (CEA) at Grenoble, France. His current scientific interests include high-impedance surface for antenna applications and focused phase-array antenna for RFID localization.
 Tân-Phu Vuong (senior member IEEE) was born in Vietnam. He received Ph.D. degree in Microwaves from Institut National Polytechnique (INP), Toulouse, France, in 1999 and HDR (Habilitation à Diriger des Recherches) degree in Microwave and Electronic from Institut Polytechnique de Grenoble (Grenoble INP), in 2007. From 2001 to 2008, he was an associate professor in microwave and wireless systems at Esisar, an engineering school of Grenoble INP. Since 2008, he has been working as a professor at Phelma another engineering school of Grenoble INP. His research interests include modeling of passive microwave and millimeter-wave integrated circuits. His current research interests include design of small antennas and printed antennas for mobile, RFID, and design of passive and active millimeter-wave components.
 Guy Eymin Petot Tourtollet is graduated in electrical engineering. From 2005, he is the Director of the Department: Sensors-Modelling and Data Treatment of the Centre Technique du Papier. With his pluri-disciplinary team, he is in charge of developing activities for measuring tools, modeling, data treatment and projects mixing ITCs, and the papermaking industry. Achievements: systems using optics, electronics, signal and image processing, software, mechanics, hydraulics, etc. From 2010, he is in charge of the new Strategic Priority Action devoted to printed electronic using ligno-cellulosique material.
 Glauco Fontgalland received the B.S. and the M.Sc. degrees in electrical engineering from Federal University of Paraíba, campus II, Brazil, in 1989 and 1993, respectively, and his Ph.D. from INPT/ENSEEIHT, France, in 1999, where his thesis work was nominated to Leopold Escande award. From 1994 to 2006, he was professor at CEFET-MA, Brazil. In 2003, he joined the Federal University of Campina Grande as associate professor. From January to March 2007, he was an invited professor at ESISAR/INPG, France. He was awarded a fellowship by the CNPq, Brazil, in 2007. He authored or co-authored more than 100 research articles. Since September 2010, he is a post-doctoral researcher at The Ohio State University – OSU, USA. His main research interests are electromagnetic modeling, antennas, EMC, and RF circuits. He is the leader of the LEMA research group, in CNPq.