Since at least Schattschneider's contention that “the political parties created democracy and … modern democracy is unthinkable save in terms of the political parties,” scholars have emphasized the essential role played by parties in making democracy work.Footnote 1 Acting as legislative coalitions, parties reduce the transaction and collective action costs that are endemic to mass democracy.Footnote 2 Observers of the modern Congress have argued that political parties provide an essential mechanism for holding legislators who represent disparate geographic districts collectively accountable for their behavior in office and the policies enacted by the government.Footnote 3
Despite scholarly consensus about the importance of political parties in modern democracies, there remain important questions about how legislative parties emerge in systems featuring candidate-centered elections and the conditions under which their influence can be sustained. Why do individual legislators, whose electoral fate is controlled only by voters who reside in their local districts, choose to tie their own hands by delegating power to national party leaders? Why do pivotal lawmakers, whose ideological preferences or other sources of influence give them the ability to make or break majority coalitions, sacrifice personal policy goals for the benefit of co-partisans?Footnote 4 And under what conditions can party elites push through—or perhaps thwart—policies against the wishes of their backbenchers? Although the literature on legislative parties has made tremendous advances over the past two decades, convincing answers to these vexing questions remain elusive.
Our study contributes to these debates by examining an unusual case of party-line voting—by delegates at California's 1878–79 constitutional convention. The coalitions present at the convention provide us with rare empirical leverage to examine what happens in the absence of conditions that the existing scholarly literature argues are necessary for coherent legislative parties to emerge. Surprisingly, we find evidence of strong party-line voting nevertheless, offering grounds to reassess whether existing theories of party government can indeed provide a satisfying explanation for the puzzlingly high degree of discipline and polarization observed in modern congressional and state legislative chambers.
Our findings appear to challenge two prominent theories of legislative discipline in the United States, a political context in which electoral rules and political institutions stack the deck against cohesive parties.Footnote 5 The first, proposed by Gary Cox and Mathew McCubbins, argues that legislators join parties and empower party leaders in order to further their personal electoral goals.Footnote 6 Because most voters cannot readily observe the quality or ideology of individual candidates, they use party labels as the cue for picking among competing choices.Footnote 7 This creates strong incentives for lawmakers to subordinate their personal interests in order to protect their party's “brand name,” the primary basis on which their elections will be decided.Footnote 8 In this account, the shadow of future elections and collective electoral accountability through the party brand provide the impetus for the emergence and maintenance of partisan legislative coalitions, with moderate members who may be hurt by a party's sweeping influence compensated through other, nonpolicy channels.Footnote 9
The second explanation, advanced by Keith Krehbiel, suggests that high levels of party unity observed in modern congresses are due simply to the shared policy goals of co-partisans.Footnote 10 In this account, the preferences of individual legislators drive their voting behaviors, and high levels of preference homogeneity between co-partisans results in voting coalitions that create the appearance of party discipline. Party unity thus emerges not from partisanship but from “preferenceship.”Footnote 11
These accounts point to different prerequisites—the high electoral value of the party brand name to individual legislators in the first, shared policy goals in the second—that give rise to and sustain high levels of legislative discipline. Disentangling these competing theories, and testing them empirically, is difficult in the modern context, however. Elections are part and parcel to nearly every prominent democratic legislative body. Most legislators possess both electoral and policy goals, and these two factors are often closely intertwined due to the electoral connection.Footnote 12 Even term-limited legislators often go on to pursue other careers in electoral politics after ending their current stints in office, providing few natural legislative contexts in which to study the dynamics of party emergence and maintenance in the absence of electoral calculations.Footnote 13 The final and perhaps most important limitation is that studies focusing on legislative behavior in the modern Congress and other legislatures cannot always directly address the dynamics of party emergence, development, and consolidation, because many of these processes occurred long ago in the U.S. context.
We overcome these hurdles by focusing our inquiry on California's 1878–79 constitutional convention. A number of previous scholars have examined coalitional dynamics at state constitutional conventions, repeatedly finding evidence of party-line voting on the convention floor and many other similarities between the behavior of delegates at such conventions and more typical legislative bodies.Footnote 14 The California case was, however, unusual in ways that make it an ideal empirical opportunity to study the processes of coalition formation. The convention was called unexpectedly at a time of political turmoil, forcing leaders of the state's two largest parties, the Democrats and Republicans, to temporarily join forces to create a new political coalition in an effort to prevent an insurgent third party from winning a majority at the convention. Due to differences in the nomination processes used to select candidates to run to become delegates, the election produced sharp policy conflicts and ideological divisions within the majority coalition, posing substantial challenges to sustained discipline at, and successful partisan control over, the convention.
Despite the temporary nature of the alliance, the absence of electorally useful “brand names,” and the presence of conflicting legislator interests and preferences, our analysis of the delegate voting behavior at the convention documents that leaders of this “Nonpartisan” coalition succeeded in retaining their narrow and divided majority, eliciting levels of party discipline exceeding those found in state legislatures in this era and adopting a new constitution despite the active resistance of opponents. (The term “Nonpartisan” refers to the proper name of one of the two major coalitions at the convention; it is not meant to imply an absence of partisanship among its members. In fact, as we argue throughout this article, the Nonpartisans act very much like an organized political party.) Moreover, this newfound alliance proved to be short-lived, a reality that we argue was likely known to members of the coalition during the convention. Democratic and Republican elites resumed their previous partisan battles in state government after the convention, just as they had done in the years before. By comparing legislative voting in the sessions immediately before and after the convention to delegate behavior on the convention floor, we show that high levels of discipline and cohesion among legislators can be sustained even in the absence of linked electoral fates or shared preferences by elites armed with the advantages and powers offered by their leadership positions. In focusing on the importance of top-down leadership, our California case thus most closely resembles theoretical accounts that highlight the formal and informal sources of influence used by party leaders to maintain party discipline.Footnote 15 In contrast to most such accounts (e.g., the theory of “conditional party government”), which emphasize within-party homogeneity and between-party heterogeneity as necessary conditions for delegation of power to party leaders, we show that strong and effective leaders can emerge even in the absence of clearly shared policy goals among their backbenchers.
Our analysis combines a close reading of historical and archival records with a quantitative analysis of decisions made by delegates at the convention. We begin by laying out the historical and political context that resulted in a constitutional crisis in the late nineteenth century in California and prompted efforts to rewrite the state's founding charter. This section also describes the complicated political dynamics that shaped the selection of delegates to the constitutional convention. Next, we marshal evidence from a variety of historical sources to make the case that delegates elected on the Nonpartisan slate arrived at the convention with neither shared electoral goals nor a common policy agenda, setting the stage for our empirical analysis of voting behavior at the convention. The analysis combines information about the slates on which delegates were elected to the convention, their previous political affiliations, and other biographical information with data on individual votes taken on the convention floor. The analysis allows us to document the levels of partisan discipline at the convention and compares the importance of shared partisanship to other delegate- and constituent-level determinants of individual delegate voting behavior. We conclude with case studies of two key issues—property taxation and railroad regulation—that were widely expected to split the majority coalition at the convention. Yet, despite clearly conflicting views among delegates on these questions, we document that partisanship trumped preferences on key votes related to these issues.
POPULAR DISCONTENT AND THE IMPETUS FOR CONSTITUTIONAL REFORM
In the 1870s, sweeping social and economic changes created growing political turmoil in California, setting the stage for constitutional reform. Between 1849, when the state adopted its first constitution, and 1879, when the constitutional convention completed work on its second, the population of California increased almost ninefold. Growth was accompanied by dramatic economic transformation. Agriculture and manufacturing displaced mining as the state's leading industries, and large corporations increasingly dominated all manner of commerce.Footnote 16 Small-scale farmers struggled under the burdens of debt, prohibitive fares set by the Central Pacific Railroad monopoly, an underdeveloped irrigation system, and an inequitable system of state taxation. While small property owners bore the primary burden of financing state and local government, other interests such as railroads, corporations, banks, and wealthy merchants largely escaped taxation.Footnote 17 All of these issues attracted significant attention and legislative activity, but state lawmakers proved incapable of finding solutions that adequately addressed constituent concerns while overcoming the opposition of entrenched interest groups—in particular, the railroads and San Francisco–based corporate interests.
This period was also characterized by active and evenly balanced competition between the state's Republican and Democratic parties. There were, however, large segments of legislators from both parties that remained under the influence of the railroad monopoly and corporate interests. This limited state government responsiveness to popular demands for reform of public finances and increased regulation of the business sector. As a result, growing discontent gave rise to formidable political activity on the part of the state's farmers, organized around existing farmers’ clubs and the Granger movement. In 1873, the farmer vote helped an independent party win control of the legislature. Two years later, however, the party was voted out of power without enacting many of its promised reforms.
Largely in response to mass disaffection with state government, the legislature put to public vote proposals to hold a constitutional convention to rewrite the state's founding charter on four separate occasions. The first three attempts failed. Although more voters supported a convention than the number voicing opposition in the 1873 election, a large fraction of the electorate simply left the question blank, depriving the measure of the absolute majority of ballots cast that was required to call a convention.Footnote 18 Not until September 1877 did a sufficient number of voters finally give their backing to a constitutional convention.
Rise of the Workingmen's Party
The economic Panic of 1873 only exacerbated brewing political grievances. The deep recession triggered bank runs, business failures, foreclosures, and record unemployment in various parts of the state. In 1875, the collapse of the Bank of California led to industry-wide investigations that uncovered misuses of funds and other poor business practices. A newly appointed bank commission launched investigations into other banking institutions, triggering more bank failures between 1875 and 1880.Footnote 19
The pain of the recession was felt particularly acutely in urban San Francisco, where nearly a third of all Californians lived. In the fall of 1877, groups of unemployed men began meeting in vacant “sand lots” as part of a growing movement organized by Dennis Kearney, a 31-year-old Irishman. A skilled orator, Kearney worked to channel mass discontent into political action. Led by Kearney, the self-styled “Workingmen” demanded city jobs, an aggressive system of taxation to expropriate the wealth of the rich, an end to land monopoly, and the expulsion of Chinese workers, whom they blamed for driving down salaries and wages.Footnote 20 By October of 1877, the Workingmen began to hold nightly meetings to form ward organizations and, on occasion, carry out vicious attacks against the Chinese. Such anti-Chinese sentiment was not new to California and indeed had been a source of political debate since the 1850s.Footnote 21 In addition to fueling such early acts of bigotry and violence, perceived economic competition with Chinese workers also laid the groundwork for the passage of the national Chinese Exclusion Act of 1882 and played a central role in the early labor movement in America.Footnote 22
In late October, approximately 3,000 Workingmen attended at a meeting organized in Nob Hill, an exclusive neighborhood of San Francisco where the directors of the Central Pacific Railroad company were thought to live. According to historian Winfield Davis, “speeches of a very inflammatory nature were made.”Footnote 23 The city's leading citizens came together to form a vigilante “committee of safety” to prepare for the growing threat, and the Workingmen began to organize military companies in response, setting the stage for violent conflict.Footnote 24
By early 1878, the growing organization of the Workingmen translated into mounting political victories. Historical observers credit Kearney, the group's vocal leader, with the shifting the focus of the movement from violence toward politics.Footnote 25 Candidates backed by Kearney won special elections to fill legislative vacancies in Alameda and Santa Clara Counties in Northern California. In March, Workingmen won the mayoral contests in Sacramento and Oakland. At the first state convention of the new Workingmen's Party, the delegates pledged their support to Kearney, by now elected the party's president, and set their sights on winning a majority of seats at the upcoming constitutional convention.
Coordination over Delegate Selection
Leaders of the state Democratic and Republican parties understood early on the threat posed by the increasingly effective Workingmen's movement and realized that a Workingmen majority at the convention would elect Kearney as its presiding officer, with disastrous consequences—particularly for the state's corporate interests. In an attempt to preempt this, in January 1878, the legislature passed a law authorizing the San Francisco Board of Supervisors, the county legislative body, to hire men to work on public infrastructure projects to provide some relief to the jobless and limit the political appeal of the new party's radical platform.Footnote 26 This did little to satisfy the Workingmen's demands.
In the legislature, leaders of the established parties also worked to stack the method for electing convention delegates to limit the electoral success of Kearney and his allies. The original bill called for the election of 120 delegates using existing state senatorial district boundaries. However, the final legislation included an additional thirty-two delegates to be elected at-large statewide, eight from each congressional district, a change designed to dilute the Workingmen's Party vote, which was concentrated in urban centers. The state's partisan press also urged the two parties to nominate a “fusion” slate, fearing that, in the absence of an alliance, Democratic and Republican voters would end up splitting their support at the polls and thus allow the Workingmen to exploit the winner-take-all nature of elections and secure a majority of convention delegates by receiving a mere plurality of votes cast in many districts.
The leaders of the two parties ultimately held a joint statewide convention to nominate a combined slate for the at-large seats, dominated by merchants and other moneyed elites who most feared Kearny's growing political clout. However, delegates for the district seats were nominated separately, through a series of local conventions subject to much weaker influence by state party leaders. Outside of San Francisco, these conventions resulted in nominations for a broader range of interests:
It was property representation, but for the most part it was farm property, as contrasted with corporation property [represented by the at-large slate], the ownership of which tended to concentrate in San Francisco. In the rural communities in the small towns which were dependent upon the farming districts for their prosperity the granger group took a prominent part in the selection of delegates and the drafting of instructions.Footnote 27
Indeed, in many areas, fusion conventions pledged their support for overhauling the tax system, equalizing assessments, and land reforms—policies strongly backed by the Workingmen. In rural Butte County, for example, the “Citizens’ Non-Partisan Convention” adopted a resolution that explicitly instructed its nominees to support measures to curb Chinese immigration and the taxation of mortgages, language that could have appeared on any Workingmen platform.Footnote 28 In nearby El Dorado County, a bipartisan “People's Convention” similarly resolved: “That it is the sense of this Convention that the Constitution of this state should be so amended that all classes of property, including bonds, mortgages, and other evidence of indebtedness, should be taxed at their value.”Footnote 29
Although running on the fusion Nonpartisan slate, many of the delegates nominated in local conventions were thus, on policy grounds, ideologically closer to the Workingmen on key questions to be addressed by the convention than San Francisco's moneyed elite.Footnote 30 Unlike the at-large candidates, who were hand-picked by state party leaders, those nominated in local conventions had little inherent motivation to preserve the Democratic and Republican duopoly over state government or protect the established parties from the growing threat posed by the Workingmen's movement. Some also echoed the anti-Chinese rhetoric of the Workingmen's Party. Had it not been for the Kearneyites’ troubling attacks on private property rights, many of these delegates could have easily built common ground with the Workingmen on a broad range of constitutional reforms.Footnote 31
The Workingmen's Party, itself made up of former Democrats and Republicans, generally succeeded in nominating a united ticket, although its members too began showing internal rifts. In early May 1878, the Workingmen's Party state committee voted to expel Kearney, accusing him of corruption. As a result, two competing Workingmen conventions were called in San Francisco on the same day to nominate delegates to the constitutional convention.Footnote 32 Most county organizations, however, pledged to support Kearney and attended the Kearney-run convention.
On Election Day in June, California voters elected the entire thirty-two-delegate Nonpartisan at-large slate. Combined with a number of district victories, the Nonpartisans won seventy-nine seats overall, sufficient to form a small majority at the 152-delegate convention. Most of the candidates elected at-large were lawyers and merchants, although farmers won a substantial number of district seats. The Workingmen's Party won a total of fifty seats, representing the second largest delegate block. The remaining seats were largely split among delegates elected on separate Republican and Democratic tickets.
NEITHER PREFERENCES NOR PARTY BRAND
Our key contention is that delegates elected to the convention shared neither linked electoral fates nor, at least within the Nonpartisan majority, common overarching policy objectives or a desire to protect the existing two-party system from the insurgent Workingmen's Party. Despite their collective electoral victory, delegates from the Nonpartisan slate confronted strong centrifugal forces that continuously threatened to divide their coalition and thus deprive it of its small majority at the convention. Keeping delegates elected from agricultural areas, where large numbers of constituents supported many of the proposed Workingmen reforms to regulate railroads and force corporations to pay their fair share of taxes,Footnote 33 within the Nonpartisan fold posed a serious challenge for the slate's leaders.
Although it is difficult to establish either element of this claim with complete certainty, a number of historical sources from this period provide strong circumstantial evidence to support our argument. First, there was little evidence that delegates expected their nascent coalition to survive beyond the convention, an essential necessity for building a partisan “brand name.” Although elected on a joint slate, many Nonpartisan delegates offered no indication that they had forsworn their previous partisan loyalties. Indeed, a compilation of short biographies based on interviews with the delegates, published shortly before the convention, emphasized their previous partisan affiliations.
In introducing Rush McComas, for example, a Virginia-born farmer who had served in the California legislature in the session immediately prior the convention before being elected on the Nonpartisan ticket, the biographers wrote: “In politics, Mr. McComas was a Democrat before the [Civil] war, but radically changing his opinions then, he became a Republican, and expects to live and die one.”Footnote 34 Turning to a prominent Democrat elected as a Nonpartisan, Pleasant Tully, one of California's foremost criminal attorneys of this era, they noted: “In politics, Mr. Tully is and has been a consistent, life-long Democrat, the crew pulling in the same boat being a very small one, desertion having considerably thinned the ranks. He was elected on the Nonpartisan ticket, with a handsome majority of about four thousand, this majority showing how exceedingly popular a man he is.”Footnote 35
A number of other delegates expressed similar sentiment. To describe David Hunter Cowden, a prominent judge, the biographers wrote that, “In politics, Judge Cowden is a Republican, having been elected to this Convention on the Nonpartisan ticket, because of his staunchness in the support of right, his sturdiness in opposition to wrong, and because his ability and stability of character have gained him many warm friends, irrespective of party.”Footnote 36
Although most Workingmen expressed fewer fealties to their former co-partisans, some suggested that their membership in the new party was also likely to be temporary. These beliefs proved to be prescient. Shortly after the end of the convention, the Workingmen's Party collapsed, and many of its members rejoined the two major parties. For example, William F. White, a prominent Workingmen's Party member, again became a Democrat and quickly rose to a position of authority in the party organization.Footnote 37 One delegate, a miner named James Edward Dean, emphasized the temporary nature of his allegiance to the nascent Workingmen organization:
In politics, Mr. Dean is known among his friends as the “Wooly-Horse Republican,” having cast his first vote for Fremont [in the 1856 presidential election]. He has always been unwavering in his Republican principles, and his election on the Workingmen's ticket only goes to show that he is held to be free from bias on the great questions now agitating those who distinctively—and perhaps, unnecessarily—call themselves the laboring classes. Mr. Dean is of personally excellent qualifications and a gentleman of refinement.Footnote 38
The only consensus among Nonpartisan delegates appeared to be in their desire to prevent the Workingmen's Party from winning a majority of seats and subsequently electing Kearney as the president of the convention. There was much less agreement about what constitutional reforms to effect on the convention floor, a reality that complicated the coalition's efforts to craft a joint electoral platform. As Carl Brent Swisher would later summarize:
As for preparing a platform, the non-partisans were already in a precarious position, for in their declarations they had at once to appeal to the conservative capitalists of the state, and to the small farmers who hated the land monopolists, and who were in positions of economic subservience to the capitalists in some form or other, and who for this or other reasons were hostile to capitalists and to corporations. It was hard for a candidate to make a positive declaration of any kind that did not promise to make as many enemies as friends. The candidates from capitalist centers where the land problem was not particularly acute felt safe attacking land monopoly in a general way, but for the most part critical issues of this kind were avoided by the non-partisans, and voters were left to speculate on the enthusiasm with which candidates, if elected, would carry out the mandates of the local district conventions.Footnote 39
Workingmen's Party leaders were clearly cognizant of the natural divisions within the Nonpartisan camp and the possibility of a divide-and-conquer strategy. According to Swisher: “Although [the Workingmen] had not a majority of the membership of the convention they believed that they might take advantage of the lack of organization and unanimity of purpose on the part of the other two-thirds, and so control the action of the convention.”Footnote 40 Throughout the summer, Workingmen delegates caucused weekly as they made plans to organize the convention and elect its officers from their own ranks.
Initially, the Nonpartisans failed to match the organizational acumen of the Workingmen. No caucus was held prior to the start of the convention in September, although Nonpartisan leaders quickly moved to adjourn on the first day of deliberations to organize their forces. On the first evening of the convention, Nonpartisans called a joint caucus of their members and of delegates elected on the separate Democratic and Republican slates. In the early days of the convention, the Nonpartisans would regularly adjourn the proceedings for the purpose calling a caucus when the group appeared divided over nominations to key leadership positions at the convention.
These caucuses may have proved essential to building consensus within the diverse coalition. Nonpartisans successfully elected conservative members to almost every key convention leadership post, and they succeeded in appointing like-minded people to replace delegates who were ruled ineligible to serve or died prior to the start of the convention. Perhaps the group's greatest coup was the election of Joseph Hoge, a corporate lawyer who previously served as a Democratic congressman from Illinois, as president of the convention. Hoge's nomination prevailed with only one vote to spare. Indeed, the Workingmen successfully defeated candidates backed by the conservative leadership of the Nonpartisan delegation only once, for the post of secretary, when they joined forces with rural delegates and shifted their support to back a moderate Nonpartisan candidate against the slate leaders’ preferred choice. The nascent cross-party alliance on the secretary vote, however, did not prove to be a lasting one.
According to Swisher's exhaustive account of the deliberations, early victories in the selection of key convention officers gave the conservative faction within the Nonpartisan camp additional opportunities to influence the organization of the convention and shape the charter that it eventually produced. For example, in the convention's early days, President Hoge appointed a Committee on Rules and the Order of Business to draft further recommendations for organizing of the convention. Of the fifteen delegates appointed to serve on this key committee, twelve were elected on the Nonpartisan slate. The committee recommended the division of the convention into thirty-one substantive committees to draft specific sections of the new charter. “The chairman of the important committees,” Swisher noted, “were chosen from among Nonpartisans who were loyal to the organization, and memberships were so arranged that there was no danger of extreme insurgent control.”Footnote 41
Committee rosters printed in an anthology of delegate biographies indicate that Nonpartisan delegates controlled an outright majority of seats in seventeen of these committees, compared to just two committees with a Workingmen majority.Footnote 42 Following a strategy used frequently in the modern legislatures, the Nonpartisans also “stacked” the membership of key committees, giving a disproportionate number of seats on these bodies to loyal co-partisans.Footnote 43 On the Revision and Adjustment Committee, for example, Nonpartisan delegates were appointed to fill every single seat. Although the Workingmen's Party drew strong support from urban areas and its members were most likely to represent the incorporated cities, Workingmen delegates were appointed to fill only 7 percent of the seats on the City, County and Township Organizations Committee, compared to 73 percent of the seats that went to Nonpartisans. Control over the policy committees proved to be important, because most of the substantive sections of new constitution were drafted by these committees before consideration by the full convention.
EVIDENCE OF PARTISAN DISCIPLINE AND CONTROL
In this section, we consider the extent to which the leaders of the Nonpartisan slate succeeded in using such strategies—informal caucuses, appointments of loyal allies to substantive policy committees, and control over the proposals that would emerge from the committees for consideration on the floorFootnote 44 —to unite their disparate delegation. We focus our discussion on the quantitative analysis of three sets of roll call votes, nearly 1,000 votes from the 1877 and 1880 legislative sessions of the California General Assembly—the legislature did not meet during the convention, and these two sessions bookend the convention proceedings—and approximately 290 roll call votes taken by the delegates during the course of the convention.Footnote 45 In the next section, we provide a more detailed account of convention deliberations on questions of tax reform, corporate regulation, and railroad monopolies, topics that attracted the greatest amount of debate among the delegates, clearly divided the Nonpartisan delegation, and also featured prominently on the legislative agenda in the years before and after the convention. In each case, we show, the conservative leaders of the coalition succeeded in putting forward provisions that retained the support of their rural colleagues without making many substantive policy concessions.
In our account, we describe the Nonpartisan caucus as a legislative party, in the standard sense of the term. Alternatively, however, one might view these delegates as a coalition, made up of two constituent parties and organized for the purpose of forming a governing majority, as is often found in parliamentary democracies.Footnote 46 We do not think the latter view is accurate in terms of describing the coalitional dynamics at the California convention, however. First, most parliamentary coalitions are composed of existing parties. In our case, however, the new coalitions were organized almost orthogonal to existing partisan divides—Republicans and Democrats made up the majority in both the Nonpartisan and Workingmen's Party slates. According to delegate biographies, the Nonpartisan–Workingmen cleavage that dominated the convention proceedings cut across existing partisan loyalties. Overall, the Nonpartisan delegation was divided exactly in half between former Democrats and Republicans. Importantly, this was also true among Workingmen, with former Republicans accounting for 45 percent of the slate, compared to 41 percent for Democrats. The remaining 14 percent of the Workingmen did not have previous partisan affiliations or were affiliated with smaller, third-party groups.Footnote 47 Thus, while Democratic and Republican state party leaders were instrumental in putting together the at-large Nonpartisan slate, both coalitions drew heavily from prominent Democratic and Republican communities around the state.
Second, legislative discipline in parliamentary coalition is usually explained by party leaders’ centralized control over the nomination process or the threat of government dissolution.Footnote 48 Neither explanation applies to our case, still leaving the puzzle of why the Democratic and Republican backbenchers who made up the Nonpartisan majority cooperated with their slate's leaders, especially on questions that clearly divided the coalition. We cannot provide a completely satisfying answer to this question, although we do consider some possibilities in the concluding section.
Our initial examination of coalitional dynamics focuses on party unity votes—cases in which the majority of one party votes against the majority of the other. Table 1 reports the rate of party unity voting along traditional Democrat-Republican lines. In the legislative session immediately preceding the convention, nearly 34 percent of all votes taken by representatives in the California General Assembly pit a majority of Democrats against a majority of Republicans. On these party unity votes, Republicans voted with their co-partisans 73 percent of the time on average and Democrats about 61 percent of the time. In the 1880–81 session, which took place immediately after the convention, more than 32 percent of votes divided the parties, with even higher rates of party support on unity votes (about 75 percent for both Democrats and Republicans). The rates of party voting immediately before and after the convention correspond to impressive levels of partisan polarization and discipline. To put these numbers in context, approximately 50 percent of votes taken in the United States House of Representatives between 2001 and 2010—a period of historically high partisan polarization—were party unity votes, pitting the majority of one party against the majority of the other.Footnote 49
Party Discipline

As Table 1 demonstrates, however, voting behavior at the convention did not follow the same pattern. Fewer than 25 percent of the votes divided the Democrats and Republicans, even though the delegates tackled many of the same issues considered by the legislature in earlier years, a rate of party unity voting that is lower than in nearly every session in the history of the U.S. House. On these few party unity votes, Democrats and Republicans voted with their party only slightly more than half of the time, on average. Clearly, the constitutional convention represented an important break in partisan legislative dynamics—albeit a temporary one, since the traditional partisan divisions reemerged immediately after the work of the convention concluded.
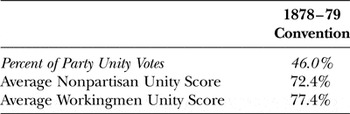
The effective disappearance of the Democratic–Republican cleavage at the convention did not represent the absence of partisan discipline and cohesion; rather party voting at the convention fell along the new Nonpartisan–Workingmen divide. Exactly 46 percent of the roll call votes taken at the convention pit a majority of Nonpartisan delegates against a majority of the Workingmen (see Table 2), a level of party cohesion identical to the one seen in the 111th Congress (2009–2010) in U.S. House of Representatives. More than 72 percent of Nonpartisan delegates voted with their party on these votes on average, with an even higher average unity score of 77 percent for the Workingmen.
Slate Discipline at the Convention

Plotting Delegate Ideal Points
Although political observers often talk about law making in terms of votes cast for or against individual bills, political scientists have found it useful to measure and analyze the underlying patterns underpinning legislators’ actions while in office—patterns that provide some coherent structure to their behavior across many votes. Focusing on such underlying predispositions is useful because it allows us to abstract away from the idiosyncrasies of individual votes and instead examine the central tendencies in delegate behavior.Footnote 50 To build such a measure of “average” individual delegate voting behavior to use as the dependent variable in our analysis, we jointly scale all the votes made on the convention floor using the Optimal Classification (OC) method developed by Keith Poole.Footnote 51 This is akin to building an index of legislator behavior across all of their votes. More specifically, OC algorithm identifies the most important underlying dimensions of conflict in a collection of many observed votes and estimates each delegate's “ideal point,” or preferred policy location, on these dimensions. Although our discussion focuses only on the delegates elected on the Nonpartisan and Workingmen's Party slate, the scaling itself incorporates information from votes cast by all delegates at the convention.
It is important to note that the convention votes covered a range of topics that strayed from the basic design of state government institutions.Footnote 52 One section, for example, provided for an annual poll tax “of no less than two dollars,” while another regulated the setting of water rates by local boards. Other provisions prohibited all those who took part in duels from holding public office or voting, set eight hours as the length of a legal workday, and spelled out regulations for the creation and taxation of corporations. Indeed, a blistering editorial in the Sacramento Daily Union lamented “the tendency on the part of the Constitutional Convention to mistake its functions for those of a legislative body, and to expend its energies in preparing a code of laws instead of a Constitution.”Footnote 53
Despite the breadth of topics included in the constitution and considered by the delegates, our preliminary analysis found that a one-dimensional model of conflict—similar to the liberal–conservative divide seen in modern politics—performed extremely well in explaining the overall voting patterns at the convention, suggesting that the bulk of the votes can be reduced to proposals located somewhere on a single underlying ideological dimension. Overall, the model correctly classified nearly 80 percent of votes taken at the convention.Footnote 54 Adding further dimensions, by contrast, contributed relatively little additional explanatory power. A two-dimensional model increased the classification rate only marginally, to 82 percent. For this reason, our substantive analysis focus on delegate positions in the first—and clearly most salient—dimension of conflict.Footnote 55
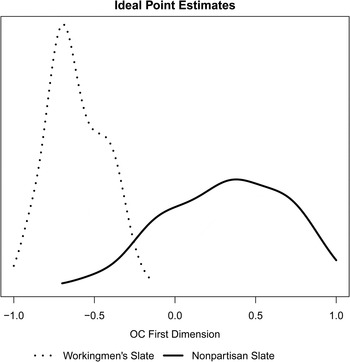
In Figure 1, we plot the distribution of delegate ideal points on this primary dimension of conflict at the constitutional convention. In the figure, separate densities are plotted for delegates elected on the Workingmen's Party ticket and those elected on the Nonpartisan slate. What is most striking is the clearly visible polarization. Overall, there is almost no overlap in the estimated ideal points of the Workingmen delegates and those elected on the Nonpartisan slate, suggesting that delegates rarely crossed slate lines on contested votes. Indeed, the degree of polarization is similar to that observed in the modern Congress. This finding is surprising given the substantial amount of overlap in policy preferences between the Workingmen and many of the farmers and rural delegates elected on the Nonpartisan slate noted by the observers from this period and the explicit instructions to pursue Workingmen-backed reforms given by the Nonpartisan nominating conventions in many counties.Footnote 56
Kernel Density Plot of Delegate Ideal Points.

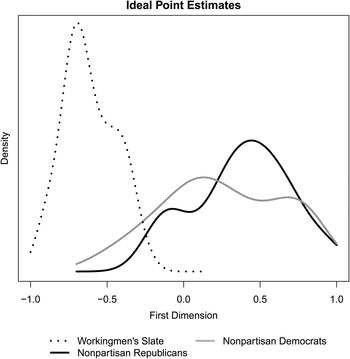
In Figure 2, we examine the degree to which variation in Nonpartisan voting behavior can be explained by preexisting partisan divisions among Democrats and Republicans by plotting separately the estimated ideal points for delegates from each party who were elected on the Nonpartisan slate. Although this figure does suggest that, on the whole, Republican delegates were somewhat more to the “right” of their Democratic counterparts on the underlying dimension of conflict at the convention, it does not reveal clear partisan fissures within the coalition.Footnote 57 In other words, little of the variation within the Nonpartisan camp is due to the previous partisan affiliations of the delegates elected on the group's slate.
Ideal Points of Nonpartisan Delegates by Previous Partisan Affiliation.

Determinants of Delegate Voting Behavior
How much of the variation in delegate voting behavior can be explained by the slate on which they were elected to the convention? And to what extent did other important forces shaping delegate preferences over key elements of the new constitution translate into votes on the floor of the convention? Although Figures 1 and 2 documented the importance of partisan and slate loyalties, the extent to which slate trumped preferences in explaining individual delegates’ votes remains unclear from these plots alone. To examine the determinants of individual delegate behavior, we estimate a series of regression models that use delegate ideal points as the dependent variable. Using information from candidate biographies and other sources, we also identify a number of factors historical observers have pointed to as likely sources of variation in delegate preferences over the substantive questions considered by the convention.
Method of Election
According to Swisher, the thirty-two delegates elected at-large were substantially more conservative than other Nonpartisan delegates chosen by district.Footnote 58 Kearney personally singled out the at-large ticket for opprobrium, describing it as “composed of thieves, villainous and murderous bloodsuckers, a band of criminals and robbers.”Footnote 59 The primary reason for this distinction was the method of nomination. The at-large slate was chosen at a statewide convention by Democratic and Republican party leaders, and was dominated by individuals with close ties to the railroad and other corporate interests. The screening provided by the statewide parties ensured that delegates selected to run on the at-large slate opposed most of the radical reforms proposed by the Workingmen for selfish economic and career reasons. Indeed, the formation of the at-large slate very much fits the theory of party construction that emphasizes “coalitions of groups develop[ing] common agendas and screen[ing] candidates for party nominations based on loyalty to their agendas.”Footnote 60 By contrast, nominations for local delegates were much more decentralized, giving voice to a broader range of interests. Many delegates elected on the Nonpartisan slate in rural parts of the state were more sympathetic to the policies supported by the Workingmen, and as we emphasized earlier, received explicit instructions from the nominating conventions to pursue these policies on the convention floor.
Occupation
Policy predispositions appeared strongly tied to the occupational background of individual delegates. Merchants and lawyers, whose individual economic well-being was closely tied to the profitability of corporations, were generally most opposed to corporate regulations and dramatic changes to the tax code. By contrast, agricultural interests not only bore the brunt of the tax burden under the existing public financing system but also often suffered at the hands of discriminatory and unreasonable railroad fares. Thus, their personal economic interests pushed agrarian delegates into much closer alignment with the policy demands of the Workingmen. Indeed, farmers provided the key electoral constituency for the election of the independent party in 1873, which anticipated many of the policy demands made by the Workingmen's Party only a few years later. We include two measures to capture this dynamic. First, we created an indicator variable for delegates whose main occupation was farming, based on their biographical summaries.Footnote 61 We also created a separate indicator variable for delegates who served as members of their local or statewide Grange organizations. Due to collinearity—all of the Grangers were also farmers—we estimate the impact of these two variables in separate models.
Previous Party
We created an additional variable indicating the previous partisanship of each delegate. Based on the findings reported in Figure 2, we expect the Republicans to be to the right of the Democrats, so we include this variable to examine the extent to which the candidates’ previous partisan identities continued to shape their voting behavior at the convention after accounting for other differences.
Previous Legislative Experience
We also include an indicator variable for whether each delegate had served in a previous elective legislative office. For most delegates, this meant prior election to the California state legislature, although several delegates had served in legislative houses in other states or in Congress.
Aside from information gleaned from the biographical profiles of the delegates, we also collected data from the 1880 Census about the constituency from which each delegate was elected. Because representation at the convention was organized around county boundaries, we identified the county represented by each delegate. For delegates whose district covered multiple counties, we took the average of the county-level characteristics.Footnote 62 Due to the clear divisions between urban districts, where corporations generally enjoyed more influence, and rural districts, which relied more heavily on farming, we calculated two variables capturing the economic interests of each county. The first, manufacturing wages per capita, is equal to the total amount in wages paid in the manufacturing sector in 1880 divided by the total population of each county. The second, farming per capita, was calculated as the total value of all farm products produced in the county divided by its population.
Although historians have suggested these factors as likely determinants of Nonpartisan delegate (and their constituents’) preferences, the archival record provides far fewer clear predictions about the forces shaping the behavior of delegates elected on the Workingmen's Party slate. The Workingmen, according to Swisher, “were closely organized among themselves and prepared to act as a unit in the achievement of the ends which they coveted.”Footnote 63 Our regressions include an indicator variable for delegates who were active members or officers in the state or federal Workingmen's Party. We expect that these delegates were generally more committed to the party cause, and thus would have been the most extreme members of the delegation at the convention.
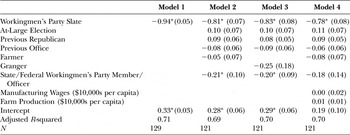
In Table 3, we present a series of ordinary least squares (OLS) regression models that take the ideal points of the delegates as their dependent variable. In Model 1, we simply regress the ideal points on an indicator variable for whether each delegate was elected on the Workingmen's Party slate. Note that we include only delegates elected on the Nonpartisan and Workingmen's slates, dropping all those elected on the separate Democratic and Republican tickets, so Nonpartisans represent the excluded (baseline) category. In Model 2, we add additional delegate-level variables drawn from their biographical profiles.Footnote 64 Model 3 includes a dummy variable for whether each delegate was a member of the Grange, replacing an indicator for farming occupation used in the previous column. Finally, Model 4 also adds in constituency-level variables, measuring the prominence of both farming and manufacturing in the district from which each delegate was elected.
OLS Models of Delegate Ideal Points

Notes: * p < 0.05 in two-tailed test. Observations only include delegates elected on Nonpartisan and Workingmen's slates.
The most clear conclusion from the models reported in Table 3 is that factors identified by historians as key determinants of delegate preferences over major policy questions debated at the convention—such as individual occupation and constituency-level economic interests—explain very little of the observed variation in actual delegate voting behavior.Footnote 65 A simple bivariate model that includes an indicator for the slate on which each delegate was elected accounts for almost three-fourths of the variation in delegate ideal points. Including additional delegate- and constituency-level controls does not substantively increase the explanatory power of the models. In each case, the dummy variable for being elected on the Workingmen's Party slate is highly statistically and substantively significant, with the coefficient representing a leftward shift in delegate ideal points equal to about 1.5 standard deviations.
Aside from slate membership, the variables for at-large election and previous membership in the Republican Party were only marginally significant and inconsistently so across the models, though both factors resulted in more conservative voting behavior in the convention. Despite historical evidence that delegates elected from rural areas generally supported many of the Workingmen's policies and, in many cases, received explicit instructions from their nominating convention to pursue precisely these policies at the convention, delegates representing farm-dependent counties did not vote in a significantly different fashion than their other Nonpartisan colleagues. Nor were farmers, whose personal economic interests made them natural allies for the Workingmen, more likely to cross slate lines on the convention floor. Among Workingmen, there is some evidence that activist delegates—those who were active in statewide or national Workingmen's Party organization—voted more consistently in opposition to the Nonpartisan coalition, although the effect is substantively small, representing about a quarter of a standard deviation in ideal points. In short, although the slates represented cohesive voting coalitions on the convention floor, the results provide only marginal evidence that delegates translated their personal or constituents’ policy preferences into votes—even when these policy preferences put them at odds with other members of their slates.
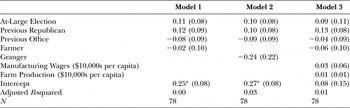
One possible concern is that these results understate the effect of delegate and constituency characteristics within the Nonpartisan camp by pooling together delegates elected on both slates. If these characteristics matter only for the Nonpartisans but not the Workingmen, whom historians suggest exhibited higher levels of party discipline, coefficients from the pooled model will be biased downward. To address this issue, Table 4 presents results estimated using only Nonpartisan delegates.Footnote 66 In these specifications, the coefficients are almost indistinguishable from those reported in the full models. The R 2 across all of the models in Table 4 is also very low, suggesting that delegate- and constituency-level factors can explain little of the variance in Nonpartisan delegate voting behavior. Indeed, the overall F test for the full regression falls short of significance at conventional levels in every model. Aside from slate membership—which exhibited a robust and substantively large effect on delegate actions on the convention floor—there is little evidence that other factors systematically influenced delegate behavior or cut across slate lines to undermine the discipline in the Nonpartisan coalition.
OLS Models of Nonpartisan Delegates’ Ideal Points

Note: * p < 0.05 in two-tailed test.
PARTY VERSUS PREFERENCE: TWO CASE STUDIES
The findings presented in the previous section focus on statistical analyses of delegate ideal points, combining information from all of the 290 roll call votes taken by the delegates on the convention floor. Of course, such an approach has clear limitations. By focusing on single index of legislative behavior, do we give insufficient weight to a few important votes on topics that truly split the Nonpartisan delegation? And OLS regressions cannot speak precisely to the mechanisms and strategies through which conservative Nonpartisan leaders maintained unity within their diverse coalition. To address such concerns, this section provides a more detailed overview of two important policy areas—the taxation of property and regulation of railroads—that not only resulted in the greatest amount of discussion on the convention floor but also pit the interests of conservative Nonpartisan leaders against their more rural backbenchers. In both cases, we show below, the leaders succeeded in crafting language that retained the support of their rural colleagues without making many substantively significant policy concessions.
Taxation
The challenge of raising public revenues to finance the operations of government proved to be one of the most vexing and deeply controversial political questions that animated debates not only at the convention but also in state government for much of preceding decade. Only one section of the original 1849 constitution said anything on the subject, requiring that property taxes be “equal and uniform” throughout the state and providing for the local election of tax assessors and collectors. However, the constitution did not define the term “property,” leaving the issue to interpretation through future legislative acts.
The state subsequently levied taxes both on real property and on debt secured by mortgages. Lenders, in turn, required borrowers to make the tax payments on their debt. This proved particularly unfair to farmers, who ended up essentially being taxed twice—first on the value of their land and second on the value of the mortgages they took out to purchase the land. Throughout the 1870s, the issue was subject to constant litigation, resulting in several California Supreme Court decisions on the matter. In 1876, the state Supreme Court finally struck down the taxation of debt secured by mortgages as unlawful double taxation. This did little to improve the financial standing of farmers, however, as government officials responded to the reduction of the tax base by simply increasing the tax rates on real property. Despite the state Supreme Court decision, agricultural interests continued to provide the bulk of state and local government revenues raised through levies on real property, because they owned the vast majority of the land in the state while banks and corporations largely escaped taxation. The desire for a more equitable system of taxation was a key driver of popular demand for constitutional reform. As we noted above, a number of local “fusion” nominating conventions gave their delegates explicit instructions to pursue the taxation of mortgages, bonds, and other financial products, to widen the tax base to include banking and capital interests.
The question of how to define property for the purpose of taxation attracted some of the most extensive and impassioned debate at the convention. Debates on the section defining the tax base began on December 27, 1878, and did not conclude until January 4, 1879. The final text included two provisions designed to appease farmer interests. The first explicitly included debt in the definition of property, while the second pronounced any contract “by which a debtor is obligated to pay any tax or assessment on money loaned, or on any mortgage, deed of trust, or other lien” to be “null and void.” This proved to be a pyric victory, however, because the new constitution did not include any limitations on usury, capping the maximum interest rates that could be charged by lenders. A usury provision was backed by the Workingmen delegates, but was effectively beat back by conservative Nonpartisans (with support from their rural delegates), who argued it would discourage lending and thus starve the state of capital. After the new constitution was adopted, banks quickly found ways to pass the new mortgage tax onto the debtors by raising interest rates, leaving farmers no better off financially than they had been under the previous tax system.Footnote 67
Regulating Railroads
Another related provision, dealing with the assessment of railroad property for the purposes of taxation, was adopted with significantly less debate. The language did not allow railroads to deduct their mortgage debts from the assessed value of their property, resulting in different treatment—and higher taxes—than other property owners. “These provisions,” Swisher wrote, “supported by the friends of the railroads and accepted by their critics with suspicion, were to provide trouble for the state and protection for the railroads in years to come.”Footnote 68 Immediately after the new constitution was adopted, railroad companies challenged the disparate treatment provided by the new state constitution as a violation of the Equal Protection Clause in the federal constitution. A federal court ruled against the state in San Mateo County v. Southern Pacific Railroad, making the property tax unenforceable with respect to railroads, and the federal Supreme Court declined to hear the appeal.Footnote 69 As a result, railroads largely escaped taxation for years, until settling with the state in exchange for much lower assessed valuations.
The convention had somewhat greater luck adopting regulations to restrain the most controversial practices associated with the Central Pacific Railroad. Nearly half of the recommendations prepared by the committee on corporations dealt specifically with railroads, and the committee's chairman, M. M. Estee, a prominent lawyer elected to one of the at-large seats on the Nonpartisan slates, emphasized these sections in his initial comments to the convention: “The result of the action of this convention, if favorable to the report of your committee, will mark a new era in the history of this state; it will stamp upon the organic law of California that right of visitation and regulation of railroads necessary for the protection of the people.”Footnote 70 Several of these recommendations were subsequently reworked to incorporate specific suggestions from an ad hoc committee of Workingmen.
The final language adopted in the constitution included two provisions favored by both Workingmen and farmers. The first prohibited discrimination in the setting of railroad fares, a priority for the agricultural community, while the second created an elected, three-person commission, the Railroad Commission, to oversee the industry, on the assumption that such an entity would prove to be more difficult to corrupt and less vulnerable to industry capture than the state legislature. As S. E. Moffett later documented, however, these expectations proved to be incorrect, and the commission effected little reform or active regulation over the railroads.Footnote 71
Equally important, however, was a provision omitted from the final language. The proposal would have prohibited railroads from engaging in predatory pricing—by setting their fares below the cost of operation—a strategy used by the Central Pacific with great success in the years before the convention to drive competing railroads and steamship lines out of business. Opponents of the measure argued successfully that it was made unnecessary by other regulations included in the new constitution and claimed that its adoption might threaten broader voter support for the creation of the Railroad Commission. As a result of this omission, and the disappointing performance of the new Railroad Commission, the Central Pacific—later acquired by Southern Pacific—continued many of its controversial pricing and anti-competitive practices while maintaining a firm grip over state government for decades to come. It would take the election of progressive Gov. Hiram Johnson in 1910 to implement successful reforms of the railroad industry.
Examining Two Key Votes
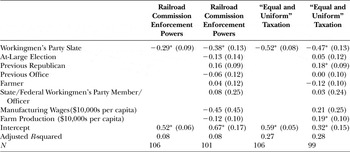
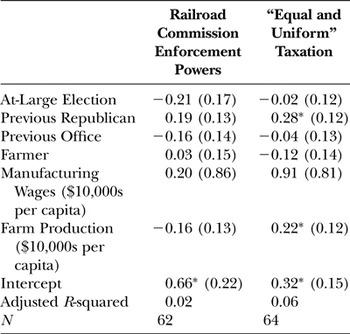
Because the questions of mortgage taxation and railroad regulation clearly divided the Nonpartisan delegation, they provide us with two ideal opportunities to directly compare the explanatory power of slate membership with that of personal and constituency preferences as drivers of delegate behavior. In Tables 5 and 6, we thus present regressions modeling delegate votes on two key votes dealing precisely with these issues. The tables report the results of linear probability models to ease the interpretation of the coefficients; however, all of the results remain substantively identical if we estimate logit models instead. Paralleling our presentation of the delegate ideal point analysis above, Table 5 includes votes taken by both Nonpartisan and Workingmen's Party delegates, while Table 6 reports the results only among the Nonpartisan delegation.
Modeling Selected Convention Votes (Linear Probability Models)

Notes: * p < 0.05 in two-tailed test. Note: Observations only include delegates elected on Nonpartisan and Workingmen's slates. Some delegates were absent on the days these votes were taken.
Modeling Selected Convention Votes among Nonpartisan Delegates (Linear Probability Models)

Note: * p < 0.05 in two-tailed test.
The first vote focused on the enforcement powers of the Railroad Commission and concerned an amendment offered by Delegate Estee. The original language adopted by the convention gave the new Railroad Commission key enforcement powers—including the ability to issue subpoenas, and a requirement that county sheriffs and other law enforcement executives enforce its mandates. The proposed amendment, described initially as a simple refinement and cleanup of the language, would have required the commission to turn to the courts to enforce its judgments and penalties. Some delegates worried that removing the commission's judicial powers would, in effect, weaken its regulatory effectiveness. As one noted:
This amendment, so to speak, takes the whole life and efficiency out of the whole provision [creating the Railroad Commission]. … That is, the Railroad Commission, under this amendment, has no power as a judicial body. I understand that the Convention wanted to give them some judicial power, and it attempted to do so. But the result of this amendment, very clearly, is to take the power away from the Railroad Commission.Footnote 72
The second vote we examine also dealt with what initially seemed to be a symbolic and unobjectionable amendment proposed by a prominent Nonpartisan delegate, who sought to add the familiar language from the 1849 constitution requiring property taxation to be “equal and uniform.” Several Workingmen delegates—lawyers by training—immediately noted the risk with importing this language into the new constitution. During the ensuing debates, they noted that precisely this phrase was at the heart of the earlier California Supreme Court decision, People vs. Hibernia Bank, which ruled that mortgages were exempt from taxation.Footnote 73 Because local assessors had no way to appraise mortgage debt in an “equal and uniform” way, the California Supreme Court concluded that mortgages were clearly excluded from the definition of property subject to taxation. Copying the phrase again into the new constitution, they warned, would risk exempting mortgages from taxation once again, precisely the opposite of what most delegates had pledged to do. “This same trouble will be precipitated upon us again unless we eliminate these words, and leave the section to direct that property shall be taxed according its true value in money,” one Workingmen delegate rose to explain. “That is all we want, and I do hope that this [proposed amendment] will not prevail. … I know that men whose sympathies are with the capital would like to have these words in, but I maintain that it is the verdict of the people of this State that these mortgages and solvent credits shall be taxed, and that we should precipitate ourselves into the difficulty in which we found ourselves when the decision in the case of the People v. The Hibernia Bank was made.”Footnote 74
Despite clear differences of opinion within the Nonpartisan slate over the desirability of a robust Railroad Commission and the taxation of lenders, the results in either Table 5 or 6 find little evidence that individual delegate preferences affected their votes on these provisions. In the first model for each vote in Table 5, we include only a single variable indicating whether each delegate was elected on the Workingmen's Party slate. As before, we exclude delegates elected on the separate Democratic and Republican tickets. In the estimation, Nonpartisan represent the baseline category. The coefficient is negative, substantively large in magnitude, and highly statistically significant in both cases, indicating that the Workingmen delegates voted consistently against the amendments. By contrast, when we also include the delegate- and constituency-level controls, these additional variables do not consistently predict voting behavior on these proposals. The only variable that is significant at conventional levels, farming per capita in the taxation amendment model, has an incorrect sign, indicating that delegates representing farm-heavy counties were more likely to vote in favor of the language potentially exempting mortgages from taxation—and thus increasing the tax burden on farmers, their key constituents. In substantive terms, this effect is also very small: Raising the farm dependence in a delegate's constituency from 1 standard deviation below the mean to 1 standard deviation above the mean increased the probability of voting for the amendment by just 4 percentage points, an order of magnitude smaller than the effect on Workingmen's Party slate membership. As with the full ideal point analysis, when we rerun these models separately for the Nonpartisan delegation (Table 6), we fail to reject the null hypothesis that both delegate- and constituency-level variables jointly had no effect on delegate voting behavior among Nonpartisan delegates.Footnote 75 The analysis of these two votes provides yet more evidence that partisanship trumped preferences in explaining delegate voting behavior on the convention floor.Footnote 76
VOTE MARGIN AS REVEALED PREFERENCE
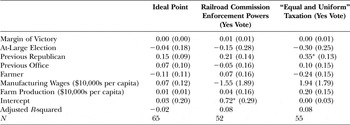
Our final efforts to separate the influence of slate membership and constituency demands take advantage of the results from the June 1878 election, when voters chose the delegates to represent them at the convention. The levels of support won by candidates from each party provide us with a natural measure of their constituents’ “revealed preferences.” Presumably, support for Nonpartisans’ policy positions was stronger in districts where Nonpartisan delegates won their seats by large margins compared to districts where they barely beat their opponents.Footnote 77 To carry out this analysis, we obtained copies of the election results from the California State Archives and calculated each delegate's margin of victory, adding this predictor to our models of Nonpartisan delegate voting behavior.Footnote 78
The results from this analysis are presented in Table 7. The records available from the archives were incomplete, leaving us unable to calculate the winning margins for eighteen of the delegates, which explains why the overall number of observations is somewhat smaller in this analysis than in the results presented earlier.Footnote 79 Regardless of whether we examine the ideal points recovered using the OC method or votes on the two contentious amendments, we find no evidence that constituent preferences—as measured by the electoral margin won by Nonpartisan delegates—significantly affected the delegates’ voting behavior on the convention floor.
Controlling for Electoral Margin among Nonpartisan Delegates (OLS)

Note: * p < 0.05 in two-tailed test.
CONCLUSION
The convention that drafted the 1879 California constitution has been analyzed by a variety of scholars and observers, many coming to different conclusions about its success and historical implications. For example, Joe Mathews and Mark Paul described the 1878–79 convention as “perhaps the greatest civic disaster in the history of a state with a talent for disaster,” blaming delegates for adopting a wide-ranging document few had read in full and even fewer understood completely.Footnote 80 Although characterizing the proceedings as “acrimonious,” Amy Bridges noted by contrast that the California convention, along with the other constitutional conventions held in the western states at the end of the nineteenth century, represented an important improvement over venal state legislatures of the period.Footnote 81 Harry Scheiber described the final document as “an authentically reformist constitution” and concluded that “despite important differences of ideology and political style among delegate factions, there emerged a fair degree of realism in their deliberations of mechanisms and direction of reforms; one does not sense that the delegates, or those who sent them to Sacramento, were completely at ease as to the purpose or potentialities of constitution writing.”Footnote 82 Reflecting on the document more than a century later, Jeffrey Lustig wrote:
The constitution wound up an eclectic, motley affair not because its authors were bunglers but because it was the product of an ongoing social conflict and was drafted, in part, by people who learned the hard way they needed extralegislative protections in their struggle for democracy. It was a work in progress—as democracy in California remains today. And the constitution did prophesy accurately the terms of the state's primary political conflict in the coming era.Footnote 83
Our reading of the deliberations from California's 1878–79 constitutional convention and our analysis of the roll call votes made by the delegates who attended it suggest that the experience was neither an amateur, unorganized disaster that some modern-day critics claim nor a careful, deliberative body of statesmen that idealists may have hoped for. The final document certainly reflected considerable thought and consideration, although much of its substance reflected the goals of conservative leaders of the Nonpartisan delegation who chaired the key committees and occupied the top posts at the convention. Some of its most important provisions were adopted on party-line votes, over strong opposition from the Workingmen. These findings have important implications for modern-day reformers, many of whom naively view state constitutional revision and reform as a solution to the partisanship and gridlock that plague many legislatures today.
More broadly, our findings suggest that the emergence and survival of legislative political parties need not depend on legislators’ sense of linked electoral fate in future elections. Few of the convention delegates anticipated or went on to run for subsequent electoral offices. Only a quarter of the delegates had any previous legislative experience, and only a small handful went on to serve in the state legislature in the sessions immediately after the convention. Nor do we find evidence that party discipline requires the presence of like-minded colleagues. After accounting for the slate on which each delegate was elected, we find no evidence that personal or constituency-level characteristics contributed any additional information in explaining delegate voting behavior. In other words, we document strong evidence of partisanship and legislative discipline in the absence of “preferenceship” or shared concerns about the party brand name.
What then can explain the high level of party cohesion observed on the convention floor? Although our empirical strategy provides a much more compelling empirical strategy to rule out explanations, rather than identifying the underlying cause of party unity, historical accounts allow us to speculate briefly about the mechanisms of party influence. These sources point to the entrepreneurial activities and strategic actions on the part of conservative leaders of the Nonpartisan slate in preventing defections from their coalition. By using well-timed recesses and caucus meetings, making key appointments to leadership roles, and maintaining control over the convention's agenda by drafting the substantive sections of the new constitution in committees chaired by loyal allies, party leaders were able to preserve a unity of purpose among their co-partisans.
The lack of professionalism or previous legislative experience among most of the convention delegates no doubt helped experienced party leaders, such as President Hoge, to assume authority and exercise their influence over the proceedings. Armed with the usual institutional leadership tools and prerogatives, as well as, perhaps, the respect and deference resulting from their election to these formal leadership positions by their peers,Footnote 84 these powerful delegates appear to have successfully imposed a temporary truce between the state's dominant Democratic and Republican parties that resulted in a surprising level of legislative cohesion crossing traditional partisan lines. As the voting records show, however, this truce proved to be temporary. After the end of the convention, voting in the state legislature again reverted to the state's traditional Democratic–Republican divide.
It is important to note that some of the agenda of items considered by the delegates likely differed from policies that confronted state legislators in the years before and after the convention, which may explain the different coalitional dynamics at the convention. However, differences in the composition of the agenda alone are, by themselves, an implausible explanation for the high levels of cohesion exhibited by delegates on the convention floor. While it is possible that delegates were more vulnerable to party pressure than typical legislators, perhaps because the broad institutional-design questions confronted by the convention were analogous to “procedural” votes on which party leaders are thought to be most influential, the opposite expectations seem equally plausible.Footnote 85 Unlike typical legislation, which can be reversed or amended by future lawmakers as conditions or majority coalitions change, California's convention worked to design an institutional structure that would remain insulated from future political control, giving the system more permanency than typical legislative votes. Given the weighty decisions they confronted and the legacy their votes would leave for posterity, delegates would almost certainly have felt a great deal of personal responsibility to buck the pressure from slate leaders when their own views conflicted with those of other slate members.
In addition, as we note above, the new California constitution not only focused on the design of the state's governing institutions but also tackled some of the most salient policy debates of this period, including provisions regulating railroads, setting corporate tax rates, providing for water rights and irrigation, and regulating public utilities, among many other substantive policy provisions written into the document. Many of these issues appeared as some of the most controversial issues on the legislative agenda in the years before the convention and would reappear again even after the new charter was adopted. It is useful to be reminded again of the complaint lodged by the Sacramento Daily Union, which warned that “as the work of the [constitutional convention] committees progresses this tendency (to write law instead of constitutional provisions) becomes more marked, and would seem as though it was the aim of every such committee to produce a body of law covering the entire subject dealt with, and leaving nothing to the law-making power of the future.”Footnote 86 Clearly, there was a great deal of overlap, and similarities existed between the substantive topics considered by the delegates and state legislators from this era. For these reasons, it appears highly unlikely that the high levels of party discipline exhibited at the convention are particularly unique to the historical or political context in which the delegates made their decisions.
Another important difference between delegate deliberations and other, more typical legislative contexts is that the convention was a “one-shot” affair, while bargaining in legislatures more closely resembles a repeated game. This difference, however, makes the observed discipline at the convention even more puzzling in light of the existing literature. Models of party formation inspired by social choice theory are premised on the notion that legislators form “long” coalitions to bring semblance of order to a legislative body, a logic that holds only if they expect such coalitions to survive over the long haul.Footnote 87 Longer time horizons also increase the influence of party leaders, whose arsenal of carrots and sticks is more effective if legislators expect to interact with them over long periods of time.Footnote 88 Neither applies in the case of the California convention, and thus cannot serve as an explanation for the cohesion observed in the delegate voting behavior.Footnote 89
Overall, our data and findings show how political leaders can and do act in a purposive manner to further their shared legislative goals by encouraging high levels of discipline among their co-partisans. More importantly, we also find that backbenchers are willing to defer to party leaders even in the absence of electoral or policy-induced bonds of partisanship. At California's constitutional convention, leaders of the Nonpartisan delegation were able to successfully cobble together a coalition, shape the floor debate, and ultimately the final outcome of the constitutional convention. These results suggest that legislative parties can emerge in the most difficult of circumstances and encourage further investigation into the conditions that give rise to and help sustain legislative discipline.