Implications
Mule ducks have a high capacity for foie gras production. Overfeeding can induce a strong accumulation of lipids in the liver. In foie gras production, high level of corn-based feed is force-fed into the esophagus of Mule ducks. However, the optimum amount of feed consumption that should be supplied to maximize growth performance and foie gras yield is not clear. Therefore, this study helps to know optimum feed consumption level that should be supplied not only to maximize the growth performance and total liver yield, but also to minimize the adverse effects of excessive feed intake on nutrient digestibility and utilization resulting in high nutrient excretion.
Introduction
In waterfowl, a carbohydrate-rich corn-based diet for two weeks is commercially used to increase hepatic fatty acid synthesis in foie gras production (Hermier et al., Reference Hermier, Saadoun, Salichon, Sellier, Rousselot-Paillet and Chapman1991), because liver in avian species is considered as the major lipogenic organ. Overfeeding increases significantly lipid levels in duck meat and liver (Zanusso et al., Reference Zanusso, Rémignon, Guy, Manse and Babilé2003; Molee et al., Reference Molee, Bouillier-Oudot, Auvergne and Babilé2005; Chartrin et al., Reference Chartrin, Bernadet, Guy, Mourot, Hocquette, Rideau, Duclos and Baéza2006a). It is generally accepted that the net balance between de novo lipogenesis, fatty acid uptake and fatty acid oxidation can explain fat deposition in overfed waterfowl (Hermier et al., Reference Hermier, Saadoun, Salichon, Sellier, Rousselot-Paillet and Chapman1991; Hansen and Walzem, Reference Hansen and Walzem1993; Fournier et al., Reference Fournier, Peresson, Guy and Hermier1997). Mule duck (a sterile hybrid of male Albatre Muscovy duck and female Pekin duck) has high ability for foie gras production (André et al., Reference André, Guy, Gontier-Latonnelle, Bernadet, Davail, Hoo-Paris and Davail2007). In a study conducted to compare the response of Pekin ducks and Mule ducks to overfeeding, Chartrin et al. (Reference Chartrin, Bernadet, Guy, Mourot, Hocquette, Rideau, Duclos and Baéza2006b) found that Mule ducks showed a higher production of foie gras than Pekin ducks. By comparison with Pekin ducks, liver weight was increased eight-fold from Mule ducks in 2 weeks of overfeeding (Chartrin et al., Reference Chartrin, Bernadet, Guy, Mourot, Hocquette, Rideau, Duclos and Baéza2006a). Mule ducks provide the major part of duck foie gras produced in China and France (Pingel, Reference Pingel2009).
Feeding levels affect BW, liver yield, and fat deposition during the force-feeding period in Mule ducks (Chartrin et al., Reference Chartrin, Schiavone, Bernadet, Guy, Mourot, Duclos and Baéza2007). In practice, the optimum amount of feed supply that should be recommended to maximize growth performance and fatty liver yield is not clear. Excessive feed consumption in ducks negatively affected digestibility and utilization of nutrients (Zhang et al., Reference Zhang, Hou, Wang, Liu and Xie2007), which resulted in a large amount of manure and litter, which cause pollution problems (Yokota, Reference Yokota1976; Yokota and Ueda, Reference Yokota and Ueda1981). In addition, reduced utilization of nutrients will increase costs of production per gram foie gras. In fact, the focus of force-feeding ducks should be on maximizing duck production with minimum feed cost. Quantification of feed consumption during the force-feeding period is important to improve economic benefit through better feed utilization and less feed cost. At present, the optimal amount of feed consumption is not clear in force-fed Mule ducks and experimental data for the optimal feed supply level during the force-feeding period is limited. Therefore, in order to avoid excess feed consumption in foie gras production of Mule ducks, the objective of this study was to investigate the effects of feed supply levels on growth performance and carcass composition to determine the optimum amount of feed supply that should be recommended not only to maximize the growth performance and total liver yield, but also to minimize the accumulation of wastes that are produced by duck industry.
Material and methods
All procedures of the present study were approved by welfare committee of the Institute of Animal Science of Chinese Academy of Agricultural Sciences.
Animals and diets
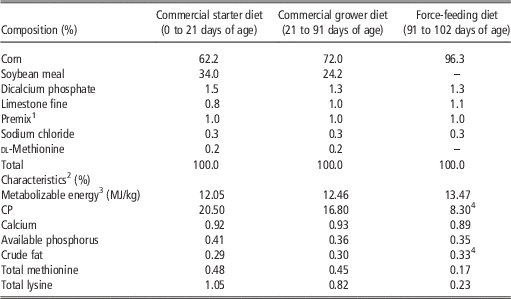
Male Mule ducklings (sterile and artificial hybrid of male Albatre Muscovy duck and female Pekin duck) hatched on the same day were obtained from waterfowl breeding center of Chinese Academy of Agricultural Sciences. They were fed a commercial starter diet containing 205 g/kg CP and 12.05 MJ ME/kg from hatching to 21 days of age, and a grower diet containing 168 g/kg CP and 12.46 MJ ME/kg from 22 to 91 days of age. Then the birds were fed a corn diet by force-feeding from 91 to 102 days of age. The corn diet was prepared in mash form and was analyzed containing 83 g/kg CP and 3.3 g/kg crude fat. The calculated ME value was 13.47 MJ/kg. During the force-feeding period, the corn diet for each duck was first weighed and mixed with tap water (1 : 1, 20°C water temperature) for 2 h before feeding, and then it was quantificationally introduced into the enlargement of the ducks esophagus. Composition and main characteristics of starter and grower diets and force-feeding diet are shown in Table 1.
Composition and main characteristics of starter, grower and force-feeding diets

1 Premix provided the following per kg of diets: Cu as CuSO4·5H2O 10 mg; Fe as FeSO4·7H2O 60 mg; Zn as ZnO 60 mg; Mn as MnSO4·H2O 80 mg; Se as NaSeO3 0.2 mg; I as KI 0.2 mg; Choline chloride 1000 mg; vitamin A 10 000 IU; vitamin D3 3000 IU; vitamin E 20 IU; vitamin K3 2 mg; thiamin 2 mg; riboflavin 8 mg; vitamin B6 4 mg; vitamin B12 0.06 mg; pantothenic acid 20 mg; nicotinic acid 50 mg; folic acid 1 mg; biotin 0.2 mg.
2 Calculated values.
3 Values were calculated according to the MEn of feedstuffs for poultry provided by NRC (1994).
4 The numbers were analyzed values.
Experimental design and rearing management
A total of 80 male Mule ducklings were conventionally reared on the floor from hatching to 91 days. During this period, the birds had free access to water and feed and lighting was continuous. The temperature was kept at 33°C (at floor level) from 1 to 3 days of age, at 30°C from 4 to 7 days of age, at 27°C from 8 to 15 days of age, and then it was reduced gradually to 20~24°C. The humidity was 20% from 1 to 3 days of age and then gradually increased to 65%. At 91 days of age, all ducks were weighed individually, and 56 birds with similar weights were randomly allotted to raised wire-floor pens (1×2 m) with one bird per pen. There were seven dietary treatments, each containing eight replicate birds. The treatment groups were quantitatively force-fed. Feed intake in the first 2 days was the same 330 g/bird on day 91 and 390 g/bird on day 92, respectively, and then the amount of feed intake provided to the ducks in each treatment remained unchanged during the other 10 days and was 450, 540, 630, 720, 810, 900 and 990 g/day per bird for each treatment group, respectively. Force-feeding was performed three times a day at 0600, 1300 and 2000 h, supplying one third of the daily among of feed every time. The temperature of force-feeding room was 20~24°C and humidity 65~70%.
Measurements
At the end of the 12-day force-feeding period, BW gain and feed conversion ratio (FCR) of ducks from each pen were calculated. After being deprived of feed for 12 h, all ducks from each pen were euthanized by CO2 inhalation and bled. Birds were then immersed into hot water at 60°C for 2 min, scalded, picked, and eviscerated manually. Skin with subcutaneous fat, abdominal fat, breast meat (including pectoralis major and pectoralis minor), leg meat (including thigh and drum stick) and liver were removed from carcasses manually and weighed. Breast meat and leg meat were all skinless and boneless. All weights, including skin with subcutaneous fat, abdominal fat, breast meat, leg meat and liver were expressed as a percentage relative to eviscerated carcass weight at processing.
Statistical analysis
Data were analyzed as a completely randomized design by one-way ANOVA procedure of SAS software (SAS Institute, 2003). When dietary treatment was significant (P<0.05), means were compared using Duncan’s multiple comparison procedure of SAS software (SAS Institute, 2003). In the study, broken-line regression model analysis (Robbins et al., Reference Robbins, Saxton and Souther2006) was used to estimate the optimum feed consumption level of Mule ducks based on BW gain and total liver yield data using the NLIN procedure of SAS software (SAS Institute, 2003). The model was as following:
 $$y{\rm \,{\equals}}\,l{\rm {\plus}}u{\rm (}r{\minus}x{\rm )}$$
where y is the BW gain and total or relative liver weight, x the feed consumption levels, r the abscissa of the breakpoint and r is taken as the estimated optimal feed consumption level, l growth index response to optimal feed consumption level and u the slope of model. In this model, y=l when x>r.
Results and discussion
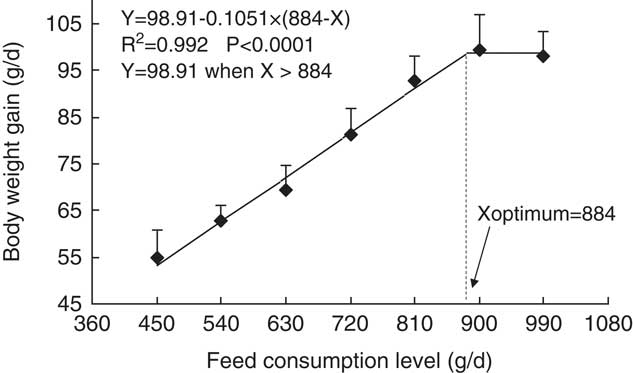
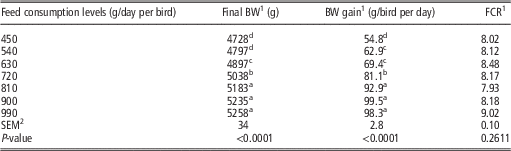
The main purpose of overfeeding of ducks and geese is to increase fat deposition to produce foie gras. The effect of overfeeding on production performance has been well discussed in waterfowl (Fournier et al., Reference Fournier, Peresson, Guy and Hermier1997; Davail et al., Reference Davail, Guy, André, Hermier and Hoo-Paris2000; Su et al., Reference Su, Dodson, Li, Li, Wang and Xie2009). In the present study, initial live BWs for different treatments were similar (P>0.05) and varied from 4031±49.4 to 4071±86.8 g. At the end of the study, some ducks at 990 g/day group showed leg paralysis and crippled. When these ducks were slaughtered, a lot of undigested feed was observed in the enlargement of the ducks esophagus. It indicated force-feeding 990 g/day feed had over-achieved maximum digestion capacity of male Mule ducks. As showed in Table 2, feed consumption levels affected the final BW and BW gain significantly (P<0.05) but not FCR. The results showed that force-feeding higher amounts of feed resulted in an improvement in BWs, which was in agreement with other reports (Zanusso et al., Reference Zanusso, Rémignon, Guy, Manse and Babilé2003; Chartrin et al., Reference Chartrin, Bernadet, Guy, Mourot, Hocquette, Rideau, Duclos and Baéza2005). However, there was no further increase in BW gain when feed intake exceeded 900 g/day (Table 2), which suggested that BW gain of Mule ducks had reached its maximum. We applied the regression model analysis that has been widely used for determining quantitative nutrient requirements in animal nutrition (Luo et al., Reference Luo, Liu, Mai, Tian, Tan and Shi2006; Yuan et al., Reference Yuan, Yang, Gong, Luo, Yuan and Chen2010; Zhu et al., Reference Zhu, Xie, Huang, Yang and Hou2012) to estimate the optimum feed consumption level for Mule ducks. In this trial, based on the broken-line regression model analysis with the BW gain data, the optimum feed consumption level for Mule ducks was 884 g/day (Figure 1). The values are very different from previous data in Pekin ducks by Wen et al. (Reference Wen, Xie, Fouad, Tang, Huang and Hou2015), who reported that the optimum feed consumption level for Pekin ducks during the force-feeding period was 414 g/day. Feed consumption levels for Mule ducks was calculated based on BW0.75, and feed and energy intake for maximum BW gain were 217 g feed/kg BW0.75·per day and 2.93 MJ ME/kg BW0.75·per day, respectively (see the last table). Previous studies have shown that optimum consumption levels for feed and energy intake in Pekin ducks were 163 g feed/kg BW0.75·per day and 2.18 MJ ME/kg BW0.75·per day, respectively (Wen et al., Reference Wen, Xie, Fouad, Tang, Huang and Hou2015). This discrepancy may be attributed to differences in feed composition, feed energy levels, and maximum growth capacity of ducks between the two experiments.
Relationship between BW gain and feed consumption levels using a broken-line regression model analysis. The break point is labeled with an arrow. It indicates the optimum feed consumption level.

Effects of feed consumption levels from 91 to 102 days of age on growth performance of male Mule ducks

FCR=feed conversion ratio
1 Data were based on all ducks (n=8 birds/ treatment); the force-feeding period lasted 12 days from 91 to 102 days of age.
2 SEM: pooled standard error of the mean.
a,b,c,dMean values in the same column with no common superscript differ significantly (P<0.05).
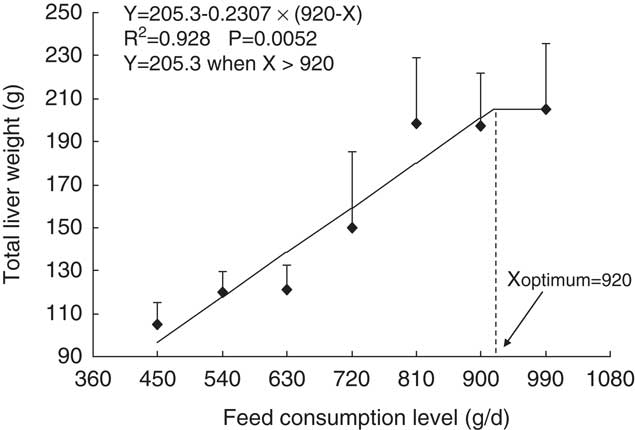
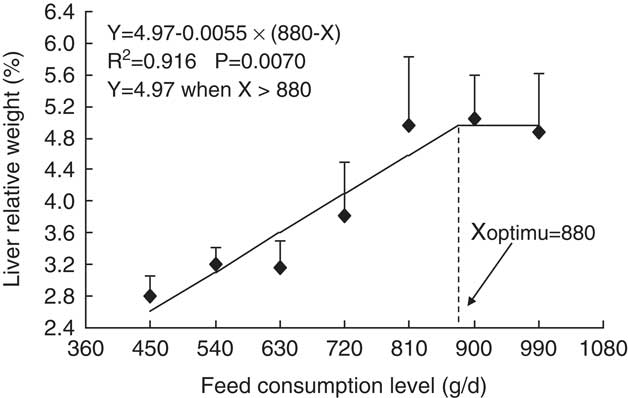
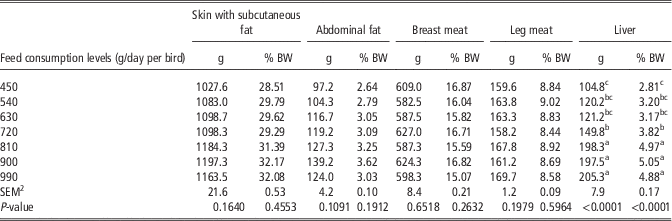
Liver is the most important part in foie gras production of Mule ducks and higher yield of foie gras means higher economic value for duck producers. In this trial, total liver weight increased significantly with increasing feed consumption level up to 810 g/day (P<0.05) and showed no significant differences above that level (P>0.05) (Table 3). Feed consumption levels had significant effect on liver relative weight (P<0.05), and it achieved maximum value at a feed intake of 900 g/day (Table 3). As previously reported in the three genotypes of ducks (Davail et al., Reference Davail, Rideau, Guy, André, Hermier and Hoo-Paris2003), overfeeding induced a significant increase in liver weight. In waterfowl, an intense lipogenesis from dietary carbohydrates in the liver results in foie gras (Saadoun and Leclercq, Reference Saadoun and Leclercq1987). The main reason may be that the de novo synthesized triglyceride are stored into the hepatocytes when the intensity of lipogenesis is higher than the hepatic capacity for very-low-density lipoprotein (VLDL) synthesis and secretion (Hermier et al., Reference Hermier, Saadoun, Salichon, Sellier, Rousselot-Paillet and Chapman1991; Fournier et al., Reference Fournier, Peresson, Guy and Hermier1997) . In foie gras production of Mule ducks, in order to increase liver weight quickly, excess feed was force-fed into the esophagus. However, our study suggested foie gras weight of Mule ducks had no further increase at 900 g/day, and it reached a maximum energy deposition over 900 g/day (Table 3). The reason may be that the 990 g/day of feed consumption had exceeded ducks ingestion potential, caused gradually morphological adaptation of the digestive tract, and had a negative effect on ducks physiological response and growth (Zhou et al., Reference Zhou, Isshiki, Yamauchi and Nakahiro1990). In addition, when nutrient digestibility of ducks reduced, increased microbial growth resulted in more competition for nutrients with the host. In this way, it might lead to intestinal disorders. According to broken-line regression, the optimum feed consumption levels were 920 g/day for total liver weight (Figure 2) and 880 g/day for liver relative weight (Figure 3), respectively. Based on BW0.75, broken-line regression analysis of liver relative weight data indicated that optimum consumption levels for feed and energy intake were 216 g feed/kg BW0.75·per day and 2.92 MJ ME/kg BW0.75·per day, respectively (Table 4). When feed consumption levels were calculated based on total liver weight, optimum consumption levels for feed and energy intake were 227 g feed/kg BW0.75·per day and 3.08 MJ ME/kg BW0.75·per day, respectively (Table 4). In our study, optimum feed consumption levels for total liver weight were higher compared to that for weight gain and liver relative weight. No significant differences in breast and leg meat yield were observed between treatments (P>0.05), and the yield of skin with subcutaneous fat and abdominal fat increased gradually with increasing feed consumption level (Table 3). Overfeeding of waterfowls can induce a strong fattening of peripheral adipose tissues such as subcutaneous and abdominal adipose tissues (Janan et al., Reference Janan, Bárdos, Karsai, Ágota, Rudas, Kozak and Bódi2000). These could derive from lipids synthesized in the liver and carried by VLDL (Davail et al., Reference Davail, Rideau, Guy, André, Hermier and Hoo-Paris2003). Increasing subcutaneous and abdominal fat yield may also be a reason for increasing BW gain.
Relationship between total liver weight and feed consumption levels using a broken-line regression model analysis. The break point is labeled with an arrow. It indicates the optimum feed consumption level.

Relationship between liver relative weight and feed consumption levels using a broken-line regression model analysis. The break point is labeled with an arrow. It indicates the optimum feed consumption level.

Effects of feed consumption levels at 102 days of age on total liver weight and carcass composition of male Mule ducksFootnote 1

1 Data were based on all ducks (n=8 birds/treatment).
2 SEM: pooled standard error of the mean.
a,b,cMean values in the same column with no common superscript differ significantly (P<0.05).
Feed consumption levels for metabolic BW (BW0.75, kg)

1 It was expressed as requirement±SE.
2 Feed consumption was calculated for BW0.75.
In conclusion, feed consumption levels had significant effects on growth performance and carcass composition during the force-feeding period in foie gras production of Mule ducks. The optimum feed consumption levels of male Mule ducks from 91 to 102 days of age for maximum BW gain, total liver weight, and liver relative weight were 217, 227 and 216 g feed/kg BW0.75·per day, respectively. The present study has potential commercial application for foie gras production of male Mule ducks.
Acknowledgments
This work was supported by the Earmarked fund for the Modern Waterfowl Industry Technology System of China (CARS-43) and the Agricultural Science and Technology Innovation Program (ASTIP-ISS09).