Introduction
Major depression is usually recurrent, often life-threatening (Bertolote et al. Reference Bertolote, Fleischmann, De Leo and Wasserman2004), and leads to dysfunctions of mood, motivation and cognition (Austin et al. Reference Austin, Mitchell and Goodwin2001). In approximately 50% of patients, first-line antidepressant treatment is ineffective and about a third of patients do not show a substantial antidepressant response, even after four treatment steps (Rush et al. Reference Rush, Trivedi, Wisniewski, Stewart, Nierenberg, Thase, Ritz, Biggs, Warden, Luther, Shores-Wilson, Niederehe and Fava2006; Lisanby et al. Reference Lisanby, Husain, Rosenquist, Maixner, Gutierrez, Krystal, Gilmer, Marangell, Aaronson, Daskalakis, Canterbury, Richelson, Sackeim and George2009). Incomplete recovery or partial remission from depression is classified as treatment-resistant depression (TRD; Schlaepfer et al. Reference Schlaepfer, Agren, Monteleone, Gasto, Pitchot, Rouillon, Nutt and Kasper2012). In the field of treatment resistance, electroconvulsive therapy (ECT) is currently seen as the main treatment option (Krystal et al. Reference Krystal, West, Prado, Greenside, Zoldi and Weiner2000), with a remission rate of approximately 70% (Sackeim et al. Reference Sackeim, Prudic, Devanand, Nobler, Lisanby, Peyser, Fitzsimons, Moody and Clark2000b ; Petrides et al. Reference Petrides, Fink, Husain, Knapp, Rush, Mueller, Rummans, O'Connor, Rasmussen, Bernstein, Biggs, Bailine and Kellner2001). However, because of the high relapse rates recorded (~50%) (Sackeim et al. Reference Sackeim, Luber, Moeller, Prudic, Devanand and Nobler2000a ; Grunhaus et al. Reference Grunhaus, Hirschman, Dolberg, Schreiber and Dannon2001; Azuma et al. Reference Azuma, Fujita, Otsuki, Nakano, Kamao, Nakamura, Fujioi, Otake, Nishigaki, Suzuki, Kataoka, Matsuzawa, Sonoda, Nakaaki, Murata, Akechi and Furukawa2007a ), negative cognitive side-effects (Lisanby et al. Reference Lisanby, Maddox, Prudic, Devanand and Sackeim2000; Rose et al. Reference Rose, Fleischmann, Wykes, Leese and Bindman2003) and social stigma (Ottosson & Max Fink, Reference Ottosson and Max Fink2004), ECT is often used as a last resort (Grunhaus et al. Reference Grunhaus, Hirschman, Dolberg, Schreiber and Dannon2001). Therefore, there is an urgent need for new therapy strategies in cases of treatment-resistant forms of depression.
A widely recognized shortcoming of ECT is its propensity to be associated with cognitive side-effects (Bernstein et al. Reference Bernstein, Beale, Berns and Kellner1998; Fink, Reference Fink2001), with about 55% of patients reporting cognitive impairments after ECT (Rose et al. Reference Rose, Fleischmann, Wykes, Leese and Bindman2003). These symptoms have a significant impact on a patient's outcome (Austin et al. Reference Austin, Mitchell and Goodwin2001), impairing functionality, basic autonomy and quality of life (Montgomery & Gale, Reference Montgomery and Gale2008).
A decade after magnetic seizure therapy (MST) was first posited as a new convulsive brain stimulation method for resistant forms of depression (Lisanby et al. Reference Lisanby, Schlaepfer, Fisch and Sackeim2001), there continues to be little information about its efficacy, safety and tolerability. MST is still in an early phase of clinical research and because of the small number of patients registered in earlier studies, generalizations on the specific efficacy of MST cannot yet be made. Several small clinical studies have shown antidepressant effects and the absence of cognitive side-effects (Lisanby et al. Reference Lisanby, Luber, Schlaepfer and Sackeim2003; Kayser et al. Reference Kayser, Bewernick, Axmacher and Schlaepfer2009, Reference Kayser, Bewernick, Grubert, Hadrysiewicz, Axmacher and Schlaepfer2011; Fitzgerald et al. Reference Fitzgerald, Hoy, Herring, Clinton, Downey and Daskalakis2013). To date, MST studies have not included neuroimaging assessments, with the exception of one case report where metabolic effects were reported (Kosel et al. Reference Kosel, Frick, Lisanby, Fisch and Schlaepfer2003) and a recently published study of 10 patients that indicates increased metabolism in several brain regions following MST (Hoy et al. Reference Hoy, Thomson, Cherk, Yap, Daskalakis and Fitzgerald2013). A key question, therefore, is whether the antidepressant effect of MST is associated with enduring metabolic changes in brain regions related to the mood processing circuitry.
In line with our previous results (Kayser et al. Reference Kayser, Bewernick, Axmacher and Schlaepfer2009, Reference Kayser, Bewernick, Grubert, Hadrysiewicz, Axmacher and Schlaepfer2011), we hypothesized that MST would have similar antidepressant efficacy as ECT, but without cognitive worsening. The results for 10 patients were partial reported previously (Kayser et al. Reference Kayser, Bewernick, Grubert, Hadrysiewicz, Axmacher and Schlaepfer2011). In the current study an extended sample was assessed and clinical follow-up data were included. In addition, we used an extensive neuropsychological battery, and the effect of MST on brain glucose metabolism was assessed using [18F]-fluorodeoxyglucose positron emission tomography (FDG-PET).
Method
Study design and patients
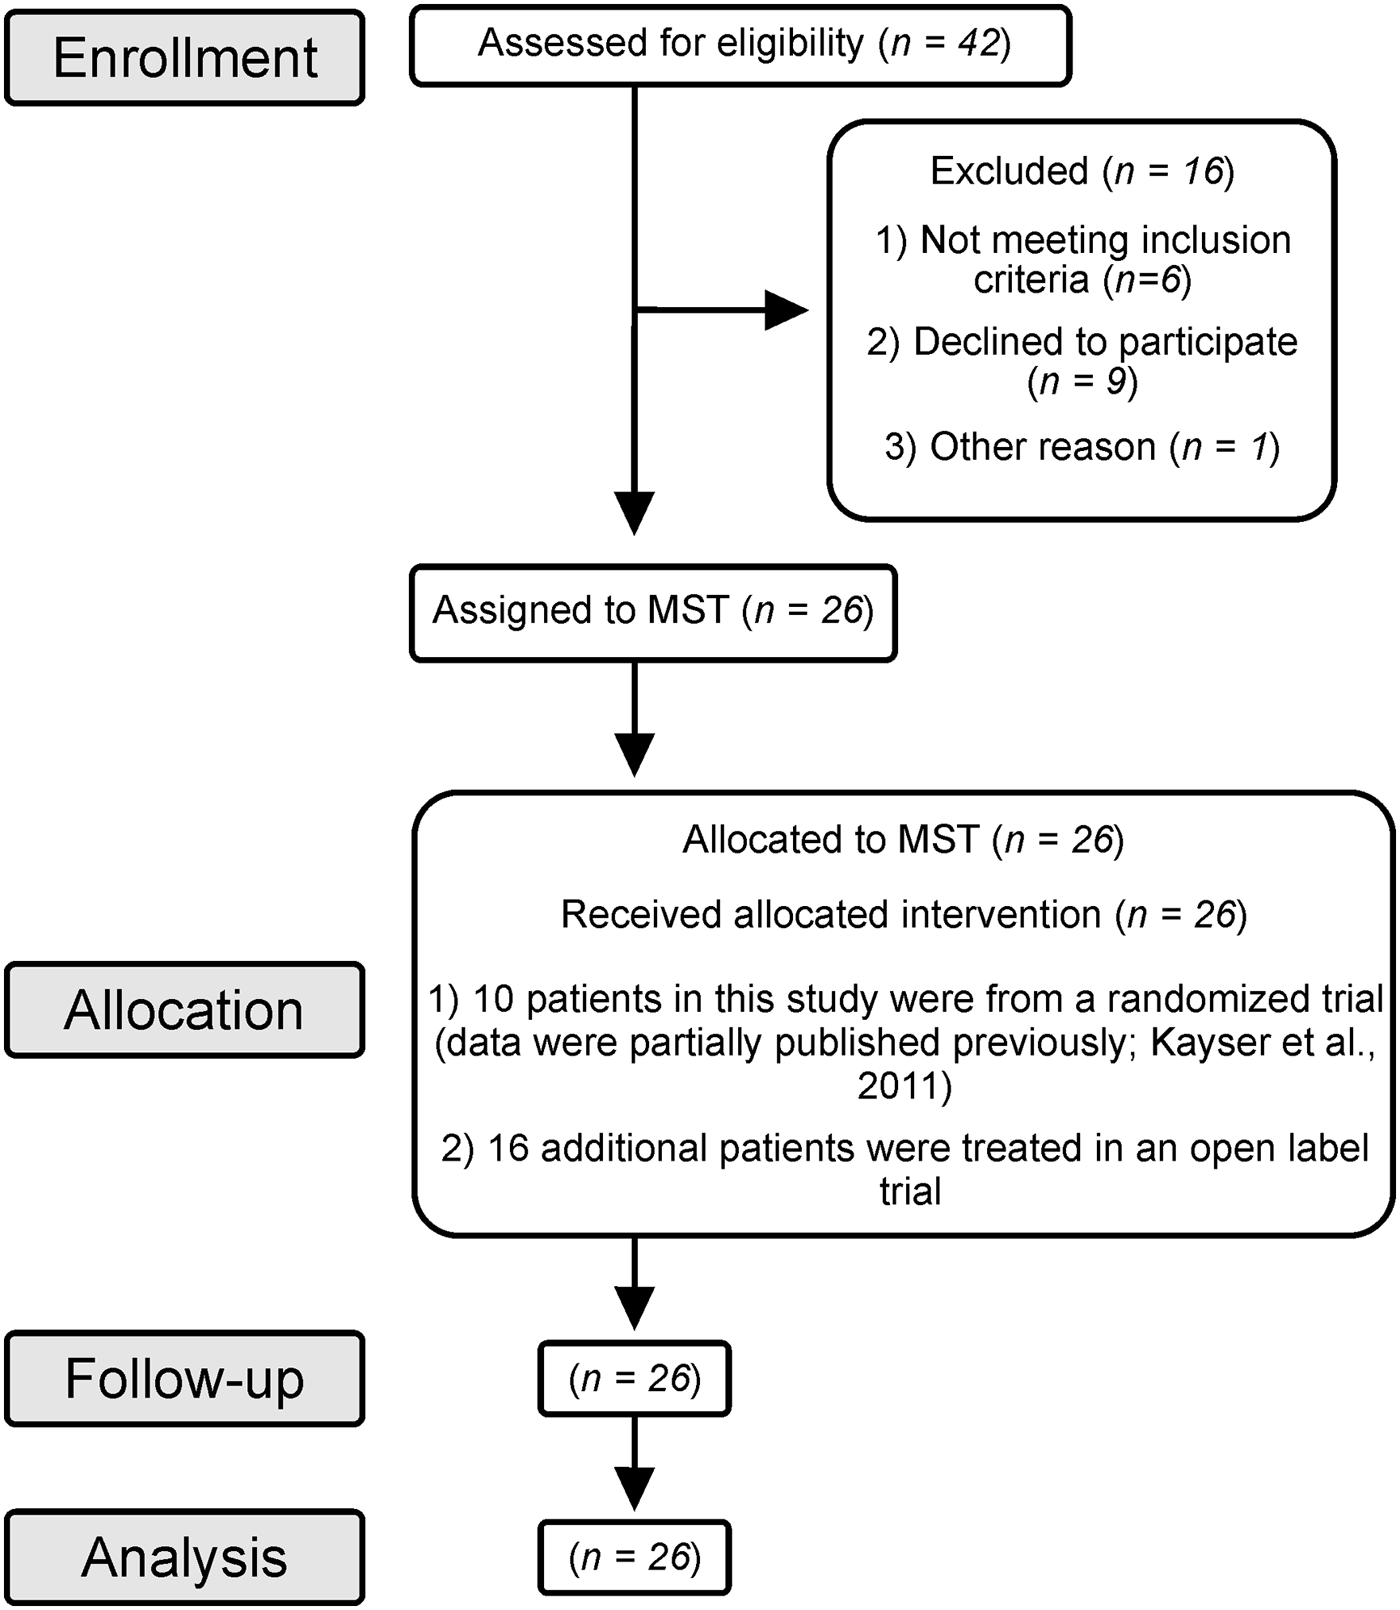
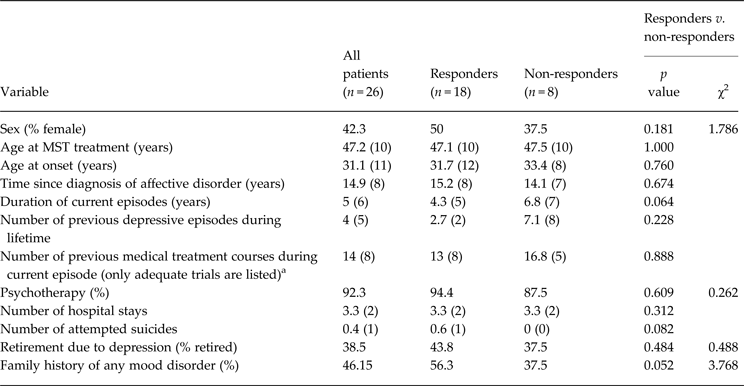
This study was approved by the Institutional Review Board of the University of Bonn and is registered at ClinicalTrials.gov with the identifier NCT00770783. We studied 26 patients (14 males and 12 females) in an open-label study design. The patients consented to participate in a clinical treatment course of MST in the Department of Psychiatry and Psychotherapy at the University Hospital of Bonn from October 2008 to February 2013 (see Table 1 for demographic characteristics). All patients provided written consent. None of the patients had received ECT, MST or transcranial magnetic stimulation (TMS) prior to the study. The flow of participants through each stage of the study is described in Fig. 1 according to Des Jarlais et al. (Reference Des Jarlais, Lyles and Crepaz2004).
Flow of participants through the study. Ten patients in this study were from a randomized trial (data were partially published previously; Kayser et al. Reference Kayser, Bewernick, Grubert, Hadrysiewicz, Axmacher and Schlaepfer2011) and 16 additional patients were treated in an open-label trial. MST, Magnetic seizure therapy.

Demographic and personality characteristics of patients

MST, Magnetic seizure therapy.
Demographic data refer to all 26 patients at baseline. Variables were measured at baseline and post-treatment.
a Adequate trials mean dose and duration of medication during 5 weeks at the maximum recommended or tolerated dose.
Data are given as mean (standard deviation) or percentage.
We decided to use a sample comprising 10 patients from our previously published study (Kayser et al. Reference Kayser, Bewernick, Grubert, Hadrysiewicz, Axmacher and Schlaepfer2011) plus 16 new patients. Thus, in our current study we report additional data from the first sample (10 MST-treated patients), namely extended neuropsychological measurements, more clinical data and FDG-PET images. The two samples differed only in the point of randomization to the condition (only the first 10 patients were randomized to receive either MST or ECT). Apart from this difference, the samples underwent the same study protocol (e.g. inclusion criteria, severity of depression, number of treatments, regular assessments). We stopped the second treatment arm (10 ECT-treated patients) because after 10 patients had been treated with either MST or ECT, we observed similar antidepressant efficacy (Kayser et al. Reference Kayser, Bewernick, Grubert, Hadrysiewicz, Axmacher and Schlaepfer2011). On account of the significantly better side-effect profile for MST, we decided to continue the study as an open-label, single-arm study.
TRD was defined according to Thase & Rush (Reference Thase and Rush1997) as patients unresponsive to two different antidepressant treatments of adequate length and dosage during the current episode of depression (TRD at stage 2). For study inclusion, a minimum score of 20 on the 28-item Hamilton Depression Rating Scale (HAMD-28) was required. Exclusion criteria included psychotic features, current clinically significant neurological disorders or medical illness affecting brain function, ferromagnetic material in the head or implanted medical devices. Participants demonstrating current or unstable remitted substance abuse (aside from nicotine), severe personality disorder or a history or diagnosis of clinically relevant cardiac disease were also excluded. A stable drug regimen (including antidepressants, neuroleptics, mood stabilizers and hypnotics) for a minimum of 4 weeks prior to study entry and during the course of the study was required. All patients met diagnostic criteria for major depressive disorder (MDD) or bipolar disorder (BP) according to an unstructured clinical interview based on DSM-IV to develop the diagnoses (APA, 1994). All patients were suffering from a current depressive episode. Patients were recruited by referral from their psychiatrist or from out-patient and in-patient clinics at the Department of Psychiatry and Psychotherapy at the University Hospital of Bonn, or through advertisement.
Clinical outcomes
Psychiatric assessments of depressive symptoms were performed 7 days before starting MST treatment (baseline) and again 7 days after completing the MST course of up to 12 treatments (post-treatment). Patients were classified after treatment as having met the criteria for response, non-response or remission. The primary outcome measure was defined as an antidepressant response (⩾50% reduction in depression symptom severity) assessed by the HAMD-28 or HAMD-17 using structured interviews relative to baseline scores, or remission (HAMD-28 score ⩽10; HAMD-17 score ⩽8) (Hamilton, Reference Hamilton1967). At baseline and post-treatment visits, secondary clinical outcome measures were determined using structured interviews and assessments that included the Montgomery–Åsberg Depression Rating Scale (MADRS; Montgomery & Åsberg, 1979), the Beck Depression Inventory (BDI; Beck, Reference Beck1987), the Hamilton Anxiety Scale (HAMA; Hamilton, Reference Hamilton1976), the Global Assessment of Functioning Scale (GAF; Jones et al. Reference Jones, Thornicroft, Coffey and Dunn1995) and the 90-item Symptom Checklist (SCL-90; Franke, Reference Franke1995). Clinically meaningful variations in psychopathology and psychological distress levels and social functioning were determined using the 36-item Short-Form Health Survey (SF-36; Ware & Sherbourne, Reference Ware and Sherbourne1992). The subscales are condensed into one score each for a physical and a mental health dimension. Additional information concerning side-effects of MST was obtained for each patient after each MST treatment using the Columbia ECT Subjective Side-Effects Schedule (CSSES; Devanand et al. Reference Devanand, Fitzsimons, Prudic and Sackeim1995). Relapse among responders was evaluated using the HAMD-28 at 6 months at the latest (follow-up visit). Responders were advised to contact the study team immediately in case of deterioration prior to this scheduled visit. Relapse criteria were a 10-point increase in HAMD-28 score at follow-up compared to post-treatment, and a minimum score of 16 on the HAMD-28 was required (Prudic et al. Reference Prudic, Olfson, Marcus, Fuller and Sackeim2004).
Neuropsychological measurements
Standardized comprehensive neuropsychological testing in the form of 23 cognitive tests was conducted with 20 patients 7 days before treatment (baseline) and 7 days after MST treatment (post-treatment). We used alternate forms of tests at baseline and post-treatment, if available, as a precautionary measure to reduce learning effects (Benedict & Zgaljardic, Reference Benedict and Zgaljardic1998). The neuropsychological tests covered general level of performance and cognitive domains such as verbal and visual–spatial learning and memory (along with working memory), language, attention, visual perception and executive function. In addition, the general level of pretreatment verbal intellectual ability was estimated using the German-language Multiple Choice Vocabulary Intelligence Test-B (Mehrfachwahl-Wortschatz-Intelligenztest-B, MWT-B; Lehrl, Reference Lehrl2005). The Mini-Mental State Examination (MMSE; Cockrell & Folstein, Reference Cockrell and Folstein1988) was used to screen for global cognitive status. The Verbal Learning and Memory Test (VLMT; Helmstaedter et al. Reference Helmstaedter, Lendt and Lux2001) and a German version of the Rey Auditory Verbal Learning Test (RAVLT), which measures declarative verbal memory, were used. The Rey Visual Design Learning Test (RVDLT; Rey, Reference Rey1964) was included to measure visual–spatial learning and memory, along with the Rey–Osterrieth Complex Figure (ROCF; Bernstein & Waber, Reference Bernstein and Waber1996) to test visual–spatial learning and memory and perceptual organization. In the VLMT and RVDLT, total learning and delayed free recall, in addition to recognition, were included. Working memory was assessed using two subtests, digit and visual memory span, from the revised Wechsler Memory Scale (WMS-R; Haerting et al. Reference Haerting, Markowitsch, Neufeld, Calabrese, Deisinger and Kessler2000). Language ability was assessed by two subtests from the German Wechsler Intelligence Test for Adults (HAWIE; Tewes, Reference Tewes1991): a verbal test (Wortschatztest) and finding similarities (Gemeinsamkeiten finden). Attention was examined with the d2 Attention and Burden Test (d2 Aufmerksamkeits-Belastungstest), for which the total performance score was used (Brickenkamp, Reference Brickenkamp1962). Visual perception using the Hooper Visual Organization Test (VOT; Hooper, Reference Hooper1958) was assessed to test ability to visually integrate objects. According to Baddeley (Reference Baddeley1990), executive functions were assessed using phonological tasks and visuospatial tasks. Phonological tasks included the Stroop Colour–Word Interference Task (Baeumler, Reference Baeumler1985), the Five-Point Test (FPT; Regard et al. Reference Regard, Strauss and Knapp1982), the Trail Making Test Part B (TMT-B; Reitan, Reference Reitan1959) and formal-lexical and semantic-categorical verbal fluency. Visuospatial tasks involved the Regensburger Word Fluency Test (RWT; Aschenbrenner et al. Reference Aschenbrenner, Tucha and Lange2000) to measure divergent thinking as a thought process to generate creative ideas by exploring many possible solutions. The Trail Making Test Part A (TMT-A; Reitan, Reference Reitan1959) enabled evaluation of processing speed.
MST procedure, seizure monitoring and anaesthesia
We used a MagPro MST device (MagVenture A/S, Denmark) with a biphasic waveform, a pulse width of 0.2 ms, and voltage 3× ~230 V/16 A (maximum power consumption 11 kVA). A twin coil was set bilaterally at the vertex. Vertex stimulation was chosen because of experience from prior MST studies suggesting reliable seizure induction (Kayser et al. Reference Kayser, Bewernick, Grubert, Hadrysiewicz, Axmacher and Schlaepfer2011; Fitzgerald et al. Reference Fitzgerald, Hoy, Herring, Clinton, Downey and Daskalakis2013) and the known failure of seizure induction by frontal stimulation (Kirov et al. Reference Kirov, Ebmeier, Scott, Atkins, Khalid, Carrick, Stanfield, O'Carroll, Husain and Lisanby2008). The stimulation amplitude was fixed at 100%, stimulation frequency at 100 Hz and the duration of stimulation was up to 10 s. The seizure threshold of each patient was measured with an initial dose titration procedure at their first session. Stimulation was provided by successively increasing the pulses per train (starting at 50 pulses and increasing each time by 50 pulses). A delay interval of at least 30 s took place between these stimulation trains of increasing pulses. The first train, which induced a tonic–clonic seizure, was defined as identifiable motor activity of at least 10 s according to Hoy et al. (Reference Hoy, Thomson, Cherk, Yap, Daskalakis and Fitzgerald2013) and was regarded as the individual patient's seizure threshold. For further treatment, stimulation was provided by using 6× pulses per train higher than the seizure threshold (i.e. high-dose MST or HD-MST; Spellman et al. Reference Spellman, McClintock, Terrace, Luber, Husain and Lisanby2008) or at the maximum output capacity of the device (1000 pulses at 100 Hz). The rationale for choosing these stimulation parameters arose from the results of prior MST studies using similar stimulation regimes that resulted in good tolerability and safety of treatments (Kirov et al. Reference Kirov, Ebmeier, Scott, Atkins, Khalid, Carrick, Stanfield, O'Carroll, Husain and Lisanby2008; Kayser et al. Reference Kayser, Bewernick, Grubert, Hadrysiewicz, Axmacher and Schlaepfer2011; Fitzgerald et al. Reference Fitzgerald, Hoy, Herring, Clinton, Downey and Daskalakis2013). Treatments were applied twice a week. Additional MST treatments and/or ECT treatments were offered in the event of a non-response to at least 12 MST treatments. Patients were offered a maximum of 22 treatments (only taken up by one patient) and they did not continue treatment following response. Seven patients underwent additional ECT treatments 14 days after the end of the regular MST treatment course (up to 12 treatments). Treatments were carried out by a psychiatrist.
Electroencephalograms (EEGs) were obtained at each treatment using a Thymatron IV (Somatics LLC, USA) with left and right frontal (Fp1 and Fp2) leads. EEGs were rated with respect to whether an adequate seizure was induced using standard methods (Krystal et al. Reference Krystal, Weiner, Coffey, Smith, Arias and Moffett1992, Reference Krystal, Weiner, McCall, Shelp, Arias and Smith1993; Nobler et al. Reference Nobler, Sackeim, Solomou, Luber, Devanand and Prudic1993; Weiner & Krystal, Reference Weiner and Krystal1993a, Reference Weiner and Krystal b ; McCall et al. Reference McCall, Robinette and Hardesty1996; Azuma et al. Reference Azuma, Fujita, Sato, Arahata, Otsuki, Hori, Mochida, Uchida, Yamada, Akechi and Furukawa2007b ). Ictal and peri-ictal EEG parameters included polyspike phase duration (from end of stimulation until start of slow wave activity), polyspike phase maximal amplitude (mean maximum amplitude), slow wave phase duration (until seizure termination), slow wave phase maximum amplitude, regularity (including global seizure strength and clonic slow wave phase, 0–6), stereotypy (global seizure patterning, 0–3, with maximum stereotypy between progression from low-amplitude chaotic polyspike activity to high-amplitude slow wave activity, occurring without bold alterability in amplitude), and post-ictal suppression (degree of post-ictal suppression, 0–3). All of these parameters were rated manually for each patient and for each treatment. Anaesthesia was initiated by intravenous propofol (124 ± 30 mg). Muscle relaxation was obtained by succinylcholine (72 ± 14 mg). Patients were ventilated with 100% oxygen by a facemask. Physiological monitoring included pulse oximetry, non-invasive blood pressure measurements and electrocardiograms (ECGs).
FDG-PET: acquisition and analysis
FDG-PET scans were performed at baseline (7 to 14 days before MST) and post-treatment. In addition, two post-treatment time points were differentiated: < 7 days = short-term (n = 3 patients; 4.7 ± 2 days) and ⩾7 days = long-term (n = 9 patients; 30.3 ± 14 days). Therefore, both short- and long-term metabolic changes as a result of MST were analysed. Furthermore, results of the responders (n = 9 patients) and non-responders (n = 3 patients) were compared. Imaging was performed on a PET/computed tomography (CT) scanner in three-dimensional (3D) mode (Biograph; Siemens Medical Solutions, Inc., USA) with a 15.8-cm axial field of view and an in-plane spatial resolution of 4.6 mm according to the European Association of Nuclear Medicine's guidelines for brain imaging using FDG-PET (Bartenstein et al. Reference Bartenstein, Asenbaum, Catafau, Halldin, Pilowski, Pupi and Tatsch2002). Blood glucose measured before tracer injection was 87 ± 11 mg/dl. The patients were positioned comfortably in a quiet, dimly lit room with eyes closed several minutes before FDG administration and during the uptake phase of FDG. Emission scans were performed 30 min after intravenous injection of ~200 MBq of FDG. The acquisition time was 20 min. Low-dose CT for attenuation correction was performed within 1 min before PET with the patient in the same position. The acquisition parameters for dual-detector helical CT were 130 kV, 16 mAs, 3 mm slice thickness, and a pitch of 1.2. Twenty-four slices were acquired (field of view = 332.8, 256 × 256 matrix, voxel size = 1.33 × 1.33 × 5.00 mm3). PET scans were acquired starting 30 min after intravenous injection of 209 ± 40 MBq of FDG. Statistical Parametric Mapping Version 5 (SPM5, Wellcome Trust Centre for Neuroimaging, University College London, UK) was used for statistical analysis. PET images were smoothed using a 3-mm full-width at half-maximum (FWHM) Gaussian kernel with time as the covariate of interest, and scaled to correct for whole-brain mean differences. Differences in voxel-wise regional cerebral metabolic rate of glucose consumption (rCMRGlc) were assessed using a general linear model (GLM) in SPM5. Corrections were made for non-sphericity due to inherent spatial autocorrelation. The resulting t map was thresholded at p < 0.05 (two-tailed) after family-wise error (FWE) correction and overlaid on SPM5 single subject's T1-weighted magnetic resonance imaging (MRI) brain template. A volume of interest (VOI) analysis was conducted in individual space using PMOD version 3.1 (PMOD Group, Switzerland). A set of macro-anatomically defined regions was drawn onto each individual brain, covering it entirely. The readout of regional FDG uptake was referenced to the entire brain uptake and then submitted for statistical analysis.
Statistical analysis
SPSS version 17.0 for Windows (SPSS Inc., USA) was used for statistical analyses. For statistical evaluation of demographic and clinical variables, we used a χ2 test for non-parametric analysis and paired t tests for parametric analysis to compare values as changes from baseline to post-treatment. The z scores were calculated based on comparisons with published age-corrected normative data to score patients’ neuropsychological performance relative to the healthy population. Findings resulting in z scores below one standard deviation (s.d.) were classified as below average, z scores of above 1 s.d. as above average. Significance in change between baseline and post-treatment was analysed using paired t tests for each neuropsychological test. A Bonferroni–Holm correction (Holm, Reference Holm1979) was applied to reduce the type I error rate due to multiple testing in clinical, neuropsychological and imaging results. Stepwise regression was calculated to examine the influence of possible contributing variables on cognitive development. The influence of several predictor variables [responder and non-responder (50% reduction criterion) measured by the HAMD-28, age and gender] on the dependent variable change score (score at baseline minus score at post-treatment) was analysed for each test. Repeated-measures ANOVAs were calculated comparing z scores at baseline and post-treatment for different domains of cognitive function. For all analyses the level of significance was set at 0.05. The effect size was calculated by clinical outcome measurements using Cohen's d (Cohen, Reference Cohen1988) and defined as small (d = 0.2), medium (d = 0.5) and large (d ⩾ 0.8). To calculate the risk of side-effects of MST compared to ECT, the number needed to treat (NNT) was analysed (Laupacis et al. Reference Laupacis, Sackett and Roberts1988). MST was defined as the new therapy and ECT served as the control therapy. We used VLMT values of the present study and the results of the Buschke Selective Reminding Test (SRT; Buschke, Reference Buschke1973) analysed in an ECT study (Sackeim et al. Reference Sackeim, Prudic, Devanand, Nobler, Lisanby, Peyser, Fitzsimons, Moody and Clark2000b ); VLMT and SRT count among the cognitive domains verbal learning and memory.
Ethical considerations
All procedures contributing to this work comply with the ethical standards of the relevant national and institutional committees on human experimentation and with the Helsinki Declaration of 1975, as revised in 2008.
Results
Demographic and clinical results
Patients were diagnosed as having treatment-resistant MDD (17 patients) or BP (eight patients had BP-II and one BP-I) with a mean current depressive episode duration of 5 ± 6 years. There were no significant differences in demographic characteristics or severity of depression between responders and non-responders in baseline values. Patients’ demographic characteristics are given in Table 1.
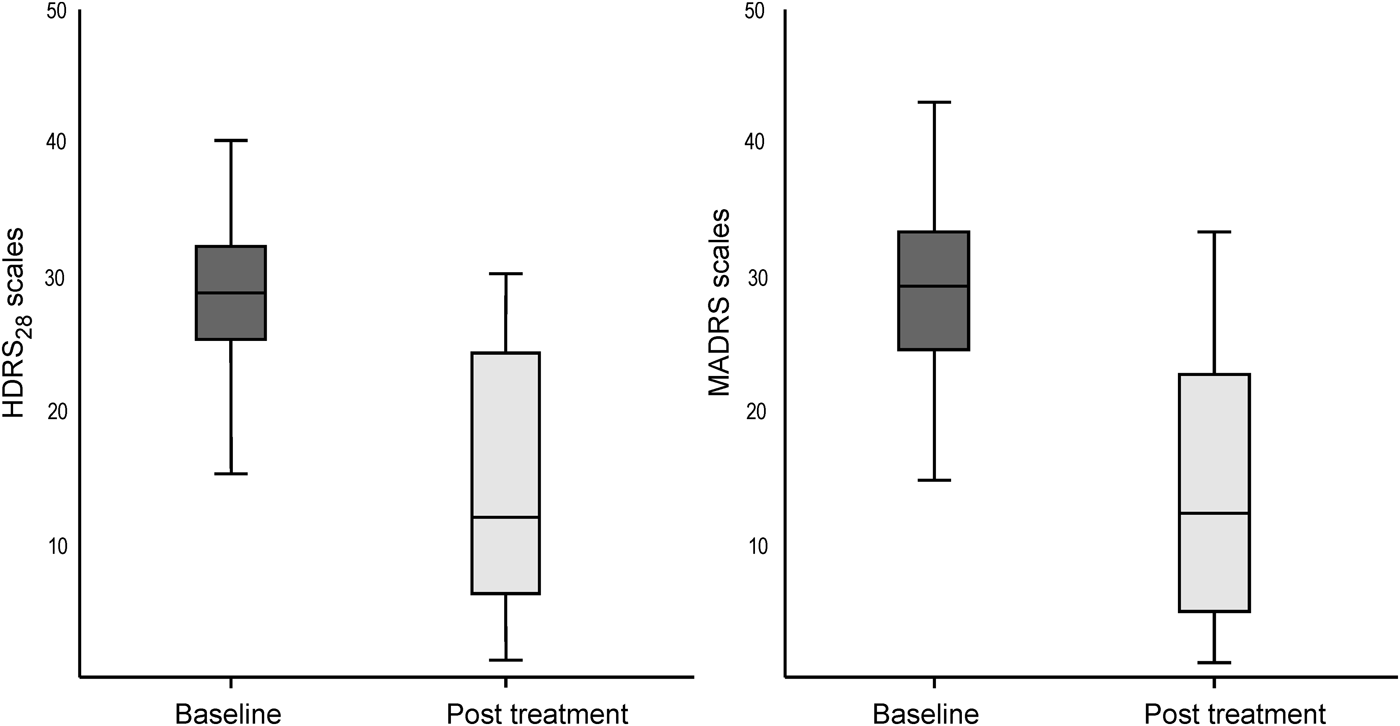
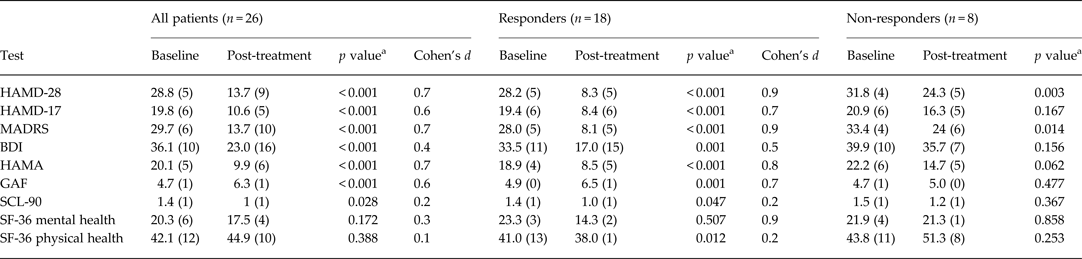
Overall, the sample showed significant improvement (p < 0.001) in scores on the HAMD-28 (see Fig. 2), HAMD-17, MADRS, BDI, HAMA, GAF and SCL-90 (p < 0.028), even when Bonferroni adjusted, but not on the SF-36 (see Table 2). Eighteen patients (69%) responded to MST as assessed by primary outcome measures (⩾50% reduction in depressive symptom severity on the HAMD-28/17). The mean HAMD-28 score declined from 28.2 ± 5 at baseline to 13.7 ± 9 post-treatment (p < 0.001), which was associated with a medium effect size measured using Cohen's d. Eight patients were classified as non-responders (see results in Table 2 and Fig. 2). Two-thirds of the responders (46.2% of the sample as a whole) met remission criteria of a HAMD-28 score < 10 or a score < 8 on the HAMD-17. All clinical outcome measures improved in responders but only a few improved in non-responders. The entire sample showed a significant reduction in anxiety symptoms as determined by the HAMA (Hamilton, Reference Hamilton1976), with an average HAMA score of 9.9 ± 6, which is far below the cut-off for anxiety disorders in pharmacological studies. The HAMA results showed a greater anti-anxiety effect in responders compared to non-responders. The responders’ scores for social functioning, measured by the GAF, changed from ‘serious impairment’ to ‘mild impairment’ whereas the non-responders’ social functioning remained at ‘seriously impaired’. Responders showed lower general psychopathology, and also lower physical and mental health scores on the SF-36. One patient suffered from migraines that were not associated with either MST or anaesthesia. Patients suffered from no additional subjective complaints (CSSES). A 100% adherence to MST and follow-up visits was shown by the patients. Of the 18 responders to MST, half of them had relapsed at or before the 6-month follow-up, mostly between the second and third months after the end of treatment (HAMD-28 score: 32 ± 4 at baseline, 10.5 ± 5 post-treatment and 26.5 ± 3 at follow-up).
Clinical outcome showing scores on the 28-item Hamilton Depression Rating Scale (HAMD-28) and the Montgomery–Åsberg Depression Rating Scale (MADRS). 95% confidence intervals (CIs) shown for depression rating scores at baseline and post-treatment.

Clinical characteristics of patients

HAMD-28/17, 28/17-Item Hamilton Depression Rating Scale; MADRS, Montgomery–Åsberg Depression Rating Scale; BDI, Beck Depression Inventory; HAMA, Hamilton Anxiety Scale; GAF, Global Assessment of Functioning Scale; SCL-90, 90-item Symptom Checklist; SF-36, Short-Form Health Survey.
a p values compare the baseline values to post-treatment values using the Bonferroni–Holm correction.
Cohen's d was defined as small (d = 0.2), medium (d = 0.5) or large (d ⩾ 0.8). The level of significance was set at p < 0.05.
Data are given as mean (standard deviation).
Neuropsychological measurements
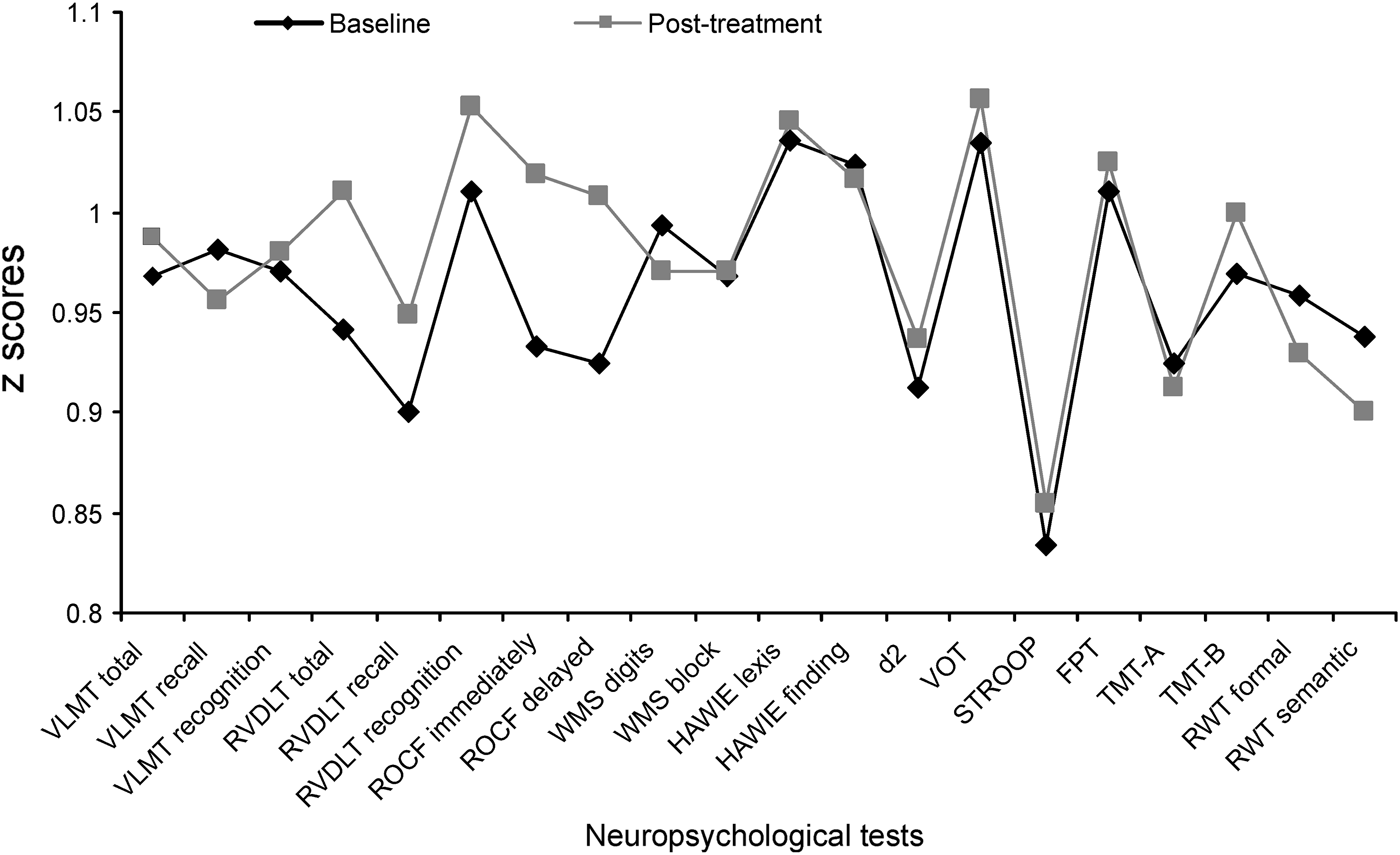
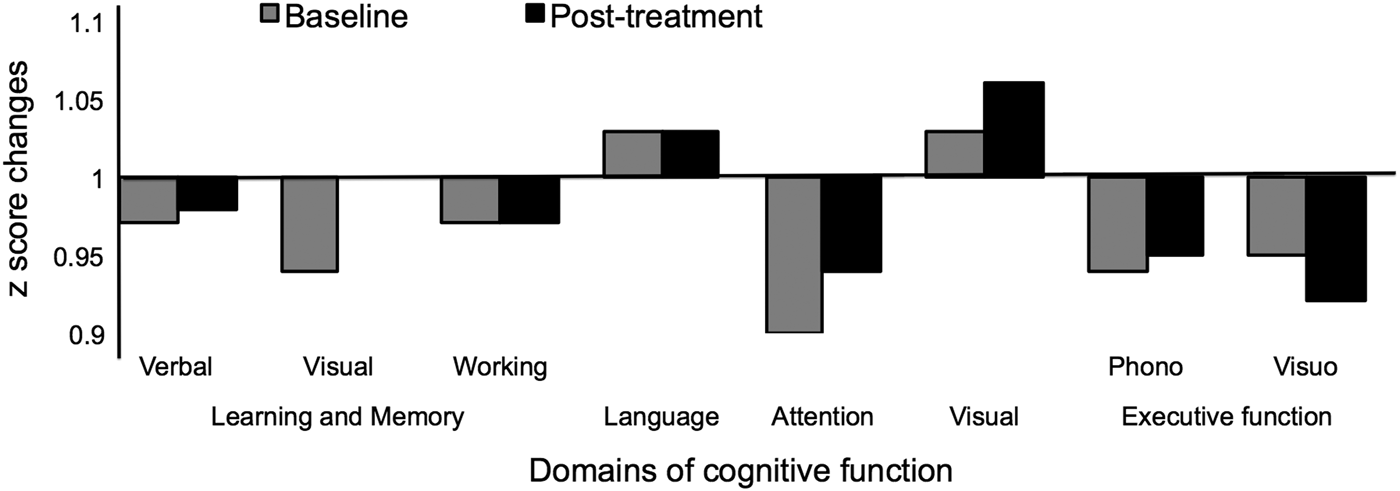
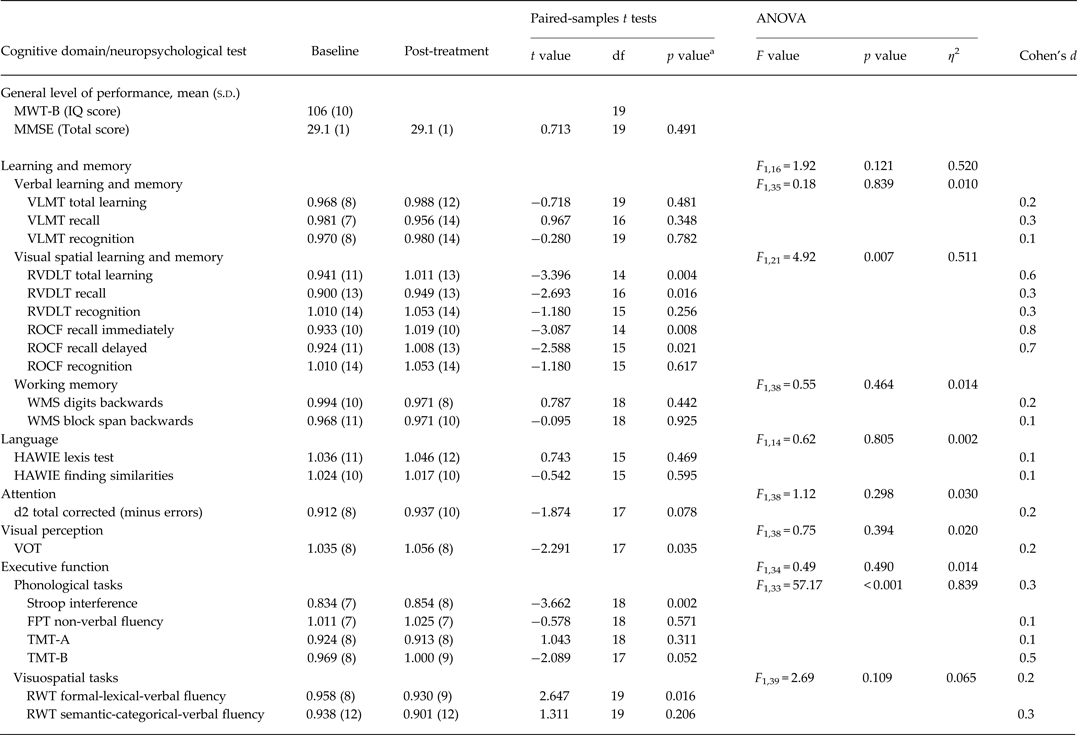
The results of the neuropsychological tests are presented in Fig. 3 and Table 3, and the results for each cognitive domain are presented in Fig. 4 and Table 3. The patients’ baseline values were below average, except those for language, visual perception and RVDLT recognition. Significant improvement post-treatment was revealed in several cognitive domains: visual–spatial learning and memory (RVDLT total learning and recall and ROCF recall immediately and delayed), visual perception (VOT) and executive function (Stroop interference and RWT formal-lexical verbal fluency). Analysing the cognitive domains by ANOVA demonstrated significantly improved visual–spatial learning and memory and phonological tasks of executive function. For RVDLT total learning, ROCF recall delayed and TMT-B, a medium effect size as measured by Cohen's d was revealed, and for ROCF recall immediately, a large effect size. For the remaining neuropsychological measurements, small effect sizes were measured.
Changes in neuropsychological tests, showing mean values of z scores in each neuropsychological test at baseline and post-treatment values. VLMT, Verbal Learning and Memory Test; VLMT total, total learning; RVDLT, Rey Visual Design Learning Test; RVDLT total, total learning; ROCF, Rey–Osterrieth Complex Figure Test; WMS, Wechsler Memory Scale; WMS digits, WMS digits backwards; WMS block, WMS block span backwards; HAWIE, Hamburg Wechsler Intelligence Test for Adults; HAWIE lexis, HAWIE lexis test; HAWIE finding, HAWIE finding similarities; d2, Attention and Burden Test, total corrected (minus errors); VOT, Hooper Visual Organization Test; FPT, Five-Point Test; TMT, Trail Making Test; RWT, Regensburger Word Fluency Test; RWT formal, RWT formal-lexical-verbal fluency; RWT semantic, RWT semantic-categorical-verbal fluency. Two-tailed paired t tests (Bonferroni adjusted) were used. *p value < 0.05.

Changes in cognitive domains. Mean z scores of the cognitive domains are presented at baseline and post-treatment including learning and memory [verbal learning and memory (Verbal), visual spatial learning and memory (Visual) and working memory (Working)], language, visual perception, attention and executive functions [phonological (Phono) and visuospatial (Visuo) tasks]. s.d., Standard deviation. Repeated-measures ANOVAs with the factor time (at baseline in comparison to post-treatment) separate for cognitive domains were used. *p value < 0.05.

Neuropsychological assessment of cognitive changes from baseline to post-treatment

MWT-B, German-language Multiple Choice Verbal Intelligence Test-B; MMSE, Mini-Mental State Examination; VLMT, Verbal Learning and Memory Test; RVDLT, Rey Visual Design Learning Test; ROCF, Rey–Osterrieth Complex Figure Test; WMS, Wechsler Memory Scale; HAWIE, Hamburg-Wechsler Intelligence Test for Adults; d2, Attention and Burden Test; VOT, Hooper Visual Organization Test; FPT; Five-Point Test; TMT, Trail Making Test; RWT, Regensburger Wortflüssigkeits-Test; df, degrees of freedom; s.d., standard deviation.
The analysis involved 20 magnetic seizure therapy (MST)-treated patients with treatment-resistant depression (TRD).
Two-tailed paired t tests with scores at baseline and post-treatment within each test as dependent variables.
a Bonferroni adjusted.
ANOVAs for repeated measures with the factor time (baseline in comparison to post-treatment) separate for cognitive functions.
Effect sizes were measured using Cohen's d.
z scores are presented as mean (s.d.); z scores of neuropsychological tests were based on published normative data.
Level of significance was set at p < 0.05.
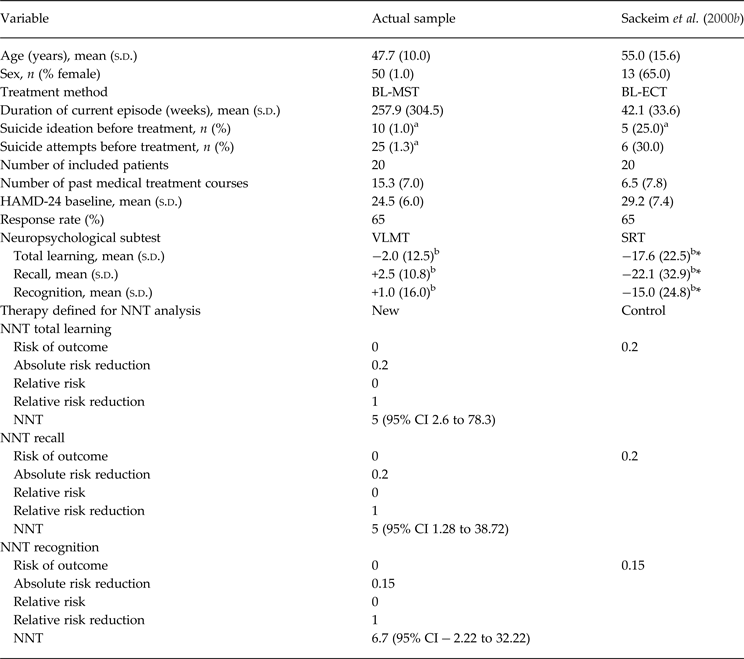
With regard to general level of performance, no signs of impairments were shown. For learning and memory, that is for the subtest RVDLT total learning and recall, and also for ROCF recall immediately and delayed, significant improvement occurred, even by ANOVA. In RVDLT total learning, ROCF recall immediately and delayed showed an improvement from below average to above average when assessed. Within the other subtests (VLMT total learning, recall and recognition, RVDLT and ROCF recognition, WMS digits backwards and WMS block span backwards), the recognition results remained the same. Values for language and attention were also unchanged. For visual perception, the paired t test (Bonferroni adjusted) revealed a small but significant improvement within the VOT. With regard to executive function, patients showed significant improvement in interference (Stroop). By contrast, decline in performance in verbal fluency was noted. Within the TMT-B the results improved from below average to average. Performances on the FPT, TMT-A and RWT semantic-categorical verbal fluency remained unchanged. Analysis of phonological tasks (Stroop, FPT, TMT-A and TMT-B) by ANOVA showed significant changes whereas visuospatial tasks (RWT formal-lexical verbal fluency and semantic-categorical verbal fluency) were not significantly different by ANOVA. However, a decline in performance of RWT formal-lexical verbal fluency was measured. Stepwise regression analyses revealed no relevant predictor variable [outcome (HAMD-28), age and gender] for change in values in each neuropsychological test. In some domains we observed cognitive improvement. This effect was not correlated with depressive symptoms, age or gender. Detailed results of the NNT analysis are presented in Table 4. In total, in the case of total learning and recall 5 patients and in the case of recognition 6.7 patients must be treated with MST to prevent one adverse event that would have occurred under ECT.
Number needed to treat (NNT) analyses

HAMD-24, 24-Item Hamilton Depression Rating Scale; BL-MST; bilateral magnetic seizure therapy; BL-ECT, bilateral electroconvulsive therapy; VLMT, Verbal Learning and Memory Test; SRT, Buschke Selective Reminding Test (VLMT and SRT count among the cognitive domains ‘verbal learning and memory’); s.d., standard deviation; CI, confidence interval.
NNT analyses were performed to calculate the risk of side-effects of MST as a new therapy compared to ECT as treatment as usual.
a Indicates a score of ≥3 on the HAMD suicidal item.
b Mean (s.d.) for the percentage change from baseline to post-treatment.
Level of significance was set at 0.05 (*p < 0.05).
Seizure monitoring
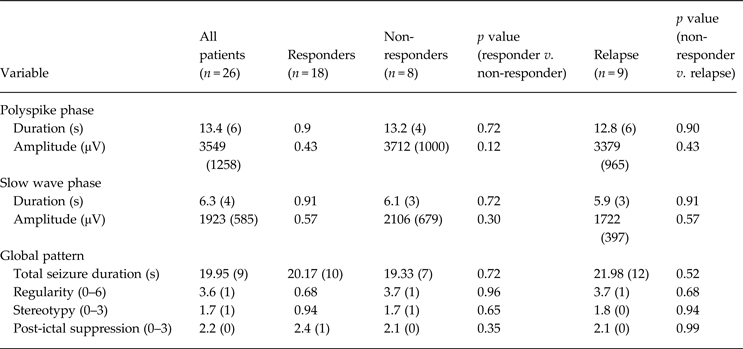
Mean stimulation parameters were set at 650 ± 62 pulses per train, 6.5 ± 1 s stimulation duration, 100 Hz and 100% amplitude. Detailed seizure characteristics are shown in Table 5. The results were non-homogeneous as they were associated with large standard deviations, but ictal characteristics of seizure (e.g. duration of ictal phases, post-ictal suppression) were defined as adequate. No significant differences between responders and non-responders or between non-responders and relapse patients were detected. The duration of seizures was stable throughout the treatment course because of the stimulation parameters chosen. Seizures were successfully elicited in all patients for all treatments.
Seizure characteristics as assessed with EEGs of responders, non-responders and relapsed patients

EEG, Electroencephalogram.
Ictal and peri-ictal EEG parameters were compared using a paired t test and manually rated in each patient and each treatment. Polyspike phase duration was defined as time from end of stimulation to beginning of slow wave activity; slow wave phase duration occurred until seizure termination; amplitudes were maximum amplitudes. Global seizure pattern was rated with respect to stereotypy: highest stereotypy (3) was rated when activity proceeded from low amplitude chaotic polyspike activity to high amplitude slow wave without a major change in amplitude; regularity describes slow wave activity; post-ictal suppression was rated from 0 (minimally suppressed) to 3 (very flat with sudden ending).
Data are presented as mean (standard deviation).
The treatment course contained an average of 12 treatments (mean 12.0 ± 3, range 10–22). After completing this study, additional MST treatments were given to four patients (16–22 treatments in total) who were non-responders to MST. Subsequent ECT treatments were given to seven non-responders. Five of the non-responders did not want to undergo further MST treatment and one non-responder declined subsequent ECT treatment. ECT treatments were administered using six times the seizure threshold for unilateral and three times for bilateral (BL) stimulation. However, ECT was also ineffective with respect to clinical outcome in the seven non-responders.
Metabolic effects of MST (PET)
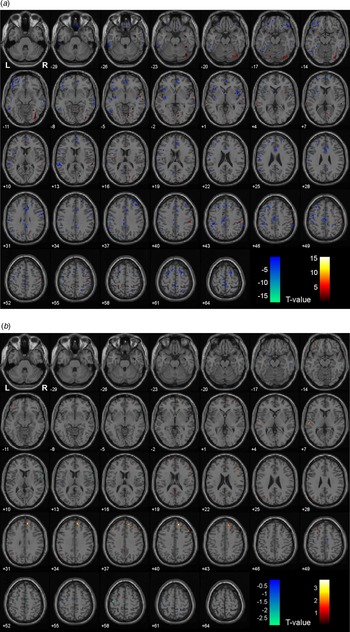
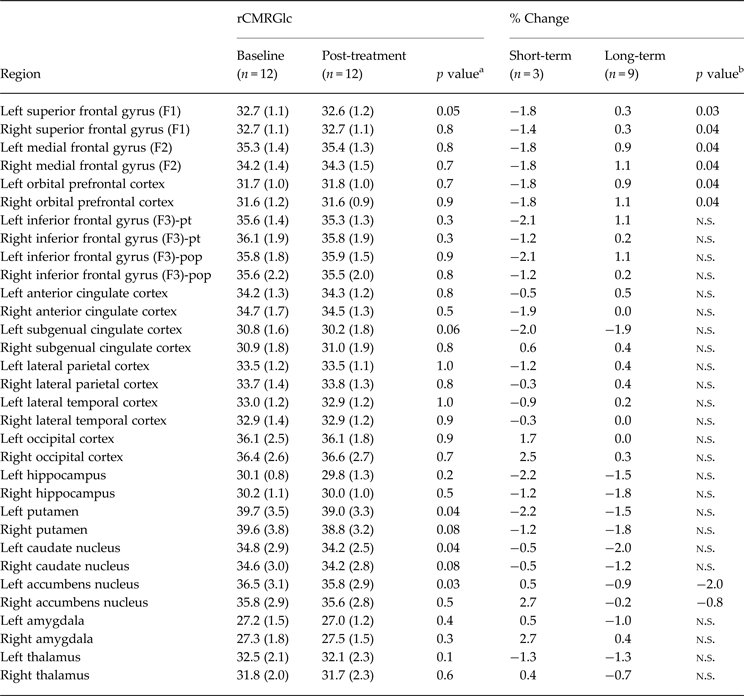
Brain metabolic effects in 12 patients (age 46.2 ± 10 years, four females) were analysed by PET. SPM analysis demonstrated widespread changes in metabolic activity in cortical and subcortical areas as an effect of MST (see Table 6 and Fig. 5 a,b). Areas of significant increase involved the frontal cortex bilaterally, whereas the left striatum (caudate nucleus and putamen) displayed a significant decrease. Focal changes detected by SPM in the left frontal cortex were accompanied by constant global rCMRGlc. No significant inter-hemispheric differences were detected for any region of interest (ROI). An average change in rCMRGlc of cerebral grey matter was −0.3% for the left and right hemispheres. The number of MST sessions did not correlate with any regional change in rCMRGlc. In the long-term subgroup, the right frontal (+0.8% v. −1.8%, p = 0.02), right putaminal (−0.8% v. −5.4%, p = 0.01) and right insular (+0.4% v. −4.0%, p = 0.02) rCMRGlc values were significantly differentiated between the responders and non-responders.
[18F]-Fluorodeoxyglucose positron emission tomography (FDG-PET) analysis of (a) short-term (< 7 days) and (b) long-term (⩾7 days) metabolic changes. Shown are series of axial sections demonstrating the SPM5 analyses of voxel-wise paired t tests (p = 0.05) comparing FDG-PET images performed before the start of magnetic seizure therapy (MST) treatment (baseline) and after the MST treatment course was completed (post-treatment). Increases are displayed in the red and yellow portions of the colour scales and decreases in the blue portions. L and R denote the first planes left and right respectively. Images underwent proportional scaling to the global mean and correction for non-sphericity.

FDG-PET imaging: results of VOI-based analysis

FDG-PET, [18F]-Fluorodeoxyglucose positron emission tomography; rCMRGlc, regional cerebral metabolic rate of glucose consumption; VOI, volume of interest; pt, pars triangularis; pop, pars opercularis; n.s., non-significant.
The average radioactivity concentration of the entire brain was normalized to 30 ml/min/100 g tissue.
a Significance levels resulting from a two-sided paired t test.
b Significance levels resulting from a one-sided two-sample t test.
Bonferroni–Holmes correction for multiple comparisons were conducted.
Data are given as mean (± standard deviation).
Discussion
This study demonstrates a clear antidepressant effect of MST in patients suffering from severe TRD. MST was also associated with lowered anxiety and an increase in quality of life in responders. No evidence of deterioration in cognition and memory was found. On the contrary, improvements in the cognitive domains of visual–spatial learning and memory, visual perception and executive function were demonstrated. This is of major importance because learning and memory are often impaired following ECT (Sackeim et al. Reference Sackeim, Prudic, Devanand, Nobler, Lisanby, Peyser, Fitzsimons, Moody and Clark2000b ). Furthermore, cognitive side-effects are among major causes for non-adherence to ECT (Bernstein et al. Reference Bernstein, Beale, Berns and Kellner1998; Fink, Reference Fink2001). In addition, using FDG-PET we observed, as an effect of MST, changes in glucose metabolism in brain regions that have frequently been reported as dysfunctional in depression.
Approximately 70% of the patients responded to MST, despite having presented with very severe depression at baseline (APA, 2000). Only a few patients with severe depression have been treated in prior clinical trials solely with MST because MST is still in an early phase of clinical research. For this reason both the results published earlier and our results presented here have limitations in their generalization ability. Three case reports have suggested significant response after treatment (Kosel et al. Reference Kosel, Frick, Lisanby, Fisch and Schlaepfer2003; Kayser et al. Reference Kayser, Bewernick, Axmacher and Schlaepfer2009). Two larger clinical studies have reported a 50% response rate in 20 patients (Kayser et al. Reference Kayser, Bewernick, Grubert, Hadrysiewicz, Axmacher and Schlaepfer2011; Fitzgerald et al. Reference Fitzgerald, Hoy, Herring, Clinton, Downey and Daskalakis2013). In another study all 10 patients studied showed a significant reduction in depression symptoms (White et al. Reference White, Amos, Zhang, Stool, Husain, Thornton, Downing, McClintock and Lisanby2006). Thus, the response rates in this study were unexpected. This could possibly be attributed to several variables (e.g. severe depression, anxiety, suicidal risk and recurrent episodes) that were identified in our sample that may be associated with greater levels of treatment resistance (Schlaepfer et al. Reference Schlaepfer, Agren, Monteleone, Gasto, Pitchot, Rouillon, Nutt and Kasper2012) and ‘anxious depression’ (Trivedi et al. Reference Trivedi, Rush, Wisniewski, Nierenberg, Warden, Ritz, Norquist, Howland, Lebowitz, McGrath, Shores-Wilson, Biggs, Balasubramani and Fava2006). However, the current response rates were similar to response rates following BL-ECT as treatment for the usual resistance forms of depression (Sackeim et al. Reference Sackeim, Prudic, Devanand, Kiersky, Fitzsimons, Moody, McElhiney, Coleman and Settembrino1993; Husain et al. Reference Husain, Rush, Fink, Knapp, Petrides, Rummans, Biggs, O'Connor, Rasmussen, Litle, Zhao, Bernstein, Smith, Mueller, McClintock, Bailine and Kellner2004). Both methods elicited secondary generalized seizure activity, which is thought to be responsible for the antidepressant efficacy (Sackeim, Reference Sackeim1999). MST reliably induced generalized seizures in all treatments. Furthermore, the response rate in this study is of particular importance compared to other treatments for TRD (e.g. antidepressant medication, which has moderate rates of response of approximately 22–30%; Trivedi et al. Reference Trivedi, Rush, Wisniewski, Nierenberg, Warden, Ritz, Norquist, Howland, Lebowitz, McGrath, Shores-Wilson, Biggs, Balasubramani and Fava2006). Thus, a safe and highly effective alternative treatment strategy to usual treatments would be relevant for severely depressed patients. Moreover, of great clinical importance is the observation that in our patient sample anxiety occurred in the context of depression. In clinical practice, reducing anxiety is important because it correlates with patients’ perceptions and quality of life (Mendlowicz & Stein, Reference Mendlowicz and Stein2000). This was also reflected in patients’ subjective reports in our study. The high relapse rates during the long observational period (6 months of follow-up) are in line with the ECT literature (Sackeim et al. Reference Sackeim, Haskett, Mulsant, Thase, Mann, Pettinati, Greenberg, Crowe, Cooper and Prudic2001; Prudic et al. Reference Prudic, Olfson, Marcus, Fuller and Sackeim2004). However, these relapse rates are lower compared with other treatments such as psychotherapy or pharmacotherapy in TRD, which are associated with relapse rates of up to 60% for first-episode patients and 90% for third-episode patients (APA, 2001). Given the experience in the field of maintenance ECT and our experience with MST, we suggest that maintenance MST could be as helpful in preventing relapses as maintenance ECT (Kimball et al. Reference Kimball, Rosenquist, Dunn and McCall2009). A further point of interest is that our non-responder, who subsequently underwent ECT treatments after MST, also did not benefit from the ECT treatments. To date, there are few studies that have focused on possible predictors for worse outcome to a single treatment in TRD patients. It is also not clear why some patients respond to a treatment, while others do not (Fava et al. Reference Fava, Ruini and Mangelli2001). Variables such as the number of previous episodes, duration of current depressive episode or severity of depression maintain TRD (Fava et al. Reference Fava, Ruini and Mangelli2001; Warden et al. Reference Warden, Trivedi, Wisniewski, Davis, Nierenberg, Gaynes, Zisook, Hollon, Balasubramani, Howland, Fava, Stewart and Rush2007, Reference Warden, Rush, Wisniewski, Lesser, Kornstein, Balasubramani, Thase, Preskorn, Nierenberg, Young, Shores-Wilson and Trivedi2009; Paykel, Reference Paykel2008; Fekadu et al. Reference Fekadu, Wooderson, Markopoulo, Donaldson, Papadopoulos and Cleare2009; Schlaepfer et al. Reference Schlaepfer, Agren, Monteleone, Gasto, Pitchot, Rouillon, Nutt and Kasper2012). Thus, our sample fulfilled all of the above-mentioned criteria. However, the question remains regarding why patients respond neither to MST nor to subsequent ECT with the assumption that both MST and ECT are convulsive stimulation methods with similar clinical outcomes, as we have demonstrated in our results. Thus, response (or not) to a treatment could be based on similar mechanisms of action for both convulsive treatment methods.
In addition to efficacy, tolerability and cognitive safety were further focuses in this study. Using a large comprehensive battery of neuropsychological tests, essentially no negative effect on cognition following MST was found, except for a slight decline in performance in verbal fluency; the latter remained within the norm. We found a trend towards improvement in most cognitive functions, which may resemble reversal of baseline deficits in depressed patients (Austin et al. Reference Austin, Mitchell and Goodwin2001). This is remarkable because we found no influence of improvement in depression to positive cognitive changes in analogy to prior studies (Rush et al. Reference Rush, Weissenburger, Vinson and Giles1983; McNeely et al. Reference McNeely, Mayberg, Lozano and Kennedy2008). Thus, MST did not result in a lack of cognitive impairment but rather in an improvement. Following ECT, autobiographical retrograde amnesia has been reported as a major concern (Rose et al. Reference Rose, Fleischmann, Wykes, Leese and Bindman2003; Sackeim et al. Reference Sackeim, Prudic, Fuller, Keilp, Lavori and Olfson2007), but its objective quantification remains problematic (Fraser et al. Reference Fraser, O'Carroll and Ebmeier2008; Kirwan et al. Reference Kirwan, Bayley, Galvan and Squire2008; Semkovska & McLoughlin, Reference Semkovska and McLoughlin2010). In a recent study no impairment in autobiographical memory following MST was indicated (Fitzgerald et al. Reference Fitzgerald, Hoy, Herring, Clinton, Downey and Daskalakis2013). However, we used a hippocampal-dependent measure. The VLMT enables specific examination of hippocampal-dependent declarative memory including learning performance, in addition to more frontal lobe-associated encoding recall and recognition tasks, and in the neuropsychological tests assessing hippocampal function, no impairment was detected after MST. Moreover, frontal lobe dysfunction is currently thought to be involved in prevalent, persistent retrograde memory impairments following ECT (Sackeim, Reference Sackeim2000; Sackeim et al. Reference Sackeim, Luber, Moeller, Prudic, Devanand and Nobler2000a ). These retrograde memory impairments following ECT might be related more to frontal lobe impairment than to medial temporal lobe activation changes, which is largely consistent with previous research proposing a limbic-cortical dysregulation model of depression (Mayberg, Reference Mayberg2003). In line with these findings, we found an improvement in executive function across several tests that were associated with frontal lobe function, although our conclusions are limited because of the small sample size and trend-level findings. According to a systematic review from the British ECT Review Group (2003), differences in ECT modalities may explain variations in cognitive impairment; thus, BL-ECT produced the greatest impairments, along with treatment at least three times a week, and high-dose rather than low-dose ECT. However, BL-ECT is the most effective treatment in severe depression, with response rates varying from 65% (Sackeim & George, Reference Sackeim and George2008) to 79% (Husain et al. Reference Husain, Rush, Fink, Knapp, Petrides, Rummans, Biggs, O'Connor, Rasmussen, Litle, Zhao, Bernstein, Smith, Mueller, McClintock, Bailine and Kellner2004). By contrast, the current MST application was bilateral and the most effective stimulation parameters were high dose (HD-MST), but these led to no cognitive impairment (Kirov et al. Reference Kirov, Ebmeier, Scott, Atkins, Khalid, Carrick, Stanfield, O'Carroll, Husain and Lisanby2008; Kayser et al. Reference Kayser, Bewernick, Grubert, Hadrysiewicz, Axmacher and Schlaepfer2011). Given the present positive results for cognition and the robust antidepressant effect of MST, it would be appropriate to conduct MST without titration of the seizure threshold at the first treatment by immediately using HD-MST. Therefore, improvement in depression symptoms may occur earlier by applying MST more than two or three times a week. These characteristics of MST are reported to lead to high patient adherence to MST, which was also demonstrated in the current study.
Structural changes in major depression have been suggested in the prefrontal cortex (PFC), subgenual cingulate cortex (Cg25) (Ressler & Mayberg, Reference Ressler and Mayberg2007), amygdala, divisions of the thalamus, and striatum (Drevets, Reference Drevets2001). In particular, an increase in frontal activity in depression as found here has been reported frequently in ECT studies (Silfverskiold et al. Reference Silfverskiold, Gustafson, Risberg and Rosen1986; Guze et al. Reference Guze, Baxter, Schwartz, Szuba and Liston1991; Drevets, Reference Drevets2001; Nobler et al. Reference Nobler, Oquendo, Kegeles, Malone, Campbell, Sackeim and Mann2001; Awata et al. Reference Awata, Konno, Kawashima, Suzuki, Sato, Matsuoka, Fukuda and Sato2002; Takano et al. Reference Takano, Motohashi, Uema, Ogawa, Ohnishi, Nishikawa, Kashima and Matsuda2007) and in a recently published imaging study using MST (Hoy et al. Reference Hoy, Thomson, Cherk, Yap, Daskalakis and Fitzgerald2013). Thus, our results are in line with these reported data and are also concordant with the hypothesis that depression arises from limbic-cortical dysregulation (Mayberg, Reference Mayberg2003), showing relative regional changes in limbic areas (e.g. pallidum and striatum) and in cortical/subcortical areas (e.g. the frontal cortex and Cg25). Thus, the FDG-PET results were in line with our robust clinical findings.
As mentioned, MST is still in an early phase of clinical testing. Therefore, current application of MST can only be justified as a method of last resort in severely compromised patients under non-randomized and non-blinded conditions, both of which limit the generalizability of our results. Larger randomized and blinded clinical trials validating the efficacy of MST are warranted. An optimal study design would be a double-blind, cross-over design involving a comparison of treatments for severe depression in pharmacologically treated and ECT-treated groups. In addition, new studies should consider whether including a sham condition is ethically justified, as the lack of a sham-controlled group is a major limitation of this study, as with other published studies. However, we consider that placebo effects did not play a major role in these truly depressed patients as it is known that the probability of eliciting a placebo response decreases with treatment resistance at baseline (Schatzberg & Kraemer, Reference Schatzberg and Kraemer2000).
Identifying markers to predict response to MST may result in better selection of patients and enable such patients to benefit from MST at an earlier stage. In addition, in future research the influence of different classes of medication at different doses should be included. In cases of a relapse, maintenance MST could be helpful, as has been shown for ECT (Kimball et al. Reference Kimball, Rosenquist, Dunn and McCall2009). Appropriate funding in large multi-centre studies may be useful to replicate clinical efficacy and to identify further characteristics of MST, including more imaging results, cognition studies, EEGs and modes of action. It is also important to improve MST devices for use in physicians’ offices and hospitals. Finally, the problematic history of ECT in terms of public opinion should not be forgotten. In our 10 years’ experience with applying MST in a framework of clinical studies, we had the impression that MST is associated with a far lower degree of stigma than is ECT. Thus, standardized use of MST would allow TRD patients to receive an effective treatment at an earlier phase of the disease.
Furthermore, potential practice effects, which alone can improve performance, should be excluded by using alternate forms of any of the neuropsychological tests. A sham-controlled group could also be implemented. Thus, practice effects could be limited if neuropsychological tests were used at two different time points within weeks (baseline and post-treatment) (McCaffrey et al. Reference McCaffrey, Duff and Westervelt2000). Although we did not measure improvement on all neuropsychological tests, improvements should be equal if repeated testing results in practice effects (Parsons et al. Reference Parsons, Tucker, Hall, Robertson, Eron, Fried and Robertson2006). Several tests applied have been found to have negligible practice effects (e.g. measuring language, working memory, executive functions and attention) (Dikmen et al. Reference Dikmen, Heaton, Grant and Temkin1999; Wilson et al. Reference Wilson, Watson, Baddeley, Emslie and Evans2000). Certain characteristics of patients are thought to be potential factors in advancing the incidence of practice effects, such as younger participants (< 39 years), as indicated by better baseline performance (Dikmen et al. Reference Dikmen, Heaton, Grant and Temkin1999). However, our sample was composed of higher-aged patients who mostly perform below average at baseline, with the result that, in general, practice effects did not occur. Finally, we cannot ignore the possibility of the involvement of practice effects in some neuropsychological tests. However, for the above-mentioned reasons, we assume that the influence is subsidiary. Thus, practice effects alone do not explain our results. Despite these limitations, this current study is an important step towards demonstrating the efficacy and cognitive safety of MST.
Overall, we were able to confirm the data of MST published by others (Lisanby et al. Reference Lisanby, Luber, Schlaepfer and Sackeim2003; Fitzgerald et al. Reference Fitzgerald, Hoy, Herring, Clinton, Downey and Daskalakis2013) and reported previously by our group (Kayser et al. Reference Kayser, Bewernick, Axmacher and Schlaepfer2009; Kayser et al. Reference Kayser, Bewernick, Grubert, Hadrysiewicz, Axmacher and Schlaepfer2011). The results of this study indicate once again that MST is an effective and safe (cognitively) alternative treatment method for TRD.
Acknowledgements
This investigator-initiated study was funded in part (funding of the MST device) by a grant from MagVenture A/S Inc. to T.E.S. The sponsor had no influence on the design or conduct of the study, on the collection, management, analysis and interpretation of the data, or on the preparation, review or approval of the manuscript. T.E.S. has full access to all of the data in the study and takes responsibility for the integrity of the data and the accuracy of the data analysis. We thank the patients and their relatives for participating in this study.
Declaration of Interest
S.K. has received support for lectures and a grant from MagVenture A/S Inc. R.H. has received support from a German Research Foundation (DFG) grant (HU1302/2-2) and a Starting Independent Researcher Grant provided jointly by the Ministry of Innovation, Science, Research and Technology of the German State of North Rhine-Westphalia (MIWFT) and the University of Bonn. M.S. has received honoraria for lectures from Covidien Germany (Neustadt/Donau, Germany). The rest of the authors report no conflicts of interest.