I. INTRODUCTION
Negative stiffness honeycombs are periodic arrangements of unit cells that buckle elastically when subjected to mechanical loading that exceeds a designed threshold. In the configuration considered in this paper and illustrated in Fig. 1(a), the honeycomb comprises multiple rows and columns of curved beams that are extruded out of the plane of the honeycomb. As the honeycomb is subjected to in-plane compressive loading [Fig. 1(b)], the honeycomb exhibits positive in-plane mechanical stiffness followed by a region of serrated plateau stress in which each row of the curved beams successively snaps from one first-mode-buckled shape to another. Under displacement-controlled loading, this snap-through behavior manifests itself as regions of negative stiffness in the force–displacement plot. The number of snap-through events is equivalent to the number of rows of curved beams in the honeycomb and the order in which the snap-through events occur depends on minor imperfections in the as-built honeycomb. The magnitude of the force threshold is directly proportional to the number of columns of curved beams and depends on the shape of each beam, specifically its length, in-plane thickness, out-of-plane depth, and apex height (see Refs. Reference Correa, Klatt, Cortes, Haberman, Kovar and Seepersad1–Reference Qiu, Lang and Slocum3). If the geometry is properly designed, the honeycomb will return to its initial configuration upon release of the load.
(a) Negative stiffness honeycombs undergoing stage-wise compression. The honeycomb returns to its initial configuration (far left) upon release of the compressive load. The specimen pictured here includes 4 rows and 2 columns of curved beams fabricated in nylon. (© Emerald Publishing Limited, all rights reserved) (b) Experimental mechanical response of the nylon NS honeycomb specimen illustrated in Figure 1a subjected to quasi-static, displacement controlled compression tests at a strain rate of approximately 10−4 s−1. The labels match the five snapshots in Figure 1a. (c) In addition to adjusting the number of rows and columns of curved beams, the dimensions of each curved beam are adjusted to achieve targeted mechanical performance. Images adopted from [1] [2].

As described in previous publications, Reference Correa, Klatt, Cortes, Haberman, Kovar and Seepersad1,Reference Correa, Seepersad and Haberman2 these negative stiffness honeycombs provide several advantages for shock isolation applications. Like conventional positive stiffness honeycombs, Reference Gibson and Ashby4–Reference Papka and Kyriakides6 negative stiffness honeycombs exhibit a region of positive stiffness followed by a region of plateau stress as the rows of curved beams buckle sequentially. This region of plateau stress provides nearly ideal shock isolation, which is defined as energy absorption at a constant force level or threshold. Reference Balandin, Bolotnik and Pilkey7 Force thresholding allows the honeycomb to absorb energy without imparting increasing levels of force or acceleration to an isolated object, as would be the case with a positive stiffness system such as a linear spring. The force threshold at which buckling occurs can be designed with either conventional or negative stiffness honeycombs by adjusting the unit cell geometry and arrangement, thereby tailoring the maximum force imparted to an isolated object. With negative stiffness honeycombs, however, the force thresholding behavior is achieved with elastic buckling, rather than plastic buckling, and is therefore recoverable.
Similar honeycombs with negative stiffness or snap-through behavior have been investigated for recoverable energy absorption or state transformation. Pontecorvo et al. Reference Pontecorvo, Barbarino, Murray and Gandhi8 suggest using arrays of bistable arches for shape-morphing applications. They also build upon the underlying work of Qiu et al., Reference Qiu, Lang and Slocum3 who analyze the mechanical properties of the curved beams that compose these honeycombs, by experimentally investigating the behavior of similarly curved beams with nonrigid boundary conditions. Restrepo et al. Reference Restrepo, Mankame and Zavattieri9 provide analytical equations for predicting the stress–strain behavior and loss factor of phase transforming cellular materials, which comprise arrays of curved beams similar to those described in this paper and in previous studies by the authors, Reference Correa, Klatt, Cortes, Haberman, Kovar and Seepersad1,Reference Correa, Seepersad and Haberman2 as a function of cell geometry and numbers of cells. They experimentally validate their findings with a quasistatic compression test of an additively manufactured honeycomb. Rafsanjani et al. Reference Rafsanjani, Akbarzadeh and Pasini10 also illustrate the snapping behavior of honeycombs or metamaterials configured as arrays of bistable curved beams that are centrally clamped and snap between two stable configurations. They focus specifically on quasistatic behavior under tension with large strains and bistability. Che et al. Reference Che, Yuan, Wu, Qi and Meaud11 demonstrate that small variations in the geometry of each row or layer of curved beams can be used to prescribe a deterministic deformation or snap-through sequence among the rows. Shan et al. Reference Shan, Kang, Raney, Wang, Fang, Candido, Lewis and Bertoldi12 achieve similar negative stiffness behavior via bistable elastic elements in the form of tilted beams. They focus specifically on bistability as a means of trapping elastic strain energy in a recoverable way. Haghpanah et al. Reference Haghpanah, Salari-Sharif, Pourrajab, Hopkins and Valdevit13 design similar multistable metamaterials comprised of bistable triangular units, but in a notable extension to the work of Shan et al., Reference Shan, Kang, Raney, Wang, Fang, Candido, Lewis and Bertoldi12 they arrange them in not only two-dimensional but also three-dimensional units. Frenzel et al. Reference Frenzel, Findeisen, Kadic, Gumbsch and Wegener14 arrange curved beams into three-dimensional units that are periodically repeated to create metamaterials with negative stiffness behavior. Izard et al. Reference Izard, Alfonso, McKnight and Valdevit15 place negative stiffness elements in parallel and series with positive stiffness elements to achieve hysteretic damping from two- or three-dimensional negative stiffness elements. Harne et al. Reference Harne, Wu and Wang16 also show how negative stiffness elements can be placed in series with positive stiffness elements to generate hysteretic behavior and demonstrate that placing multiple negative–positive stiffness units in parallel enables highly adaptive force–displacement behavior. Duoss et al. Reference Duoss, Weisgraber, Hearon, Zhu, Small, Metz, Vericella, Barth, Kuntz, Maxwell, Spadaccini and Wilson17 introduce metamaterials with negative stiffness under shear loading, and Hewage et al. Reference Hewage, Alderson, Alderson and Scarpa18 combine negative stiffness with auxetic behavior.
Unlike previous publications, which focused exclusively on quasistatic mechanical behavior of these structures, Shan et al. Reference Shan, Kang, Raney, Wang, Fang, Candido, Lewis and Bertoldi12 also performed impact tests by dropping the samples from various heights and demonstrated rate-independent force thresholds across the quasistatic compression and impact tests for their bistable materials. For comparison purposes, they also tested a configuration with snap-through behavior but no bistability, but they did not experimentally investigate different materials, impact conditions, or geometries, such as the curved beam shapes investigated by other authors. This paper addresses those research objectives as part of an experimental investigation of the mechanical properties of curved beam honeycombs under impact conditions. The focus is on fully recoverable honeycombs with a single stable state. Unlike bistable variants, these honeycombs recover their initial configuration without requiring an externally applied reset load, making them highly suitable for applications involving successive impacts.
II. EXPERIMENTAL METHODOLOGY
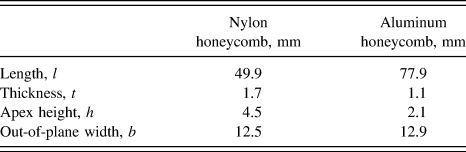
Thermoplastic and metallic negative stiffness honeycombs were designed and fabricated for impact testing. Specifically, nylon 11 and 7075-T651 aluminum materials were chosen for their manufacturability and their relatively large elongations at break: approximately 15% or higher for additively manufactured (laser sintered) nylon 11 Reference Leigh19 and 11% at break for conventionally fabricated 7075-T651 aluminum. 20 The basic design of the honeycombs is illustrated in Figs. 1(a) and 1(c) and dimensions are recorded in Table I. Details of the geometric design of the honeycombs are provided in Ref. Reference Correa, Klatt, Cortes, Haberman, Kovar and Seepersad1.
As-built beam dimensions for nylon and aluminum honeycombs.

Dimensions were selected to provide force thresholds within the capabilities of an in-house impact testing machine (approximately 500 N or less), to permit straightforward fabrication on either selective laser sintering or water jetting equipment, and to avoid bistability and yielding so that the honeycombs recover their initial configurations upon release of an impact load. Relevant equations for analyzing the mechanical behavior of the honeycombs are provided elsewhere Reference Correa, Klatt, Cortes, Haberman, Kovar and Seepersad1–Reference Qiu, Lang and Slocum3 and are not repeated here. If one assumes that the double beam structures in Fig. 1(a) transition between first-mode-buckled shapes via a second-mode-buckled shape, then the force threshold of a nylon 11 double-beam unit cell is approximately 104 N and the force threshold for the 2-column honeycomb illustrated in Fig. 1(a) is approximately 208 N. For the aluminum 7075-T651 honeycomb, the comparable values are 217 N for a single double-beam unit cell and 434 N for a 2-column honeycomb. It is also important to note that the Q value, which is defined as the ratio of apex height to beam thickness (Q = h/l), is an indicator of bistability, with a value greater than 2.31 indicating bistability for a perfectly elastic material with perfectly rigid boundary conditions. However, neither the aluminum nor the nylon honeycomb provides perfectly rigid boundary conditions; furthermore, the nylon is viscoelastic and, therefore, transitions to bistability at a higher ratio. Experiments reported in Sec. III show that the nylon honeycomb is not bistable despite its as-built Q value of approximately 2.7.
The nylon negative stiffness honeycombs were additively manufactured with selective laser sintering on a 3D Systems Vanguard HiS + HiQ machine. The material was nylon 11 sourced from Applied Laser Materials as Arkema PA D80-ST unfilled nylon powder. The honeycombs were oriented in the build chamber by placing their architected cross-section parallel to the build plate with the cell extrusion direction orthogonal to the build plate. By building several tensile bars (Type 1 of ASTM D638) near the honeycombs in the SLS build chamber and parallel to the build plate, tension testing them, and averaging the results, the Young’s modulus of the sintered nylon 11 material in the cell walls was estimated at 1582 MPa.
The aluminum negative stiffness honeycomb was fabricated from a 6.35 mm (1/4 inch) thick plate of 7075-T651 aluminum with a Young’s modulus of 71.7 GPa and a yield strength in the range of 537–541 MPa. The honeycomb structure was fabricated by waterjetting with a Flow Mach 2 machine, operating with a 0.012″ orifice, a 0.040″ mixing tube, Barton 85 HPX garnet as the abrasive media, and a Hyplex Prime pump capable of 55,000 psi. The waterjet path was programmed using Flow Path/Nest/Cut version 6 software at 40% of maximum speed. Two identical 6.35-mm-thick honeycombs were fabricated and then clamped together to form a 12.7-mm-thick honeycomb.
Quasistatic compression tests of nylon and aluminum honeycombs were conducted on a universal testing frame (MTS Sintech 2G, Sintech, Research Triangle Park, North Carolina). Each honeycomb interfaced directly with the self-aligning crosshead and base of the machine without a supporting fixture. Compressive displacement was applied to each prototype at a constant crosshead velocity of 5 mm/min until buckling was observed in all of the rows of curved beams. Force–displacement data were recorded for one complete cycle of loading and unloading for each test.
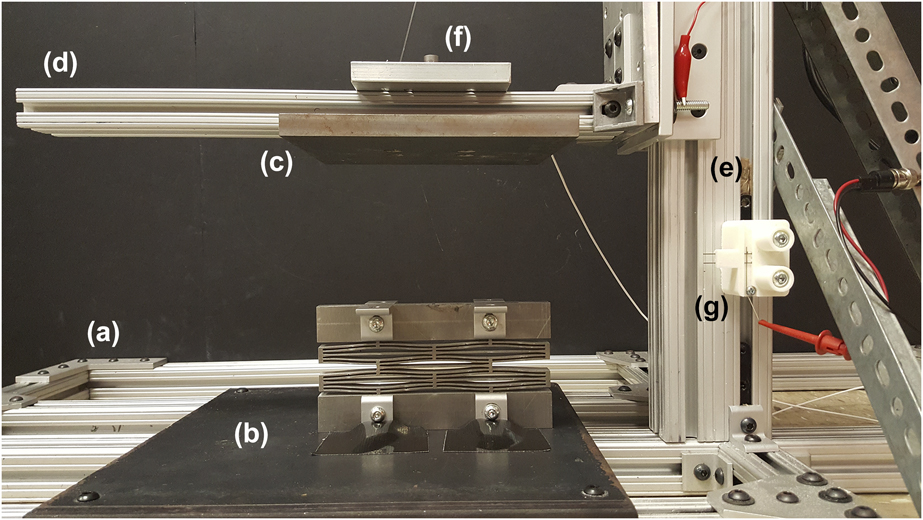
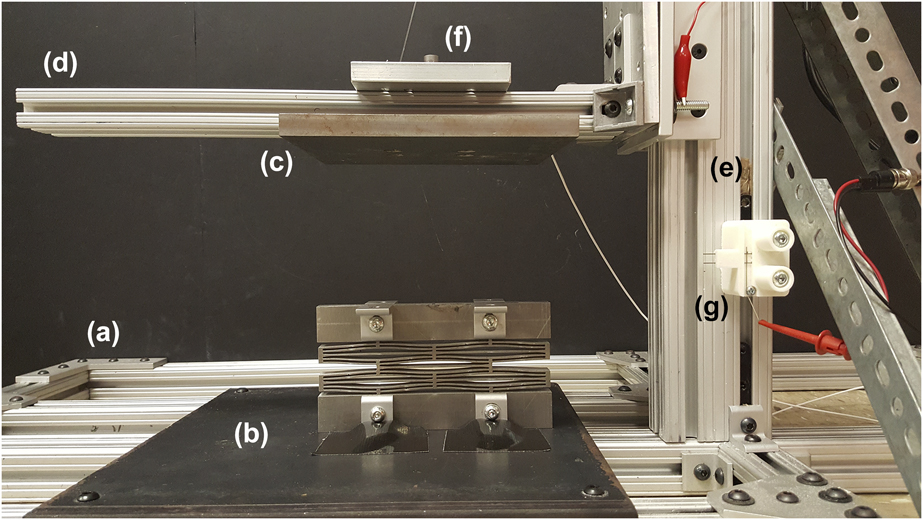
Whereas the quasistatic compression tests were conducted at very low strain rates of approximately 10−4 s−1, understanding the response of these honeycombs when subjected to impact requires much higher strain rates on the order of 101–102 s−1. To conduct these tests, a custom impact testing apparatus was designed and constructed. The apparatus is illustrated in Fig. 2. The frame is constructed from 80/20 T-slotted aluminum. The base plate is rigidly attached to the frame’s base, which extends beyond the base plate for stabilization. Honeycomb specimens are secured to the base plate and impacted by a plate that travels along a vertical guide rail equipped with a lubricated bearing. Different impact plates of varying mass can be dropped from an array of heights to impart a wide variety of impulses to the honeycombs. The total mass of the falling impact arm, including the arm and the plate, is recorded as the mass of the impact plate. An accelerometer (PCB 352C03) is rigidly attached to the falling impact arm and collects data on the time history of acceleration of the falling plate. These data pass through a signal conditioner (PCB 482C) and data acquisition system (National Instruments NI 9234 DAQ card and cDAQ 9178 data acquisition system), and then they are recorded with a LabVIEW program.
Impact testing equipment, including a T-slot aluminum frame (a) with a base plate (b) and an impact plate (c) that attaches to an arm (d), which travels along a vertical guide rail (e). Acceleration is measured with an accelerometer at location (f), and velocity at the point of impact is measured with a velocity meter at location (g).
III. EXPERIMENTAL RESULTS
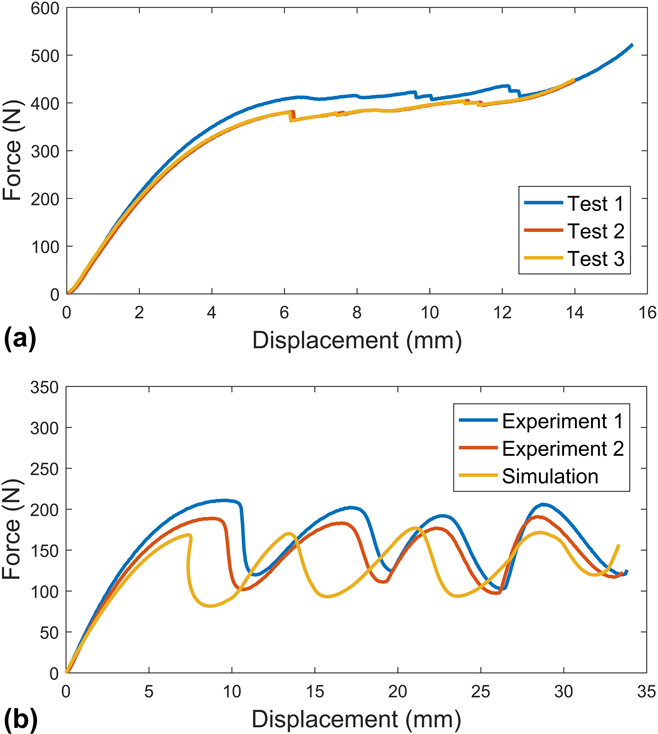
As shown in Fig. 3(a), the compression test of the 4 × 2 aluminum honeycomb indicates a force threshold of approximately 410 N for the first test, which agrees closely with the analytical prediction of 434 N. The discrepancy between the predicted and observed force thresholds is likely due to the imprecise nature of the water jetting operation, which resulted in slightly larger beam thicknesses on the back side of each honeycomb where the waterjets exited the structure. A lower force threshold (approximately 380 N) was observed for the second and third tests of the same specimen. The reduction in force threshold is attributed to small amounts of plastic deformation in the honeycomb that occurred during the first loading–unloading cycle, particularly near the intersections of the curved beams and the vertical side walls where local strain is at a maximum. This plastic deformation is also evident in the difference between the loading and unloading paths in the first test. In the second and subsequent tests, the force–displacement behavior of the specimen was highly repeatable, indicating that the plastic deformation occurred only on the initial test. Unlike the nylon specimens, the unloading path of the aluminum specimen in tests 2 and 3 matches the loading path very closely, as expected when the base material undergoes elastic deformation, although hysteresis effects are likely to be observed in metallic honeycombs with more rows of cells. Reference Findeisen, Hohe, Kadic and Gumbsch21 It is interesting to note that the aluminum honeycombs exhibit a relatively flat force plateau, relative to the more serrated plateau of the nylon honeycombs. This flatness is attributed to the lower Q value (ratio of apex height to curved beam thickness) of the aluminum versus the nylon honeycombs with a lower Q value leading to a decrease in the magnitude of the negative stiffness exhibited as each row of curved beams transitions from one first-mode-buckled shape to another. Reference Qiu, Lang and Slocum3
(a) Mechanical response of a 4 × 2 aluminum NS honeycomb specimen subjected to a quasistatic, displacement-controlled compression test at a strain rate of approximately 10−4 s−1. The specimen is tested three times in succession. (b) Mechanical response of a 4 × 2 nylon NS honeycomb subjected to a quasistatic, displacement-controlled compression test at a strain rate of approximately 10−4 s−1. The specimen is tested two times in succession and compared with the results of an Abaqus simulation.

As shown in Figs. 1 and 3(b), a quasistatic compression test of the 4 × 2 nylon honeycomb specimen indicates a force threshold of approximately 200 N, at which point the negative stiffness unit cells begin to buckle elastically. The four top-most peaks in Fig. 1(b) represent the sequential buckling of each row of curved beams in the honeycomb. The four bottom-most peaks represent the return of each row to its original position. The area bounded by each force–displacement plot represents the energy absorbed by the honeycomb. It should be noted that the energy absorption in this honeycomb is partially due to the viscoelastic behavior of the sintered nylon. If the honeycomb were comprised of a perfectly elastic material, its unloading path would follow its loading path more closely.
When the specimen is unloaded and subjected to a second quasistatic compression cycle, represented by the red curve in Fig. 3(b), its force threshold decreased from 200 N to approximately 180 N, similar to the force threshold reduction observed in the metallic honeycomb, due to small amounts of plastic deformation that occurred in the cell walls during the first loading cycle. It is interesting to note that these force thresholds correspond closely to the value of 208 N predicted by the analytical equations. They also correspond closely to the force threshold predicted by an Abaqus model, represented in yellow in Fig. 3(b), which indicates a force threshold of approximately 175 N. The Abaqus simulation was conducted using the Modified Riks Algorithm in Abaqus 6.14-1 with CPE4R plane strain quadrilateral elements, an incremental pressure applied to the top surface, and displacement boundary conditions applied along the bottom surface. The simulation utilized an elastic–plastic material model based on quasistatic testing of a tensile bar fabricated alongside the honeycombs, which exhibited a Young’s modulus of 1582 MPa and a Poisson’s ratio of 0.33. The material model transitioned to nonlinear plastic behavior at 17.6 MPa. It is worth noting that the elastic–plastic material behavior of selectively laser-sintered nylon can vary significantly from build to build and from part to part, Reference Leigh19,Reference Bourell, Watt, Leigh and Fulcher29 which likely accounts for the small discrepancies between the simulation and the experiment.
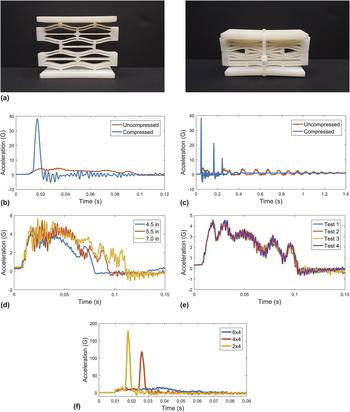
Impact testing was conducted by dropping an impact block with a mass of 5.0 kg from a variety of heights and recording its acceleration history. As shown in Fig. 4(a), the honeycomb was precompressed by wrapping it with thin zip ties prior to compression. The honeycomb was impacted in its uncompressed and precompressed states to document the effect of the architecture of the honeycomb on its impact performance. Figure 4(b) documents the acceleration history of the 5.0-kg block falling from an initial height of 12.7 cm and impacting a 4 × 2 nylon honeycomb specimen with (blue) and without (orange) precompression of the honeycomb. As shown in Figure 4(c), a complete time history of the impact includes several small bounces of the block until it comes to rest. Figure 4(b) represents only the time history of the initial impact between the block and the honeycomb (i.e., the first cycle of compression and release); secondary bounces are not represented in Fig. 4(b).
(a) The uncompressed (left) versus the precompressed (right) configurations of the 4 × 2 nylon NS honeycomb. (b) Acceleration–time plots for a 5.0-kg impact block descending from a drop height of 12.7 cm to impact an uncompressed (orange) or precompressed (blue) 4 × 2 nylon NS honeycomb. (c) Acceleration versus time plots for the uncompressed (orange) and precompressed (blue) nylon honeycombs illustrating multiple bounces of the impact block on the uncompressed and compressed honeycombs. (d) Acceleration versus time plots for a 5.0-kg impact block descending from drop heights of 11.4 cm (blue), 14.0 cm (red), and 17.8 cm (yellow). (e) Acceleration versus time plots for four consecutive impacts of a 5.0-kg block descending from a drop height of 12.7 cm onto an uncompressed 4 × 2 honeycomb. [The test is identical to that reported in (b).] (f) Acceleration versus time plots for a 5.0-kg block descending from a drop height of 45.7 cm onto uncompressed honeycombs with 4 columns of curved beams and either 2 (yellow), 4 (red), or 6 (blue) rows of curved beams.

A comparison of the two plots in Fig. 4(b) reveals that the presence of the uncompressed honeycomb reduces the peak impact acceleration from approximately 38 g to approximately 4.5 g, a reduction factor of approximately 8.4. This reduction in peak impact force is accompanied by a temporal extension of the impact event. As shown in Fig. 4(c), the block strikes and restrikes the precompressed honeycomb almost three times in the time required to fully compress and release the uncompressed honeycomb only once. These results indicate that the honeycomb extends the duration of the impact, which, when combined with the elastic deformation/buckling of the cell walls, allows it to absorb energy at a much lower force threshold than that of the solid nylon itself.
It is also informative to interpret Fig. 4(b) in terms of the physical movement of the honeycomb. In this case, the 12.7-cm drop of the 5-kg impact block provides sufficient energy to elastically buckle two of the four rows of curved beams in the honeycomb. Figure 4(d) provides the acceleration history of the 5-kg block impacting the same honeycomb specimen from different heights. Footnote a As the drop height is reduced, the energy from the impact buckles fewer rows of the curved beams: 4 rows, 3 rows, and 1 row for the 17.8 cm, 14.0 cm, and 11.4 cm drop heights, respectively. It is also clear that the duration of the impact event decreases with decreasing impact height, as a result of buckling fewer rows of curved beams. Finally, regardless of the drop height, the acceleration threshold is relatively constant at approximately 4.5–5 g. Figure 4(e) reinforces the notion that the honeycomb behavior is repeatable. It represents four consecutive drop tests from a 12.7-cm drop height with the same uncompressed honeycomb. The data indicate consistent time histories of acceleration and peak accelerations across multiple repetitions of impact events. This consistency of acceleration thresholds across impact events and drop heights indicates that the honeycombs are consistently thresholding the magnitude of the acceleration or force transmitted through the honeycomb, as long as the kinetic energy of the falling block can be absorbed fully by the buckling beams.
If the impact event causes the honeycomb to compress fully, then the acceleration is limited to the designed threshold as the rows transition from one shape to another, followed by a spike in acceleration when the rows are fully compressed. To generate the data shown in Fig. 4(f), the 5.0-kg block is dropped from a height of 45.7 cm, so that it fully compresses all 6 rows of a 6 × 4 nylon honeycomb. If the number of rows is limited to less than 6 (either 4 or 2 in this case), the time history of acceleration indicates that the honeycomb thresholds the acceleration until all of its rows are compressed, at which time the block is slowed rapidly by the fully compressed honeycomb and large acceleration magnitudes are observed. Regardless of the number of rows, acceleration is limited at a similar level prior to full compression. However, upon full compression of the honeycomb, the peak acceleration imparted to the falling block is much larger for honeycombs with fewer rows of curved beams to absorb impact energy.
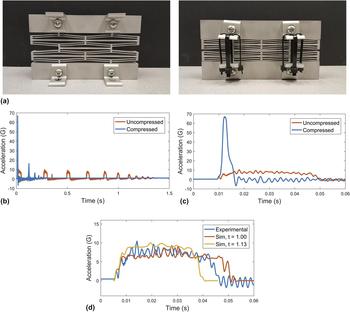
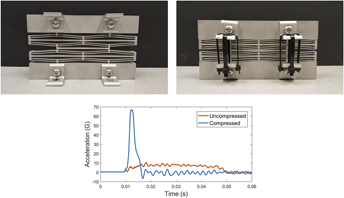
Impact testing with the aluminum honeycomb reveals similar trends. Figure 5(a) illustrates the aluminum honeycomb with and without precompression. Figures 5(b) and 5(c) document the acceleration versus the time history of the 5.0-kg block falling from an initial height of 12.7 cm and impacting a 4 × 2 aluminum honeycomb with (blue) and without (orange) precompression. As with the nylon honeycombs, the aluminum honeycomb structure reduces the peak acceleration of impact and extends the duration of the impact event. In this case, the peak acceleration is reduced by a factor of approximately five, and the block strikes the precompressed honeycomb approximately three times in the time required to fully compress and release the uncompressed honeycomb twice. One notable difference between the behavior of the aluminum and nylon honeycombs is that the impact block continues to bounce for a much longer time period before coming to rest on the aluminum honeycomb, although the drop height was equivalent for both tests. This oscillatory behavior reflects the lack of inherent damping or viscoelasticity in the aluminum base material relative to the nylon. As shown in the quasistatic compression test in Fig. 3, the aluminum honeycomb absorbs negligible amounts of energy in each compression cycle; energy dissipation is due to friction, drag, and inherent damping in the impact testing system. However, even in the absence of inherent damping, the aluminum honeycomb continues to threshold the acceleration of the falling block, which provides impact protection for the falling block even in the absence of viscoelastic material behavior.
(a) The uncompressed (left) versus the precompressed (right) configurations of the 4 × 2 aluminum NS honeycomb. (b) Acceleration versus time plots for the precompressed (blue) and uncompressed (orange) aluminum honeycombs illustrating multiple bounces of the impact block on each configuration. (c) Acceleration versus time plots for the precompressed (blue) and uncompressed (orange) aluminum honeycombs illustrating a single bounce of the impact block on each configuration. (d) Acceleration versus time plots for the aluminum honeycomb. The experiment (blue) is bounded by a simulation of the designed thickness (orange) and a simulation of the average as-built thickness (yellow).

Finite element (FE) analysis of the aluminum negative stiffness honeycomb is performed in Abaqus/Explicit (version 6.14-1) and compared with the experimental data in Fig. 5(d). The Abaqus model is a 2D plain strain FE model with Abaqus element type CPE4R, and a mesh convergence study is performed to identify appropriate mesh density. The vertical motion of the bottom surface of the honeycomb is constrained in addition to horizontal motion of one corner of the bottom surface. The falling block is modeled as a solid block with a mass of 5.0 kg and an initial velocity of 1.2 m/s. The model ignores friction, drag, and inherent damping in the impact testing equipment. The velocity of the mass is selected to match the velocity measured by the impact testing equipment immediately prior to the point of impact. The impact block acceleration data obtained from Abaqus are filtered with a third order low pass Butterworth filter with a cutoff frequency of 500 Hz. The same filter is applied to the experimental data. The Abaqus simulation is repeated for two different values of beam thickness, t. The smaller value is the as-designed thickness of 1.0 mm. The larger value, 1.13 mm, is based on an average of measured beam thicknesses of the as-built honeycomb. Since the metal honeycomb is fabricated with a water jetting process, the wall thicknesses on the entry side are thinner than those on the exit side, ranging from approximately 1.0–1.25 mm, respectively. The larger value of beam thickness, 1.13 mm, is selected as the approximate midpoint between the measured as-built dimensions, and 1.1 mm is recorded in Table I as the as-built wall thickness.
As shown in Fig. 5(d), the Abaqus simulation provides reasonable agreement with the experimental data. Peak impact accelerations are comparable at approximately 8.5–10 g. The duration of the initial impact events is also similar, with Abaqus predicting 0.04–0.05 s for the initial compression and release compared with approximately 0.045 s in the experimental data. The simulations based on the two different beam thicknesses bracket the experimental simulation, in terms of both the acceleration threshold and the duration of the event, indicating that changes in the beam thicknesses due to manufacturing variability likely explain most of the discrepancies between the simulation and experiment. The relatively close agreement between Abaqus predictions and experimental data makes the Abaqus model a useful tool for designing the honeycombs for new applications.
IV. DESIGN CONSIDERATIONS
The findings reported in this paper provide guidance for designing these honeycombs for specific applications. These honeycombs are most appropriate for isolating an object from dynamic mechanical loading. A typical objective would be to prevent the isolated object from experiencing a peak acceleration greater than a predetermined threshold. If the mass of the object is known, then the acceleration threshold translates directly into a force threshold to be achieved by the honeycomb. As demonstrated in Sec. III, the analytical equations described in Ref. Reference Correa, Seepersad and Haberman2 for estimating the force threshold are reasonably accurate for both metallic and plastic embodiments. As described in Ref. Reference Correa, Seepersad and Haberman2, the force threshold is proportional to the number of columns of cells in the honeycomb, such that doubling the columns of cells with identical dimensions approximately doubles the force threshold. As demonstrated in Sec. III [specifically, the discussion surrounding Figs. 4(d)–4(f)], the force threshold is relatively insensitive to the number of rows of cells and to the magnitude of the impact velocity for blunt force impacts in the 1–5 m/s range.
After the force threshold is established, the next consideration is evaluating the energy absorbed by the honeycomb during its compression cycle. As described in the discussion of Fig. 4(f), if the dynamic mechanical loading compresses the honeycomb beyond full compression, then a sharp spike in acceleration is likely as the isolated object is slowed rapidly by the fully compressed honeycomb, thereby exceeding the acceleration threshold established for the isolated object. Accordingly, it is important to estimate the magnitude of mechanical energy absorbed by the honeycomb during the compression cycle. If one assumes force-controlled loading, as is likely during an impact event, then the energy absorption during the period of plateau stress in Fig. 1(b) can be estimated by multiplying the force threshold by the change in displacement between the initiation of buckling (i.e., the first peak) and the full compression of the honeycomb. As described in Ref. Reference Correa, Seepersad and Haberman2 and confirmed in the discussion of Fig. 4(f), the energy absorption in the plateau region is roughly proportional to the number of identical rows of cells, such that adding more rows of cells with identical geometry leads to proportionally greater displacement and energy absorption. For a full estimate of energy absorption, the energy absorption in the plateau region must be combined with the energy absorption in the quasilinear region prior to the initiation of buckling. This initial energy absorption can be calculated using the force–displacement relationships documented in Ref. Reference Correa, Seepersad and Haberman2, as long as the relationships are modified for the number of rows and columns of cells with n c columns of cells acting as n c nonlinear springs in parallel and n r rows of cells acting as n r nonlinear springs in series. Restrepo et al. Reference Restrepo, Mankame and Zavattieri9 also investigate the loading and unloading cycle of these honeycombs and describe that increasing the number of rows of cells in a geometric domain beyond an initial threshold can lead to a greater hysteretic behavior for various classes of parent materials.
V. CLOSURE
Like conventional honeycombs, negative stiffness honeycombs exhibit an extended force or stress plateau that corresponds to successive buckling of cell walls; unlike conventional honeycombs, this buckling occurs elastically, resulting in full recovery of their initial configuration. Conventional honeycombs and lattice structures are also capable of recoverable elastic buckling when fabricated at extremely small length scales and low densities. Reference Zheng, Lee, Weisgraber, Shusteff, DeOtte, Duoss, Kuntz, Biener, Ge, Jackson, Kucheyev, Fang and Spadaccini22,Reference Schaedler, Jacobsen, Torrents, Sorensen, Lian, Greer, Valdevit and Carter23 It can be challenging to fabricate ordered materials at such low densities, and the stiffness and strength per unit volume may be too low for many structural applications. By contrast, negative stiffness honeycombs can be configured to provide high levels of static stiffness, Reference Fulcher, Shahan, Haberman, Seepersad and Wilson24–Reference Alabuzhev, Gritchin, Kim, Migirenko, Chon and Stepanov26 perhaps to support a substantial mass or preload.
From a practical perspective, the extensive regions of negative or quasizero stiffness provided by negative stiffness honeycombs are ideal for shock isolation. As demonstrated experimentally in this paper, this characteristic can be exploited to threshold the acceleration of an isolated mass. This thresholding behavior could be very important for applications with sensitive payloads that require strict limits on imparted accelerations. The experimental results demonstrate that this thresholding behavior is highly repeatable as long as the mechanical energy imparted to the system does not exceed the energy absorption capability of the honeycomb, at which point full densification leads to spikes in transmitted acceleration.
One of the drawbacks of negative stiffness honeycombs is their inability to dissipate energy in the configurations tested in this study. For the (nearly perfectly elastic) aluminum base material, practically all of the mechanical energy absorbed by the honeycomb is returned to the isolated mass as the honeycombs reset. There are, however, a few ways to mitigate this effect. One way to achieve energy dissipation is to fabricate larger arrays of honeycombs because the presence of additional layers of unit cells can create hysteresis effects, regardless of the elasticity of the parent material. Reference Restrepo, Mankame and Zavattieri9,Reference Findeisen, Hohe, Kadic and Gumbsch21 Another approach is to design truly bistable negative stiffness honeycombs Reference Shan, Kang, Raney, Wang, Fang, Candido, Lewis and Bertoldi12 that trap the mechanical energy by locking themselves into the opposing bistable configuration. The difficulty with this approach is that the honeycomb must be mechanically reset to accommodate a subsequent impact, whereas the monostable designs investigated in this study reset themselves on the time scale of the loading cycle. Another approach for energy absorption, in addition to employing viscoelastic materials such as the nylon utilized in this study, is to place other mechanical units in parallel with the negative stiffness honeycombs. One-way dampers serve to dissipate energy and slow the return of the isolated mass. Reference Fulcher27 Placing positive stiffness springs in parallel or in series with negative stiffness elements can also create hysteresis loops that dissipate energy even with perfectly elastic parent materials. Reference Izard, Alfonso, McKnight and Valdevit15
There are many opportunities for future work. One example would be to study the impact behavior of these honeycombs at even higher strain rates, at which point momentum effects and higher frequency oscillations can become prominent (e.g., Ref. Reference Harne and Wang28).
ACKNOWLEDGMENTS
The authors wish to thank Dr. Desiderio Kovar and Dr. Sergio Cortes for their generous assistance with the quasistatic compression tests reported in Figs. 1(b) and 3 and Nicholas Leathe, Audrey Morris-Eckart, and Tommy Woodall of Sandia National Laboratories for helpful feedback on testing and applications. The authors gratefully acknowledge financial support from the National Science Foundation under Grant No. CMMI-1435548 and the Laboratory Directed Research and Development (LDRD) program at Sandia National Laboratories. Sandia National Laboratories is a multimission laboratory managed and operated by National Technology and Engineering Solutions of Sandia, LLC., a wholly owned subsidiary of Honeywell International, Inc., for the U.S. Department of Energy's National Nuclear Security Administration under contract DE-NA-0003525. Any opinions, findings, and conclusions or recommendations expressed in this material are those of the authors and do not necessarily reflect the views of the sponsor.