Introduction
A host's behaviour regarding, for instance, its social structure, use of roosts or burrows, home range size and vagility, may affect the frequency of host–parasite encounters and the interaction among conspecifics that facilitate the transfer of ectoparasites and shape the patterns of parasitic species abundance on hosts (Altizer et al., Reference Altizer, Nunn, Thrall, Gittleman, Antonovics, Cunningham, Dobson, Ezenwa, Jones, Pedersen, Poss and Pulliam2003; Sih et al., Reference Sih, Spiegel, Godfrey, Leu and Bull2017). For a parasite, the host represents a habitat patch; thus, the greater the population density of the host, the greater the success of parasite colonization. Naturally, this results from exposure to parasites, as the patches are poorly isolated at high densities (Arneberg et al., Reference Arneberg, Skorping, Grenfell and Read1998; Krasnov et al., Reference Krasnov, Khokhlova and Shenbrot2002). At high densities, even weak social connections can increase the probability of parasite transmission (Webber and Vander Wal, Reference Webber and Vander Wal2020), allowing the spread of ectoparasites and possibly resulting in a similarity of parasitic burden, low prevalence and low degree of aggregation in the host population (Samsing et al., Reference Samsing, Oppeda, Johansson, Bui and Dempster2014; Archer et al., Reference Archer, Bennett, Faulkes and Lutermann2016). The contact between hosts that allows the transmission of parasites may not be random and patterns of movements and behaviours of the hosts generate heterogeneity in parasite transmission (Altizer et al., Reference Altizer, Nunn, Thrall, Gittleman, Antonovics, Cunningham, Dobson, Ezenwa, Jones, Pedersen, Poss and Pulliam2003; Perkins et al., Reference Perkins, Ferrari and Hudson2008; Sih et al., Reference Sih, Spiegel, Godfrey, Leu and Bull2017); these patterns can be represented as links (edges) among host individuals (nodes) (Godfrey, Reference Godfrey2013). The increased modularity of the interaction network, i.e. the formation of sub-groups within a large group, may decrease transmission risk and parasite success (Griffin and Nunn, Reference Griffin and Nunn2012; Nunn et al., Reference Nunn, Jordán, McCabe, Verdolin and Fewell2015). The degree of social contact or degree centrality, i.e. the number of interactions with conspecifics, is variable even in solitary species; nevertheless, it has great implications in the transmission of parasites. Social interactions comprise physical contact and close proximity (e.g. shared space in the same time period), and highly connected individuals within an interaction network are more likely to be infected compared to their conspecifics (Kurvers et al., Reference Kurvers, Krause, Croft, Wilson and Wolf2014; Rimbach et al., Reference Rimbach, Bisanzio, Galvis, Link, Di Fiore and Gillespie2015) Therefore, network connectivity may be correlated with parasitic burden.
Some parasite species, such as lice, require direct physical contact between hosts for transmission to occur (Fernandes et al., Reference Fernandes, Cruz and Linhares2012; Zohdy et al., Reference Zohdy, Kemp, Durden, Wright and Jernvall2012), whereas in other groups, such as fleas and nidicolous ticks, transmission between hosts can be facilitated by asynchronous sharing of shelters (Godfrey et al., Reference Godfrey, Bull, James and Murray2009; Godfrey et al., Reference Godfrey, Moore, Nelson and Bull2010; Sih et al., Reference Sih, Spiegel, Godfrey, Leu and Bull2017). Ectoparasites such as ticks and mites can use microhabitat occupation tactics, waiting until the target host is present; thus, vagility in the home range may make a host susceptible to the dispersive forms of non-permanent parasites. Moreover, the encounter opportunities may vary with the season, due to the parasite's life cycle and possibly the characteristics of the habitat (Buchholz and Dick, Reference Buchholz and Dick2017). Thus, the ecology of movement and social networks helps in understanding the parasite transmission process.
Heterogeneity in parasite exposure and susceptibility to infection between hosts generate different levels of parasite aggregation among host samples (Poulin, Reference Poulin2013; Gourbière et al., Reference Gourbière, Morand and Waxman2015). Many of the published studies on the interaction of ectoparasite and mammalian hosts have investigated the parasitic burden related to host and parasite traits or environmental characteristics (Perez-Orella and Schulte-Hostedde, Reference Perez-Orella and Schulte-Hostedde2005; Christe et al., Reference Christe, Glaizot, Evanno, Burndonckx, Devevey, Yannic, Patthey, Maeder, Vogel and Arlettaz2007; Brunner and Ostfeld, Reference Brunner and Ostfeld2008; Presley and Willig, Reference Presley and Willig2008; Várfalvyová et al., Reference Várfalvyová, Stanko and Miklisová2011; Viljoen et al., Reference Viljoen, Bennett, Ueckermann and Lutermann2011; Fernandes et al., Reference Fernandes, Cruz and Linhares2012, Reference Fernandes, Cruz, Linhares and Von Zuben2015; Colombo et al., Reference Colombo, Nava, Antoniazzi, Monje, Racca, Guglielmone and Beldomenico2015; Hammond et al., Reference Hammond, Hendrickson, Maxwell, Petrosky, Palme, Pigage and Pigage2019; Kiene et al., Reference Kiene, Andriatsitohaina, Ramsay, Rakotondramanana, Rakotondravony, Radespiel and Strube2020).
In the Acari, parasitic associations with mammals occur mainly with the Ixodida and Mesostigmata orders, and different types of host–parasite systems have been observed. For example, the life cycles of ticks are complex, with alternation between the blood-feeding period attached to the host and the free-living stage away from a host. In addition, ticks need a new host for each developmental stage, which leads to the possibility of exploring many different mammal hosts (Durden, Reference Durden, Morand, Krasnov and Poulin2006). In contrast, mesostigmatid Spinturnicidae mites live permanently attached to the wing membranes of their bat hosts, with their entire life cycle taking place on the host (Dowling, Reference Dowling, Morand, Krasnov and Poulin2006).
Here, we studied the relationship between a laelapid (Acari: Mesostigmata) mite species, Gigantolaelaps oudemansi Fonseca, 1939 and its rodent host Oecomys paricola Thomas, 1904. Laelapid ectoparasite mites are commonly found in Sigmodontinae rodents (Cruz et al., Reference Cruz, Fernandes and Linhares2012), with nymphs and males spending most of their lives in nests, whereas females are most often found on hosts and are considered to be the mode of dispersal (Radovsky, Reference Radovsky and Houck1994; Gettinger and Owen, Reference Gettinger and Owen2016). No information is available about the ecology and natural history of G. oudemansi. Oecomys paricola is a small sigmodontine rodent that is considered arboreal but can be found in various microhabitats, including soil. Individuals are nocturnal and solitary, feeding on fruits, seeds and insects (Carleton and Musser, Reference Carleton, Musser, Patton, Pardiñas and D'Elía2015). In particular, we tested the following hypotheses: (i) the G. oudemansi burden of the individual hosts is related to their degree of interaction with other hosts and (ii) the pairwise absolute difference between the mean mite burdens among individual rodents is inversely proportional to their interaction similarities.
Materials and methods
Study site
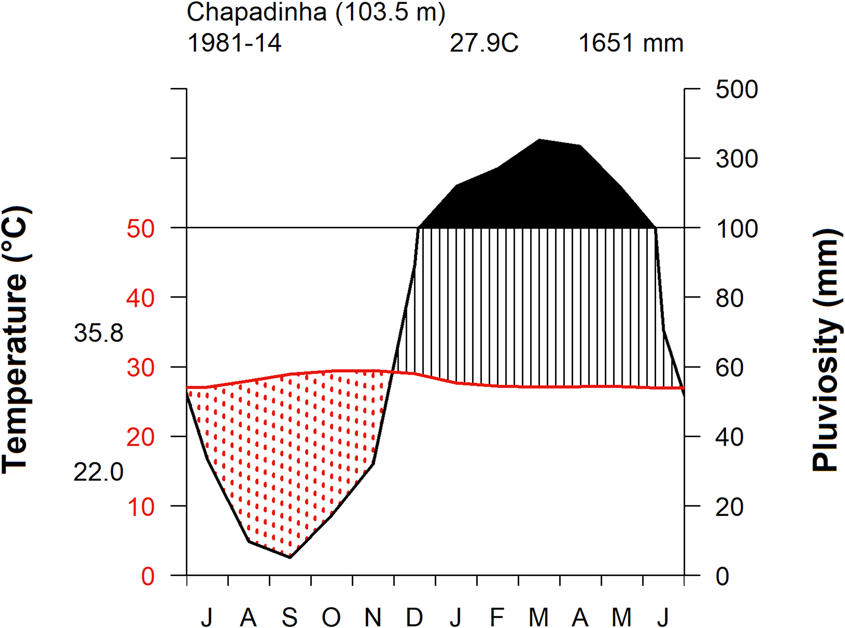
Our study was carried out in a savanna/seasonal deciduous forest ecotone habitat at Macajuba farm (hereafter, MF) located in Chapadinha County, Maranhão State, Brazil (3°48′58″S; 43°31′03″W). The vegetation in MF consists of remnants of seasonal deciduous submontane forest, that is, a medium-sized forest composed of deciduous trees with fine stems (e.g. Cedrela, Ceiba, Jacaranda and others) (IBGE, 2012). The climate is tropical savanna (Aw sensu Köppen-Geiger classification, Beck et al., Reference Beck, Zimmermann, McVicar, Vergopolan, Berg and Wood2018); the dry season occurs from late-June to December and the wet season from January to early-June (Fig. 1). The mean annual rainfall is 1651 mm, and the mean annual temperature is 27.9°C.
Climate diagram of the Chapadinha, Maranhão, Brazil. Data from Instituto Nacional de Meteorologia (INMET), 1981–2014 (https://portal.inmet.gov.br/).

Data collection
The rodents were captured monthly over 4 months in the dry season (June, July, October and December 2013) and over 4 months during the wet season (January to April 2014). We carried out capture–mark–recapture trapping sessions for five consecutive nights in each month using a 10 × 10 trapping grid with 100 trapping stations located 15 m apart (18 225 m2). Two Sherman live traps (7.5 × 9.0 × 23.5 cm) were set at each trapping station (one on the ground and the other on trees c. 1.75 m high) and baited with sweet potato and peanut butter. The trapping grid was defined as a Cartesian coordinate system, and the capture location points were recorded as coordinates (x, y) in the space of the trapping stations (Fernandes et al., Reference Fernandes, Cruz, Martins and Reis2010). Rodents were marked with numbered leg bands, and their sex was recorded. The weight was measured with a Pesola® scale (precision = 1 g), and their fur was inspected for the presence of parasite mites. Mites were collected using tweezers and placed in a 10-mL glass container containing 70% alcohol with an inner and outer label containing the following information: host number of the leg band, host sex, date of capture and capture location point (Fernandes et al., Reference Fernandes, Cruz and Linhares2012). The captured rodents were released after the parasite collection procedure. The mite specimens collected were deposited in the Arthropod Vectors Collection of Importance in Communities Health of the Oswaldo Cruz Institute. This study was performed under the authorization of IBAMA-ICMbio 356889-1 and approved by the Ethics Committee in Animal Experimentation of the Maranhão Federal University (CEUA 28/12).
Transmission network framework
The acquisition of G. oudemansi mites occurs directly, probably through physical contact between hosts (Gettinger and Owen, Reference Gettinger and Owen2016), or through use of the same nests (or shelters) by different hosts. Thus, we assumed that rodent individuals who have adjacent home ranges, or some overlap in their home ranges, are more likely to interact directly (e.g. physical contact) or to use shelters in common. Eleven O. paricola individuals were recaptured in five or more locations, and we estimated their home ranges using the minimum convex polygon (MPC) method (Mohr, Reference Mohr1947). MPC home range estimates depend on the number of captures per individual, and more reliable estimates are typically obtained with at least five location points (Cáceres and Monteiro-Filho, Reference Cáceres and Monteiro-Filho2001). The mean home range was of 1063.64 m2 (225–4275 m2) with a radius of 18.4 m. Therefore, individuals captured at the same location point or at any directly adjacent point within an 18-m radius were assumed to share the same space and form a potential transmission contact (Perkins et al., Reference Perkins, Ferrari and Hudson2008, Reference Perkins, Cagnacci, Stradiotto, Arnoldi and Hudson2009).
The standard methods of capture herein used (i.e. capture stations) may introduce bias in the spatial use of rodent individuals; for example, baits can attract rodents to unusual habitats, interrupt their normal activity or make them ‘trap-happy’ by concentrating their activities in restricted locations of the capture grid (Magnusson et al., Reference Magnusson, Francisco and Sanaiotti1995; Vieira et al., Reference Vieira, Iob, Briani and Palma2005). This can directly influence the frequency of transmission opportunities between individuals. Thus, to avoid any bias, we use a binary adjacency matrix (0; 1), with 1 representing the potential opportunity for transmission between two rodents.
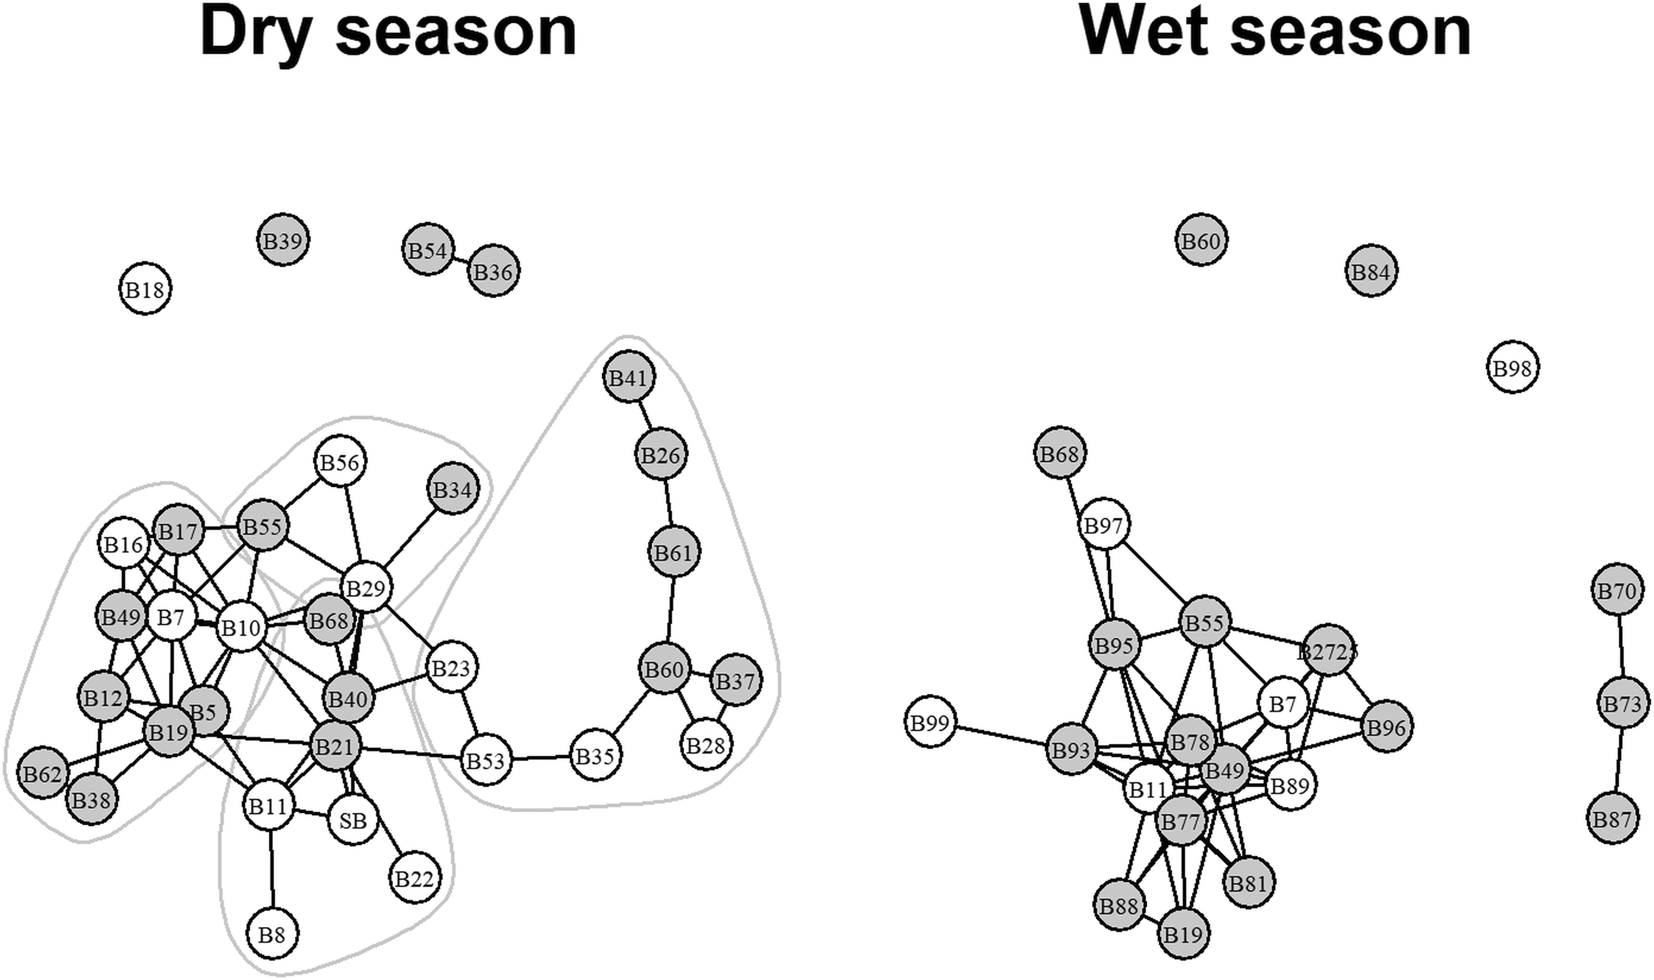
Rainfall regimes alter the environmental conditions of Neotropical savanna areas (e.g. a greater supply of food in the wet season), reducing changes in the activities of rodents and other small mammals (e.g. reducing the home ranges in places with a greater supply of resources) (O'Connell, Reference O'Connell1989; Rocha et al., Reference Rocha, Ribeiro and Marinho-Filho2017). Thus, we constructed two binary adjacency matrices, one for the dry season and the other for the wet season. The transmission networks are represented as an undirected graph, in which nodes represent the individuals of O. paricola, and the edges represent the G. oudemansi transmission opportunities (Fig. 2).
Transmission networks of Gigantolaelaps oudemansi on Oecomys paricola individuals. White circles represent females, whereas grey circles represent males; the modules are delimited by the grey lines.

Statistical analysis
We used the following metrics to describe transmission networks: the degree centrality of each node, density, assortative mixing and modularity (Newman, Reference Newman2018). The degree centrality of a node is the number of connections (edges) that an individual host has with other host individuals (nodes); in this study, it was represented by the number of mite transmission opportunities among rodents. The density of a network is measured by the proportion of edges observed between the nodes in relation to the maximum number of possible edges; it varies from 0 to 1, and the closer to 1, the greater the network interconnection, i.e. the mite transmission opportunities will be greater among the rodents. Assortative mixing is defined as selective connections among nodes, according to a specific characteristic (e.g. female rodents interact more with each other than with male rodents) (Newman, Reference Newman2003). We used the assortativity coefficient (r a) (Newman, Reference Newman2003) to measure it, r a ranging from −1 to 1, with values that tend to −1 indicating disassortative links among nodes, whereas values that tend to 1 indicate assortative links among nodes. A value of r a equal or close to zero corresponds to randomly assigned connections.
Modularity (Q) is defined as the extension of internal groups, or modules, within the network; that is, groups of nodes that are more interconnected with each other than with other nodes in the network. We used the fast-greedy community detection algorithm to identify modules and the metric proposed by Clauset et al. (Reference Clauset, Newman and Moore2004) for estimating Q values. Statistical significance (α = 0.05) was inferred from a comparison of the estimate obtained with reference values of 1000 theoretical networks randomized by the Chung–Lu null model (Chung and Lu, Reference Chung and Lu2002). The Chung–Lu random graph model is a probabilistic model in which each pair of nodes is connected based on a certain probability function (power law degree distributions), preserving the expected degree sequence.
The G. oudemansi mites were collected more than once from the same individual of O. paricola, so we used the mean individual burden (i.e. the total number of mites collected from the rodent individual over the season divided by the number of times this individual rodent was inspected) as a response variable. The mean individual burden values were rounded up to integers. The data of the mean individual burden showed overdispersion in both seasons (dry season variance/mean ratio = 11.53; wet season variance/mean ratio = 4.45), but the negative binomial distribution was not fitted to the burden data in both seasons (dry season χ 2 = 74.57; df = 54; P-value = 0.03; wet season χ 2 = 71.48; df = 24; P-value < 0.001). Thus, the generalized linear regression quasi-Poisson models (GLM QP) were used to determine whether the mean burden of G. oudemansi depended on the degree centrality, body weight, sex and age of O. paricola individuals. We used a graphic residual analysis to assess the fit of the model to the mean burden. Confidence bands (95%) were constructed using 1000 simulations. If the model is well-fitted, the majority of the points representing the residuals should be distributed within those bands (Atkinson, Reference Atkinson1987).
The edge strength among nodes is usually defined by the frequency of physical contact between individuals, frequency of a certain degree of proximity in the environment, frequency of the use of nests or shelters in common or overlapping of home ranges (Godfrey, Reference Godfrey2013). Regardless of the variable, the edge strength between two nodes is proportional to their similarities; that is, the number of nodes shared between them (Mattie et al., Reference Mattie, Engø-Monsen, Ling and Onnela2018). Thus, we measured the similarities between O. paricola individuals in the transmission networks using the Jaccard similarity coefficient, which corresponds to the number of common nodes divided by the number of neighbouring nodes of at least one of the two nodes considered (Newman, Reference Newman2018); we used these coefficients as surrogates of the edge strength among nodes. We correlated these coefficient values with the absolute differences in the mean individual burden among rodents to test the hypothesis that the greater the similarity of shared contacts between individuals, the smaller the difference between their infestation burden by G. oudemansi.
Because the metrics based on network nodes (i.e. degree centrality and similarity coefficients) are not independent, we applied Monte Carlo randomized tests to assess the significance of the coefficients obtained in the GLM QP regressions and the similarities coefficients–absolute differences in the mean individual burden correlation (James et al., Reference James, Croft and Krause2009; Farine, Reference Farine2017). We constructed 1000 random networks generated by the Chung–Lu null model and used the values of the node degrees and Jaccard coefficients of these simulated networks in the Monte Carlo randomized tests. The P-values obtained were the frequency at which the randomized coefficients were greater than the coefficients obtained in the GLM, and the randomized coefficients were lower in the correlation test (Manly, Reference Manly2006; see Farine, Reference Farine2017 for more details). Network analysis was performed using the R package igraph (Csardi and Nepusz, Reference Csardi and Nepusz2006), and statistical analyses were performed using R v.3.6.2 (R Core Team, 2019).
Results
We captured a total of 50 O. paricola individuals over the course of the study, of which 22 were recaptured two or more (2–17) times. Rodents were captured at 67 different points on the capture grid, with a mean of 18 (13–25) capture events per month. The G. oudemansi burden averaged 17 (0–56) and 10 (0–38) mites in the dry and wet seasons, respectively.
Transmission networks
The transmission network was formed by 34 rodents in the dry season (2 juveniles and 12 adult females; 12 juveniles and 8 adult males). The degree centrality ranged from 0 to 11, and host individuals were connected, on average, to four other individuals. The density was 0.11, showing low network interconnectivity, and no assortative mixing was observed (host sex r a = −0.1; host age r a = 0.02). The network was modular (Q = 0.44; P-value = 0.03) with four modules (Fig. 2). In the wet season, 23 rodents formed the transmission network (one juvenile and five adult females; nine juveniles and eight adult males). The degree centrality ranged from 0 to 13 with one host individual connected on average to four other hosts. The density was 0.2, slightly higher than in the dry season, and no assortative mixing was observed (host sex r a = −0.14; host age r a = −0.18). The modularity value did not differ from that generated by the null model (Q = 0.25; P = 0.9).
Mean individual burden
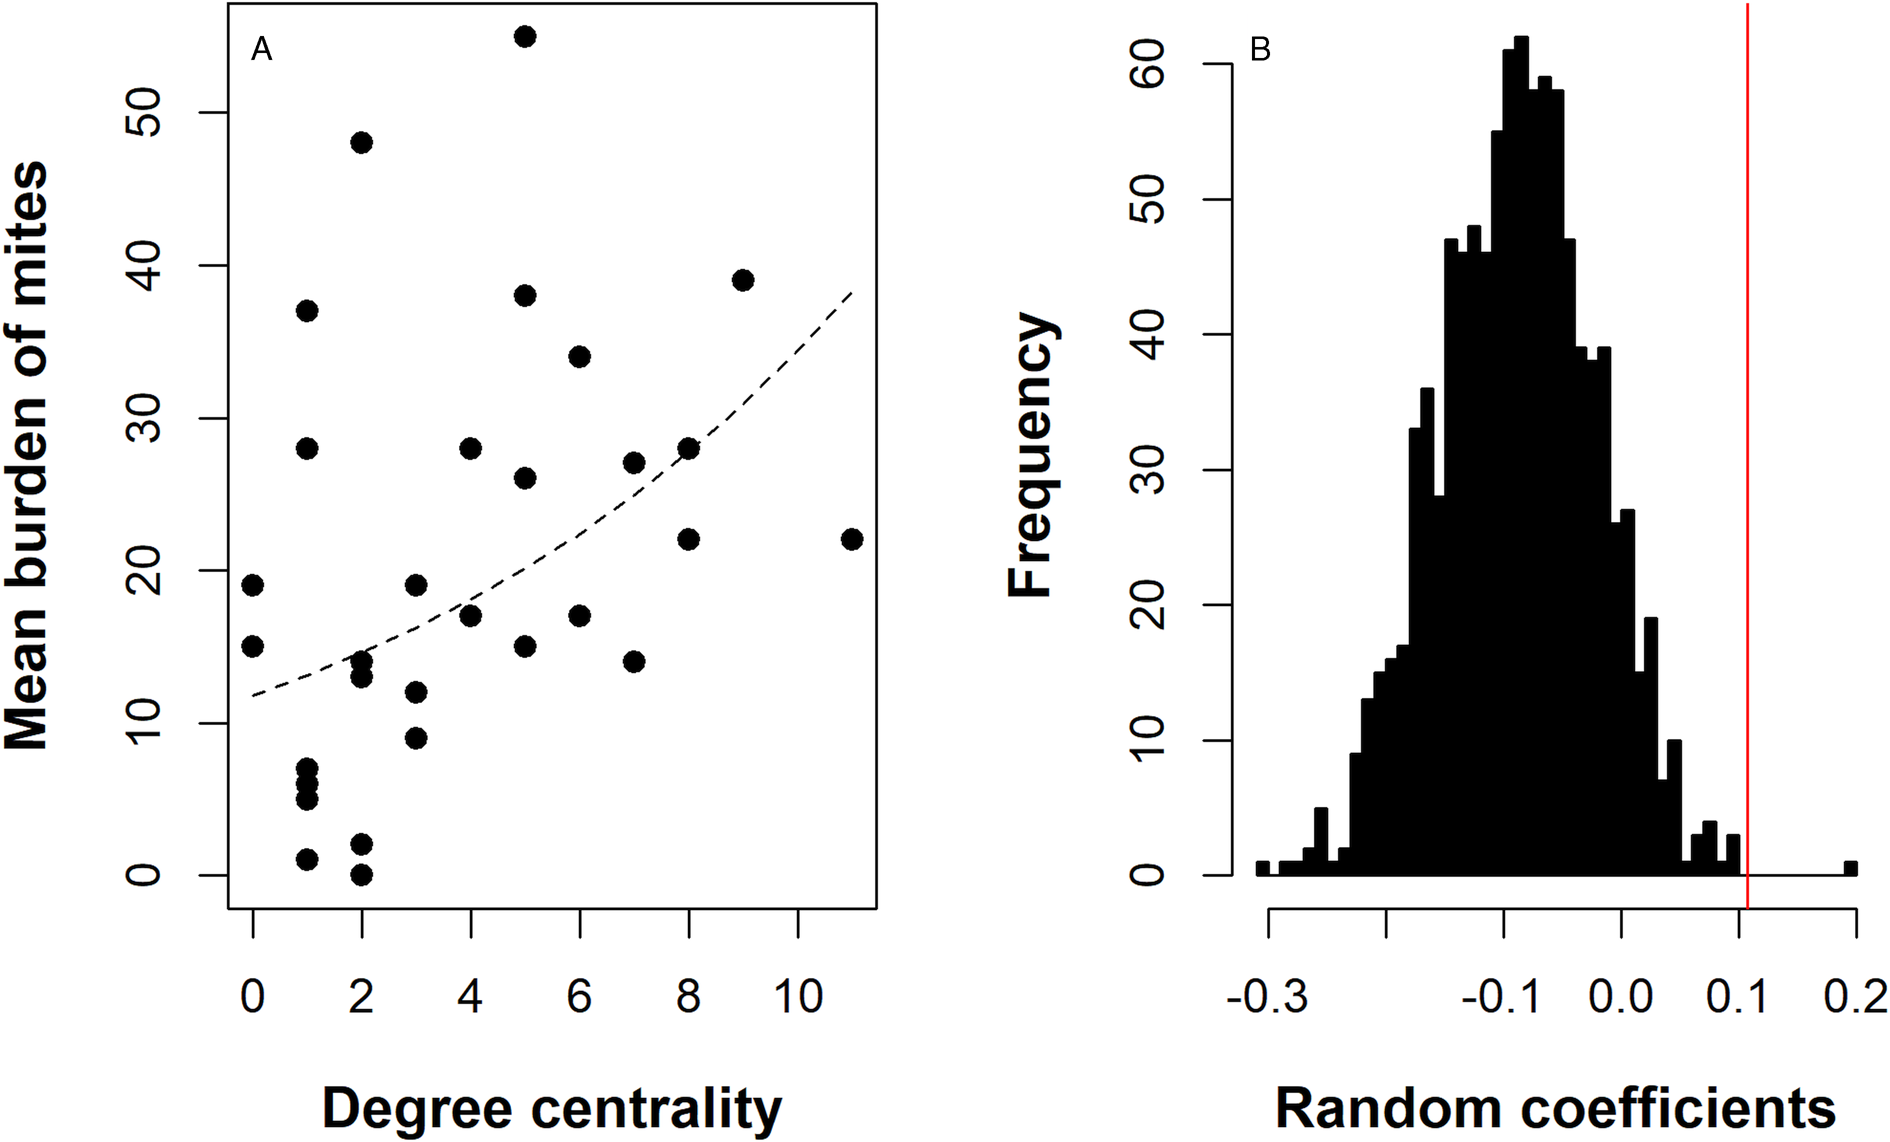
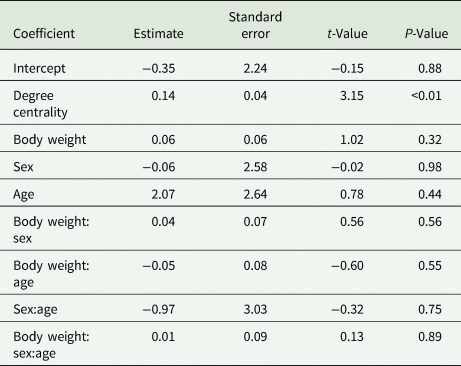
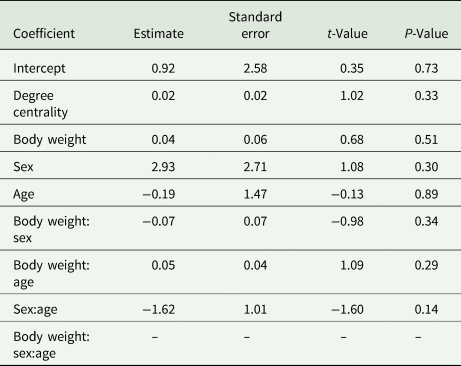
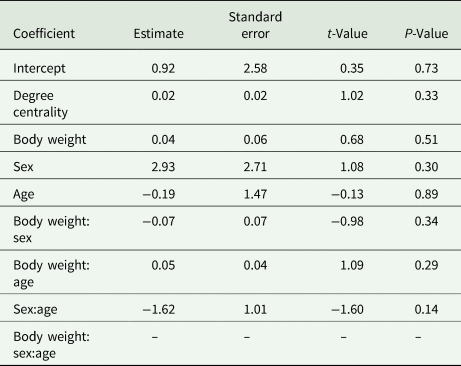
The mite burden showed an aggregated distribution in both seasons; it was more heterogeneous in the dry season (variance/mean ratio = 11.53) than in the wet season (variance/mean ratio = 4.45). The GLM QP regression indicated that the degree centrality of the nodes was the only predictor of the mean G. oudemansi burden in individuals of O. paricola in the dry season, with the mite burden increasing with host degree (Table 1, Fig. 3A). The residuals plot shows that the majority of the points (i.e. residuals) are distributed within the confidence bands, indicating that the model fits well with the data (see Supplementary Fig. 1). A randomized test demonstrated that the degree regression coefficient was significant (P = 0.004; Fig. 3B). In contrast, the GLM QP regression demonstrated that no explanatory variable predicts the mean mite burden in individual hosts in the wet season. However, the sex of the host showed a significant marginal value and the interaction sex: age of the host showed a significant value. Subsequent graphical analysis showed the presence of outliers in the data, and when we remade the regression model without the extremes, no significant results were observed (Table 2).
(A) Mean burden of G. oudemansi as a function of the host degree in the dry season transmission network. (B) Frequency distribution of the randomized GLM QP degree centrality coefficients; red line is the observed value.

Coefficient estimates of the GLM QP regression for the mean burden Gigantolaelaps oudemansi as a function of the host degree centrality, body weight (g), sex and age of the Oecomys paricola rodent host in MF, Maranhão, Brazil: dry season

Estimates of the GLM QP regression coefficient for the mean burden of G. oudemansi as a function of the degree of the host node (D), body weight (W), sex (S) and age (A) of the O. paricola rodent host in MF, Maranhão, Brazil: wet season; without outliers
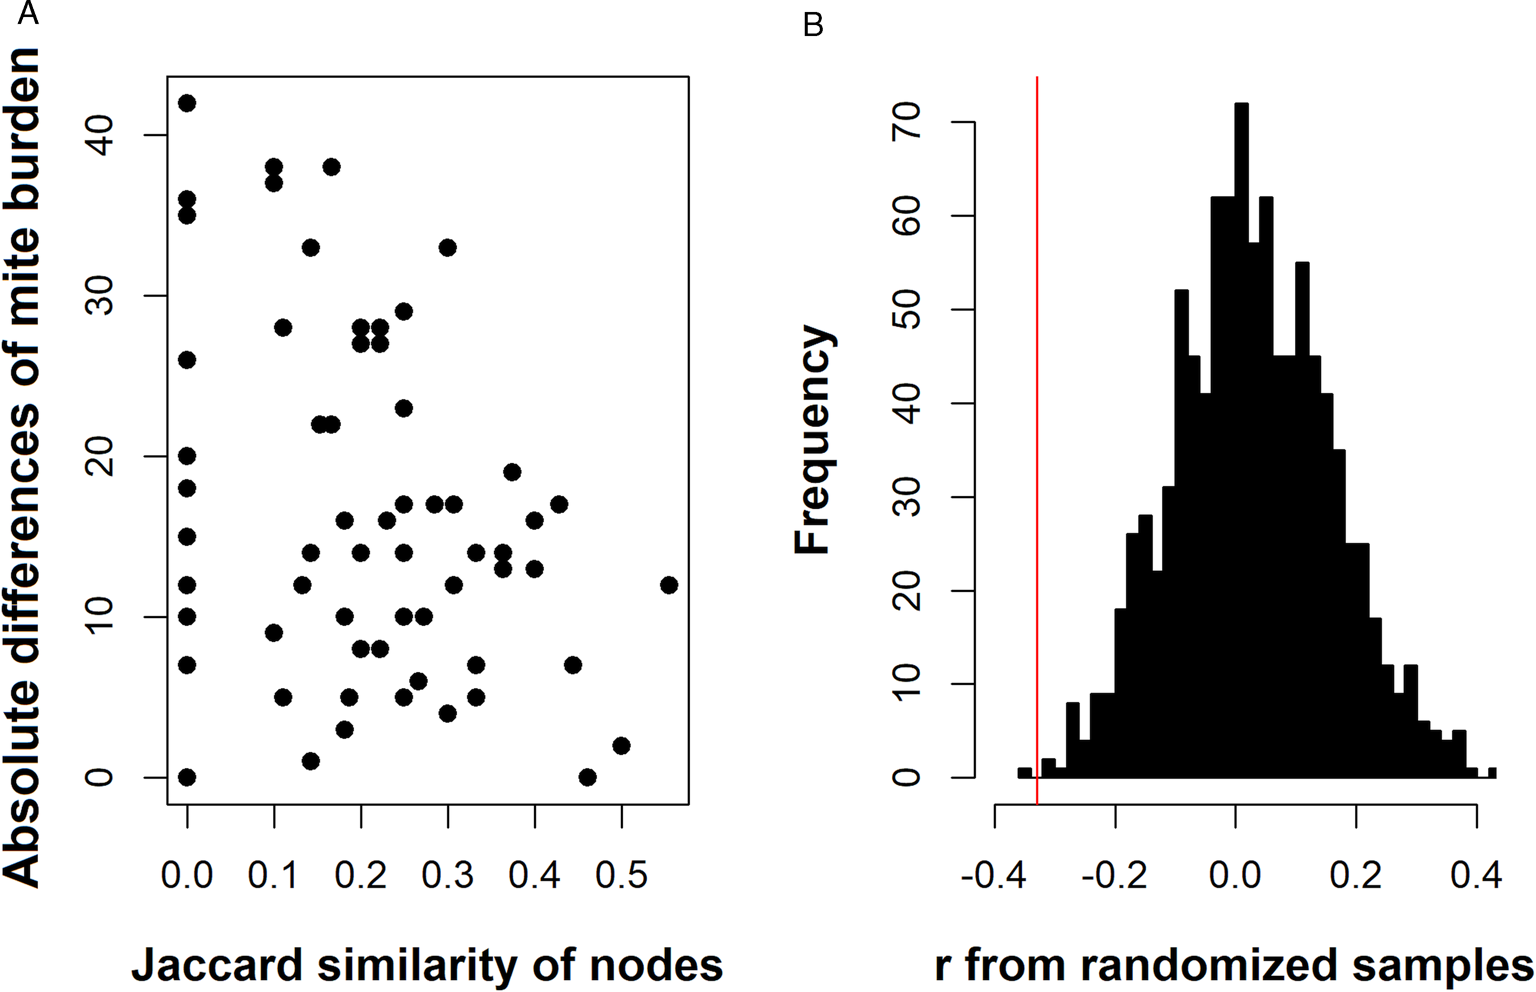
The correlation between nodes' Jaccard coefficients and absolute mean burden differences was significant (r = −0.33; P-value = 0.009) in the dry season with an absolute difference decreasing with node similarities (Fig. 4A). The randomization test demonstrated that the correlation coefficient was significant (P = 0.002; Fig. 4B). No correlation was observed in the wet season (r = 0.14; P-value = 0.32).
(A) Scatter plot of Jaccard similarity coefficients and the absolute differences in the mean individual mite burden in O. paricola in the dry season. (B) Frequency distribution of the randomized Pearson correlation coefficients (r); red line is the observed r value.

Discussion
The structure of the contact networks seems to have had a greater influence on the mite burden in the interaction between G. oudemansi and O. paricola than the rodent characteristics, such as body size, sex and age, although many studies have demonstrated a relationship between these host characteristics and abundance of ectoparasites (Fernandes et al., Reference Fernandes, Cruz and Linhares2012, Reference Fernandes, Cruz, Linhares and Von Zuben2015; Hammond et al., Reference Hammond, Hendrickson, Maxwell, Petrosky, Palme, Pigage and Pigage2019) and endoparasites (Abu-Madi et al., Reference Abu-Madi, Abu-Madi, Behnke, Mikhail, Lewis and Al-Kaabi2005; Seltmann et al., Reference Seltmann, Webster, Ferreira, Czirják and Wachter2019; Bellay et al., Reference Bellay, Oda, Almeida-Neto, Oliveira, Takemoto and Balbuena2020).
In this case, the heterogeneity in the transmission of parasites is related to the structure of the networks in the dry and wet seasons, influenced by the way the hosts use space. The degree centrality was the only factor influencing the mite burden in the dry season and the greater the similarity of connections between hosts, the smaller the difference between parasitic burdens in this season.
Seasonal variation in transmission network structures can affect the transmission of parasites. In this study, we found seasonal differences. In the dry season, the rodent network was modular; that is, the transmission network presented groups of rodent individuals interacting more within the group than with individuals from different groups. This possibly resulted from a varied use of the environment by rodent sub-groups, with contacts within each group being more frequent than those with external members of the groups, reducing transmission opportunities; as a consequence, a higher mean burden was observed among rodents with more connections than in those with less connections, and a higher heterogeneity in the distribution of the parasites was found in the dry season than in the wet season. In the wet season, the absence of modules in the transmission network indicated that O. paricola rodents used the environment more equitably or were aggregated in a single spot in the study area, which increased the opportunities for transmission among rodents, and consequently, there was a decrease in the heterogeneity of mite burden among hosts. Gourbière et al. (Reference Gourbière, Morand and Waxman2015) found that the aggregation of parasites in the host population decreased linearly with the number of encounters between hosts, indicating that when there are more contacts between hosts, the parasitic burdens become more similar and spread among the host population.
Animals interact in different social contexts, and even for solitary species, social proximity, aggressive encounters and mating contacts represent a risk of parasite transmission, especially with increased frequency of contacts (Godfrey et al., Reference Godfrey, Bull, James and Murray2009; Sah et al., Reference Sah, Mann and Bansal2018). Therefore, seasonal changes in host behaviour (e.g. in searching for sexual partners in the reproductive season, or parental care) can interfere with the parasitic burden (Monello and Gompper, Reference Monello and Gompper2010; Várfalvyová et al., Reference Várfalvyová, Stanko and Miklisová2011; Duboscq et al., Reference Duboscq, Romano, Sueur and MacIntosh2016).
Another important factor in the transmission of parasites is the asynchronous sharing of shelters. In a study on the interaction of lizards and ticks (Leu et al., Reference Leu, Kappeler and Bull2010), it was found that hosts frequently using the shelters of neighbours incurred a higher tick burden. Thus, the opportunities for direct and indirect transmission of parasites between individual hosts depended on the spatial organization of the population.
Variations in ecological conditions can alter animal behaviour and social interactions, affecting the structure of parasite transmission networks (Godfrey, Reference Godfrey2013). In the Neotropical savannas, seasonality is an important factor in the availability of food items such as insects, because the abundance of several insect groups increases during the wet season (Pinheiro et al., Reference Pinheiro, Diniz, Coelho and Bandeira2002), and fruits, which ripen at this time of year (Mantovani and Martins, Reference Mantovani and Martins1988). The aggregate pattern of the spatial organization of rodent hosts in the wet season may be related to specific feeding sites (such as places with ripe fruits) as well as to the search for mates, which can lead to higher contact rates.
In addition to the wet-season availability of food resources, some locations in the study area are flooded by water from the nearby river, and this may limit the number of shelters available and rodent vagility across the study area. The rodents that frequently use the same shelters as their neighbours are exposed to high cross-infection risk, and those that re-use their own previously occupied shelters are also exposed to the risk of self-infection. Therefore, future research may clarify the methods of transmission that occur in this area.
Variation in host density over the year can also change the number of contacts and structure of the interaction network, with the number of contacts between hosts increasing nonlinearly with host density (Borremans et al., Reference Borremans, Reijniers, Hughes, Godfrey, Gryseels, Makundi and Leirs2017). However, in our study, the mean number of contacts did not differ between seasons, although the number of rodents forming the network was greater in the dry season than in the wet season. The spatial aggregation of hosts in the wet season facilitates the transmission and dispersion of parasites, whereas in the dry season, the hosts are more dispersed throughout the area forming different groups. In the dry season, the reduction in the frequency of contacts and the possibility of using many different shelters reduces the cross- and self-infection risks. Thus, in solitary species, the frequency of contacts may be related to the availability of food and shelters in the area as well as the search for mating partners, and therefore be subject to seasonal variation. The spatial organization of hosts determines the frequency of contacts and the network structures influencing the transmission and dispersion of their ectoparasite burden.
Supplementary material
The supplementary material for this article can be found at https://doi.org/10.1017/S0031182020002231
Acknowledgements
We thank Gilberto Salles Gazêta and his team from Fundação Oswaldo Cruz for mite identification. Somayra da Silva Abreu received Master Scholarships from Fundação de Amparo à Pesquisa e ao Desenvolvimento Científico e Tecnológico do Maranhão – FAPEMA.
Financial support
This study was funded by the Fundação de Amparo à Pesquisa e ao Desenvolvimento Científico e Tecnológico do Maranhão – FAPEMA (grant number 002750/2012, to F. R. Fernandes and grant number 002680/2012, to L. D. Cruz).
Conflict of interest
The authors declare that they have no conflicts of interest.
Ethical standards
The capture of rodents and ectoparasites were approved by the Chico Mendes Institute for Biodiversity Conservation-ICMBio (SISBIO 356889-1).