I. INTRODUCTION
Direct methanol fuel cells (DMFCs) are one of the most promising power sources for mobile devices in the near future.Reference Liu, Song, Zhang, Zhang, Wang and Wilkinson1 Their main advantages are the ease with which cartridges can be replaced and their high volumetric energy density, which is about 10 times greater than that of lithium-ion batteries. However, the high cost of Pt in the catalysts in DMFCs is a critical barrier to their commercial application. It is thus necessary to improve the catalytic activity, the durability, and the productivity of the synthesis process. PtRu nanoparticle catalysts have high activities for methanol oxidation,Reference Watanabe and Motoo2 which is the anodic reaction in DMFCs. However, improved durability and synthesis productivity are still required to reduce costs. With the aim of developing highly durable catalysts, many researchers have investigated the degradation mechanism of Pt nanoparticle catalysts. In particular, coarsening of catalyst particles is a serious problem because it reduces the active surface area.Reference Borup, Davey, Garzon, Wood and Inbody3 Durability test with potential cycling to high potential [about 1.1 V versus normal hydrogen electrode (NHE)] is a standard technique.Reference Shao-Horn, Sheng, Chen, Ferreira, Holby and Morgan4 Potential cycling to high potentials (i.e., over 0.8 V versus NHE) reduced the surface area significantly due to coarsening.Reference Borup, Davey, Garzon, Wood and Inbody3, Reference Shao-Horn, Sheng, Chen, Ferreira, Holby and Morgan4 During the potential cycles, Pt that dissolves from smaller particles is likely to redeposit onto the surfaces of larger particles (Ostwald ripening). To overcome this problem, recent studies have investigated methods to suppress coarsening. Underpotential deposition (UPD) of Au clusters on Pt or PtRu nanoparticle catalysts improved the catalysis stability.Reference Zhang, Sasaki, Sutter and Adzic5–Reference Zhang, Huang, Zou, Yang, Vogel and Yang7 In UPD,Reference Sasaki, Wang, Naohara, Marinkovic, More, Inada and Adzic8 the surface potential is precisely adjusted to deposit a Cu monolayer on a Pt or PtRu substrate and the monolayer is then replaced with an adatom layer or clusters. However, it may be difficult to scale up this method to an industrial scale because it requires precise control of the electrochemical potential of the material surface for industrial quantities. In particular, it would be difficult to adjust and maintain the surface potential over the entire powder surface. It is thus necessary to develop a simple and effective process that provides enhanced durability of catalysis.
We have synthesized Pt-based bimetallic nanoparticle catalysts of PtCu/γ-Fe2O3 and PtRu/C by a radiolytic process and demonstrated that they have high catalytic activities for CO oxidationReference Yamamoto, Nakagawa, Seino and Nitani9 and methanol oxidation,Reference Kageyama, Seino, Nakagawa, Nitani, Ueno, Daimon and Yamamoto10 respectively. This radiolytic process is a very simple one-pot process in which the raw materials are mixed and irradiated in a conventional vial. In contrast to UPD, this process can be easily extended to produce the product on an order of kilograms because it fully exploits the radicals generated by irradiation by a highly penetrating electron beam from an accelerator. Radiation-induced radicals reduce aqueous ions of the precursors very rapidly and uniformly in the bulk solutionReference Belloni11; this reaction completes in a few seconds. The purpose of the present study is to apply this radiolytic method to synthesize an Au-modified PtRu/C catalyst with enhanced electrochemical durability. We briefly reported the enhanced durability of Au-modified PtRu/C synthesized by the radiolytic process,Reference Kageyama, Murakami, Seino, Nakagawa, Daimon, Yamamoto, He, Swider-Lyons, Park, Kohl and Tuller12 but we did not discuss its origin in depth.
This article reports a detailed evaluation of the Au-modified PtRu/C catalyst using transmission electron microscopy (TEM), energy-dispersive x-ray spectroscopy (EDS) in a scanning transmission electron microscope (STEM), x-ray diffraction (XRD), and x-ray absorption fine structure (XAFS) spectroscopy. Significant coarsening of the particles was observed in PtRu/C without Au, whereas no coarsening was observed for particles containing Au. We demonstrate that the Au-modified PtRu/C catalyst was obtained by the radiolytic method and its enhanced electrochemical durability is clearly correlated with the suppression of coarsening.
II. EXPERIMENTAL
A. Synthesis of PtRu/C and PtRuAu/C
The raw materials used were metal precursors of H2PtCl6·6H2O (99.9%, Wako Pure Chemical Industries, Ltd., Osaka, Japan), RuCl3·nH2O (n = 2–3, 99.9%, Wako), and HAuCl4·4H2O (99.9%, Wako), ultrapure water (resistivity: 18 MΩ·cm), carbon supports (Vulcan XC-72R, Cabot Corporation, Boston, MA), 2-propanol (Wako), NaH2PO2·H2O (Wako), and dl-tartaric acid (Wako). NaH2PO2 and dl-tartaric acid were added to reduce the particle sizeReference Daimon and Kurobe13 and to enhance alloy formation,Reference Onodera, Suzuki, Takamori and Daimon14 respectively. 2-propanol (1 vol.%) was added to enhance reduction. A 100-mL glass vial was charged with 0.5 mM Pt, 0.5 mM Ru, and 0.1 mM Au precursors and 0.5 mM phosphorus and 5 mM dl-tartaric acid. The carbon support was charged to adjust the total metal loading to 10 wt%. The vial was then irradiated with an electron beam at room temperature (dose: 20 kGy; irradiation time: 6.7 s; beam energy: 4.8 MeV; beam current: 10 mA) at Japan Electron Beam Irradiation Service Co., Ltd. (Osaka, Japan). The radiation-induced radicals reduced the precursors to form metal nanoparticles stabilized on the carbon support. For comparison, a sample without Au was also synthesized. The samples with and without Au are referred to below as PtRuAu and PtRu, respectively. The details of this radiolytic process are described in our previous articles.Reference Yamamoto, Nakagawa, Seino and Nitani9, Reference Kageyama, Seino, Nakagawa, Nitani, Ueno, Daimon and Yamamoto10
B. Characterization
The morphology of the samples was investigated by TEM (Hitachi, H-8100, Tokyo, Japan, and FEI, Tecnai G2 20 S-TWIN, Hillsboro, OR) with an acceleration voltage of 200 kV. The distributions of the constituent elements of PtRuAu were analyzed by STEM-EDS (JEOL Ltd., JEM-2100F and JED-2300T, Tokyo, Japan) with an acceleration voltage of 200 kV. The chemical composition was analyzed by x-ray fluorescence spectroscopy (XRF; Rigaku, ZSX100e, Tokyo, Japan). Crystallographic analysis was performed by XRD (Rigaku, RINT2100 Ultima) using Cu-Kα radiation. X-ray absorption spectra were measured at the beamline NW10A of the Photon Factory (Tsukuba, Japan). The chemical states of the metals were investigated by examining the x-ray absorption near-edge structure (XANES) near the Pt-L II, Ru-K, and Au-L I edges. The chemical bonds were analyzed by extended x-ray absorption fine structure (EXAFS) at the Ru-K edges. The experimental details of the XANES and EXAFS analyses are described in our previous articles.Reference Kageyama, Seino, Nakagawa, Nitani, Ueno, Daimon and Yamamoto10, Reference Nitani, Nakagawa, Daimon, Kurobe, Ono, Honda, Koizumi, Seino and Yamamoto15 The Pt-L II absorption spectrum of PtRuAu was overlapped with the Au-L II absorption so that EXAFS analysis could not be performed. In the Ru-K edge EXAFS analysis, it was impossible to distinguish between Ru–Pt and Ru–Au bonds because of the very similar reflections from Pt and Au atoms. The durability was examined by potential cycling (0.6–1.1 V versus NHE; scan rate: 5 mV/s; 50 cycles) at 35 °C in 1.5 M H2SO4. The methanol oxidation activity was evaluated by linear sweep voltammetry (LSV; 0–0.7 V versus NHE; sweep rate: 5 mV/s) at 35 °C in 1.5 M H2SO4 and 20 vol.% methanol under a nitrogen atmosphere before and after potential cycling. To evaluate changes in the morphology and crystal structure induced by potential cycling, TEM observations were performed after potential cycling. For comparison, the properties of a commercial PtRu catalyst TEC61E54 purchased from Tanaka Kikinzoku Kogyo K.K. (Tokyo, Japan) were also investigated.
III. RESULTS AND DISCUSSION
A. Structural characterization of as-prepared materials
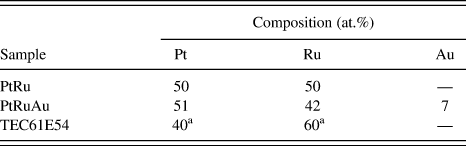
Table I lists the chemical compositions determined by XRF analysis for the synthesized samples and the commercial one (TEC61E54). The synthesized radiolytic samples had compositions (atomic ratios) of 50:50:0 for PtRu and 51:42:7 for PtRuAu. These ratios are very similar to the ratios of the respective initial loadings. Almost all the metal ions were reduced by electron beam irradiation.
Composition of PtRu/C and PtRuAu/C catalysts.
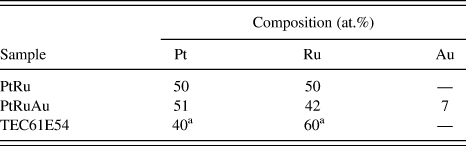
a Nominal values given by the supplier.
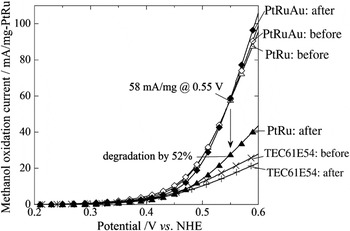
Their catalytic activities and durabilities were evaluated by LSV and potential cycling and they were compared with those of TEC61E54. Figure 1 shows LSV curves measured before and after potential cycling in which the methanol oxidation current was normalized by the mass of PtRu in the test electrode. Before potential cycling, both samples had very similar activities over the potential range used and they had higher activities than TEC61E54. After potential cycling, PtRuAu retained its initial activity within the experimental error, whereas the activity of PtRu was reduced by almost half. The current at the potential of 0.55 V versus NHE, which may be the effective potential during DMFC operation,Reference Hogarth and Ralph16 decreased from 58 mA/mg by 52%. The onset potentials of PtRu and PtRuAu before potential cycling were about 0.45 V versus NHE. After potential cycling, the onset potential of PtRu was shifted to about 0.5 V versus NHE, but no remarkable shift was found for PtRuAu. These results clearly demonstrate that the addition of Au significantly improved the durability without any reduction in the high activity. In contrast, the activity of TEC61E54 decreased by 17%.
Linear sweep voltammetry curves for PtRu/C and PtRuAu/C samples before and after potential cycling. Data points were acquired every 0.01 V.

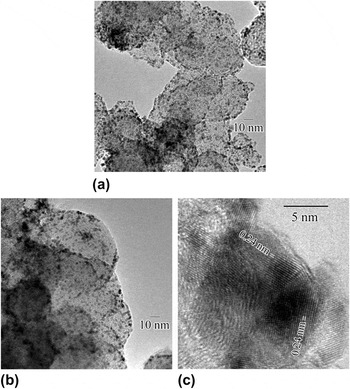
Figure 2(a) shows a typical TEM image of PtRu in which larger light regions indicate the carbon supports and smaller dark regions indicate metal particles. As seen in Fig. 2(a), metal nanoparticles that are about 2 nm in diameter in PtRu were uniformly dispersed on the carbon supports. Figure 2(b) shows a typical TEM image of PtRuAu; the particles in this image are quite similar to those in Fig. 2(a). Figure 2(c) shows larger particles with diameters of more than 10 nm that have a very low population in PtRuAu. Lattice fringes with a spacing of 0.24 nm were observed in these larger particles; they correspond to the (111) plane of Au with a face-centered cubic (fcc) structure (JCPDS No. 4-0784). These particles seem to be very rich in Au.
Transmission electron microscopy (TEM) images of as-prepared samples: (a) PtRu/C, (b) PtRuAu/C, and (c) Au-rich particles in PtRuAu/C.

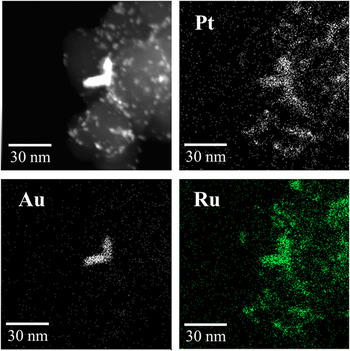
STEM-EDS analysis was performed to examine the smaller and larger particles in PtRuAu. Figure 3 shows a typical dark-field STEM image (upper left) and elemental maps of Pt, Ru, and Au obtained by EDS analysis. There are two kinds of particles: smaller ones that are about 2 nm in size and a larger L-shaped particle that has edge lengths of about 20 nm. The corresponding EDS maps indicate that Pt and Ru are distributed over regions of both kinds of particles, but that Au is only present in the larger particle. These results indicate that the smaller particles are PtRu-rich particles, whereas the L-shaped particle is Au-rich, which is consistent with the above TEM observations. However, the presence of Au in the smaller, PtRu-rich particles cannot be ruled out because their Au contents are probably too low to be detected by the present EDS system. The metal loading of the catalyst was 10 wt% and Au accounts for only 7 at.% (see Table I). The 2-nm-diameter particles may contain undetectable amounts of Au.
A dark-field scanning transmission electron microscopy image and energy-dispersive x-ray spectroscopy maps of Pt, Ru, and Au of as-prepared PtRuAu/C.

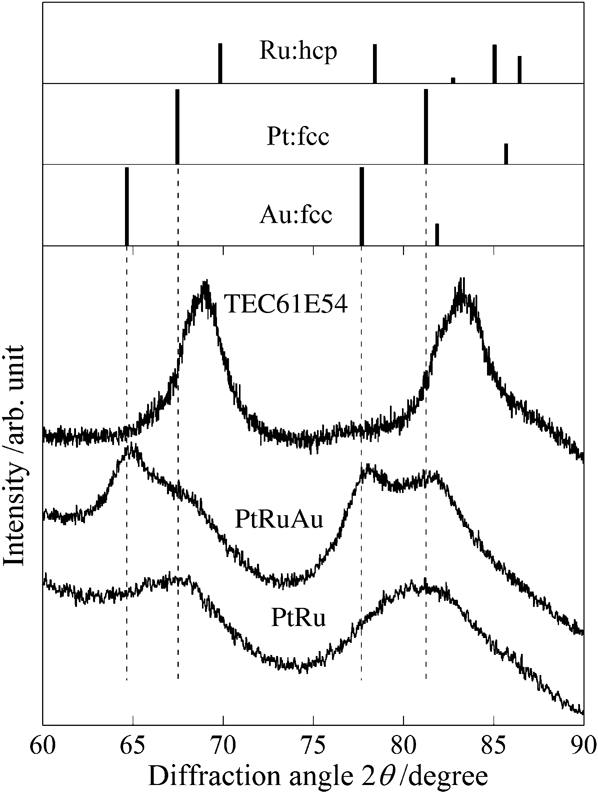
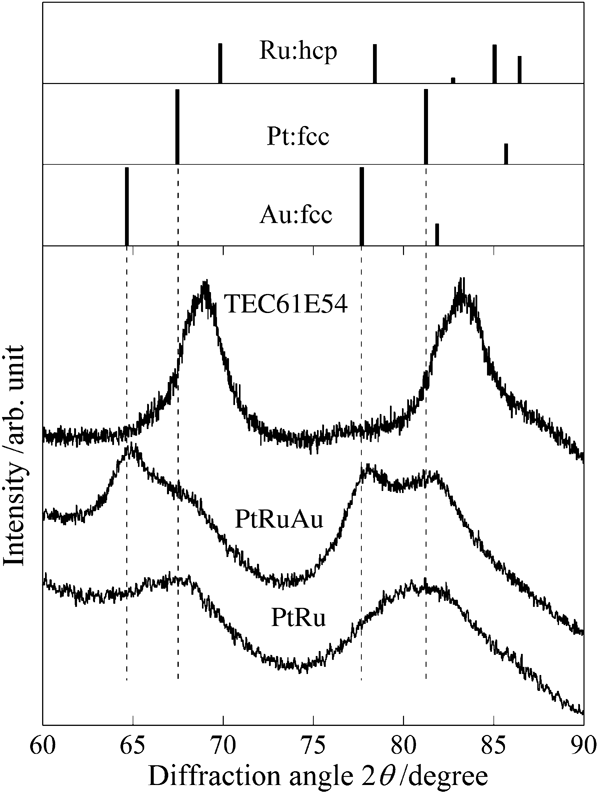
Figure 4 shows XRD patterns of PtRu, PtRuAu, and TEC61E54 along with markers for the locations of peaks for pure Pt, Ru, and Au metals. The XRD pattern of PtRu contains only peaks corresponding to Pt, and they are not significantly shifted. However, no diffraction peak due to Ru was observed, despite Ru being detected in the sample by XRF (see Table I). We noted these characteristics of the diffraction pattern of PtRu in previous studies on PtRu bimetallic nanoparticles.Reference Kageyama, Seino, Nakagawa, Nitani, Ueno, Daimon and Yamamoto10, Reference Nitani, Nakagawa, Daimon, Kurobe, Ono, Honda, Koizumi, Seino and Yamamoto15 In conjunction with the behavior of the coordination numbers of Pt–Pt, Pt–Ru, and Ru–Ru pairs determined by EXAFS analysis, we attributed these behaviors to a Pt-core/PtRu-shell nanostructure in which Ru atoms are located in a surface layer that is too thin to produce significant diffraction. Similarly, the XRD pattern of PtRuAu includes these characteristics that indicate a Pt-core/PtRu-shell structure, but it also includes peaks corresponding to Au. These Au peaks seem sharper than those of Pt and are not significantly shifted from those of pure Au. These results are consistent with the above TEM and STEM observations of the larger Au-rich particles. Significant peak shifts are observed in the XRD pattern of TEC61E54; this indicates alloying of Pt and Ru, which may be induced by the heat treatment used in the synthesis process.
X-ray diffraction patterns of the as-prepared samples. The broken lines indicate the peak positions of pure Pt and Au.
To examine the chemical states of Pt, Ru, and Au, XANES spectra were obtained near the absorption edges of Pt-L II, Ru-K, and Au-L I. XANES spectra of 2-nm-diameter nanoparticles are generally sensitive to the surface atom states because the surface atoms account for about half the atoms in such nanoparticles. Such surface atoms are likely to be oxidized because they are exposed to the environment. Consequently, a XANES spectrum that is similar to that of the oxide may be regarded as evidence of surface segregation.Reference Kageyama, Seino, Nakagawa, Nitani, Ueno, Daimon and Yamamoto10, Reference Nitani, Nakagawa, Daimon, Kurobe, Ono, Honda, Koizumi, Seino and Yamamoto15 To quantitatively estimate the degrees of oxidation, we expressed each absorption coefficient μ in terms of a linear combination of those of the metal μ metal and the oxide μ oxide.

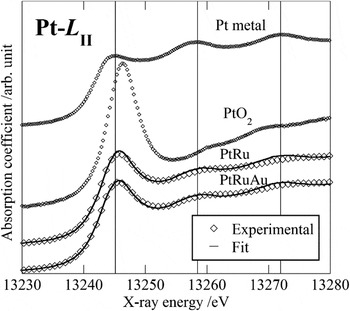
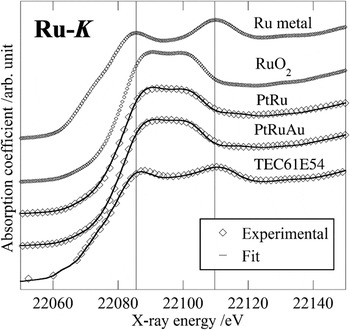
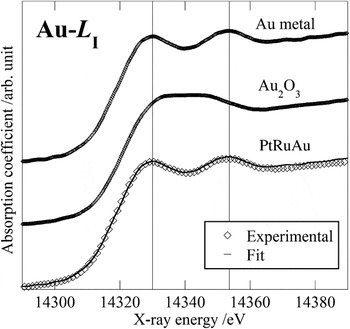
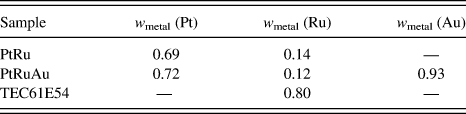
where w metal is the fraction of atoms in the metallic state and (1 − w metal) is that in the oxidized state. The Athena codeReference Ravel and Newville17 was used to optimize w metal in the energy range −20 to 35 eV near the absorption edge. The measured values of μ were well reproduced by the linear combinations. The associated R-factorsReference Ravel and Newville17 were less than 0.0005 for all the samples. Figures 5–7 show normalized XANES spectra together with curves obtained by employing the optimized w metal at the edges of Pt-L II, Ru-K, and Au-L I, respectively; for comparison, the spectra of the reference materials are also shown. The Pt-L II edge spectrum of TEC61E54 was not measured. Table II lists the optimized w metal. Both samples had significantly high Pt metal fractions w metal (Pt): 0.69 (PtRu) and 0.72 (PtRuAu). This implies that a majority of the Pt atoms exist in the metallic state in the core, but the rest of them may be oxidized in the surface layer. In contrast, the Ru metal fractions w metal (Ru) of both samples were much lower: 0.14 (PtRu) and 0.12 (PtRuAu). This implies that most of the Ru atoms are oxidized in the surface layer and the rest of them are metallic in the core.
Normalized x-ray absorption near-edge structure (XANES) spectra at the Pt-L II edge. For clarity, symbols for PtRu and PtRuAu are displayed for every third data point.

Normalized XANES spectra at the Ru-K edge. For clarity, symbols for PtRu, PtRuAu, and TEC61E54 are shown for every third data point.

Normalized XANES spectra at the Au-L I edge. For clarity, symbols for PtRuAu are shown for every fifth data point.

Optimum metal fractions, w metal, to describe experimental x-ray absorption near-edge structure spectra by the linear combination of the reference materials.
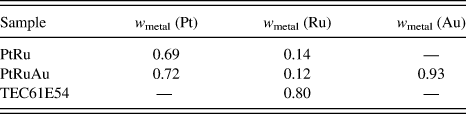
The spectral profiles of PtRu and PtRuAu are similar, as are their values for w metal. The Pt-L II spectra of PtRu and PtRuAu (see Fig. 5) are characteristic of that of Pt metal (the vertical lines at 13,245, 13,258, and 13,272 eV relate the peaks to those in the reference Pt metal spectrum). However, their absorption edge peaks are slightly shifted to higher energies; they imply partial oxidization. Their Ru-K spectra (see Fig. 6) are not characteristic of that of Ru metal (the vertical lines at 22,085 and 22,110 eV relate the peaks to those in the reference Ru metal spectrum). These spectra well resemble that of RuO2 with a plateau in the region between the lines. The spectrum of TEC61E54 (see Fig. 6) is shown for comparison. It shows that Ru is more metallic in TEC61E54 than in the present two samples. This is supported by its higher w metal for Ru of 0.80 (see Table II) than those of the present two samples. This difference in oxidized states between the present radiolytic samples and the commercial sample may be attributed to differences in their particle sizes and bimetallic structures. The particle size of TEC61E54, 3.7 nm,Reference Kageyama, Seino, Nakagawa, Nitani, Ueno, Daimon and Yamamoto10 was larger than those of the present samples, and its XRD pattern indicates significant alloying (see Fig. 4). Based on the Au-L I edge XANES spectra of PtRuAu (see Fig. 7) and w metal for Au (see Table II), most Au atoms in the sample are metallic. This is quite consistent with its XRD pattern (see Fig. 4).
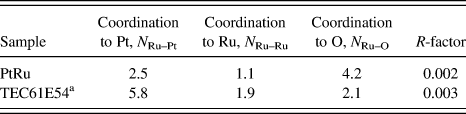
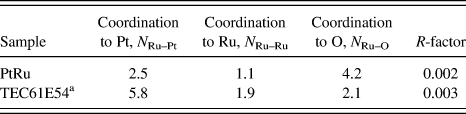
To investigate the bimetallic structure of the catalyst particles, we investigated the coordination states between Pt and Ru atoms by performing EXAFS analysis at the Ru-K absorption edge. The structural parameters were optimized by curve fitting using the Artemis code.Reference Ravel and Newville17 Details of the EXAFS analysis are described in our previous articles.Reference Kageyama, Seino, Nakagawa, Nitani, Ueno, Daimon and Yamamoto10, Reference Nitani, Nakagawa, Daimon, Kurobe, Ono, Honda, Koizumi, Seino and Yamamoto15 The EXAFS analysis was performed by assuming Ru–O, Ru–Ru, and Ru–Pt bonds. Table III lists the resulting optimized parameters. We confirmed that the present analysis is sufficiently reliable to discuss the bimetallic substructures because the associated R-factorsReference Ravel and Newville17 were reasonably low (0.002–0.003). We checked possible coordination between phosphorus atoms and Pt or Ru atoms but failed to obtain any reasonable converging solution. We thus conclude that phosphorus is not present in the metallic particles.
Structural parameters obtained by extended x-ray absorption fine structure analysis at the Ru-K edge.
a Data for TEC61E54 were obtained in our previous study.Reference Kageyama, Seino, Nakagawa, Nitani, Ueno, Daimon and Yamamoto10
Based on these values for N Ru–Pt, N Ru–Ru, and N Ru–O of PtRu, the following points should be noted. N Ru–O is larger than N Ru–Pt and N Ru–Ru. This is consistent with the Ru-K edge XANES spectra indicating that Ru atoms are in the oxidized state, which implies that Ru atoms prefer to be located at the surface and are significantly oxidized. However, Ru atoms are not fully oxidized; rather, they have significant bonds with Ru and Pt at the surface because the value of N Ru–Pt + N Ru–Ru is comparable to that of N Ru–O and some Pt atoms are located at the surface, as shown in the XANES analysis. Since the XRD peak of Pt did not exhibit significant shift, the particle core must mainly consist of Pt. This Pt-core/PtRu-shell structure was inferred from EXAFS results in our previous study.Reference Kageyama, Seino, Nakagawa, Nitani, Ueno, Daimon and Yamamoto10, Reference Nitani, Nakagawa, Daimon, Kurobe, Ono, Honda, Koizumi, Seino and Yamamoto15 In the present study, Pt-core/PtRu-shell structure is obtained with the same synthesis condition.Reference Kageyama, Seino, Nakagawa, Nitani, Ueno, Daimon and Yamamoto10 EXAFS results for PtRuAu are not available; however, it is expected to have a similar Pt–Ru bimetallic structure. This structure may have been slightly modified by the addition of a tiny amount of Au, which enhanced the electrochemical durability. The values of N Ru–Pt, N Ru–Ru, and N Ru–O for TEC61E54 can be easily explained. Ru atoms alloy well with Pt in TEC61E54, and they are less oxidized than in PtRu. This is well consistent with its large particle size and remarkable peak shifts in its XRD pattern.
B. TEM observations before and after potential cycling
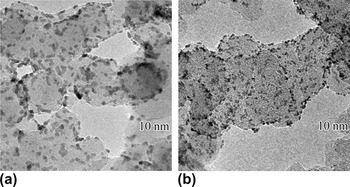
Morphological changes in the metal particles caused by potential cycling were examined by performing TEM observations before and after cycling. Figures 8(a) and 8(b), respectively, show typical images of PtRu and PtRuAu after potential cycling at the same magnification. After cycling, the particles in PtRu have increased in size and their shapes have become more elliptical relative to the particles observed before cycling [see Fig. 2(a)]. In contrast, the particles in PtRuAu showed no significant change in size or shape [see Fig. 8(b)]. This demonstrates that Au addition stabilized the morphology of 2-nm-diameter particles.
TEM images of (a) PtRu/C and (b) PtRuAu/C after potential cycling.

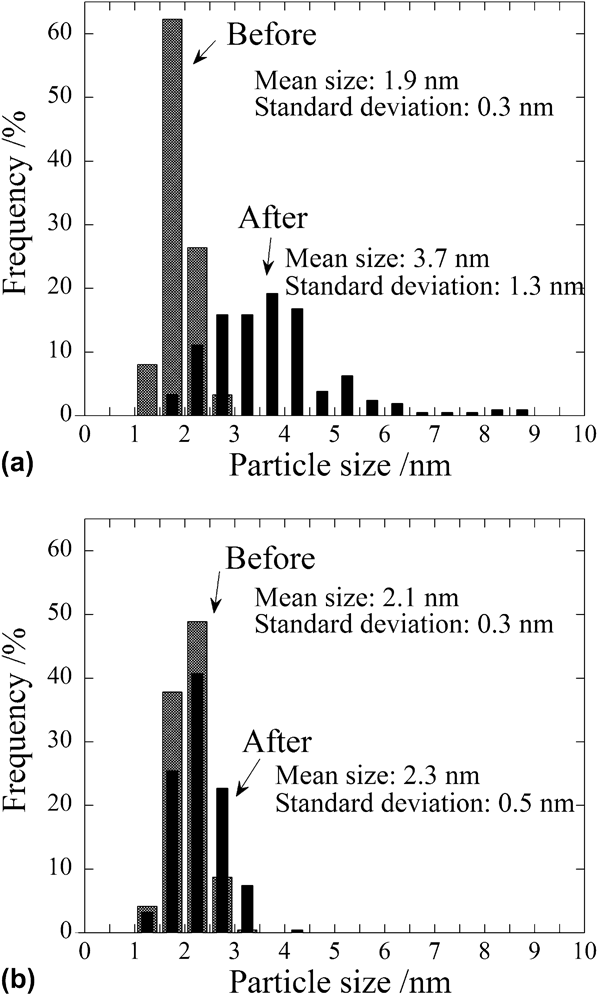
Figure 9(a) shows particle size histograms of PtRu before and after potential cycling; the particle sizes were obtained from TEM micrographs. The remarkable particle coarsening and broadening of the size distribution were revealed. Before and after potential cycling, the average particle sizes are 1.9 and 3.7 nm and the standard deviations are 0.3 and 1.3 nm, respectively. However, PtRuAu did not exhibit any significant coarsening or broadening. As shown in Fig. 8(b), it maintained its original morphology after cycling [see Fig. 2(b)]. Before and after potential cycling, the average sizes are 2.1 and 2.3 nm and the standard deviations are 0.3 and 0.5 nm, respectively. The large Au-rich particles did not exhibit any significant morphological change.
Histograms of (a) PtRu/C and (b) PtRuAu/C before and after potential cycling.
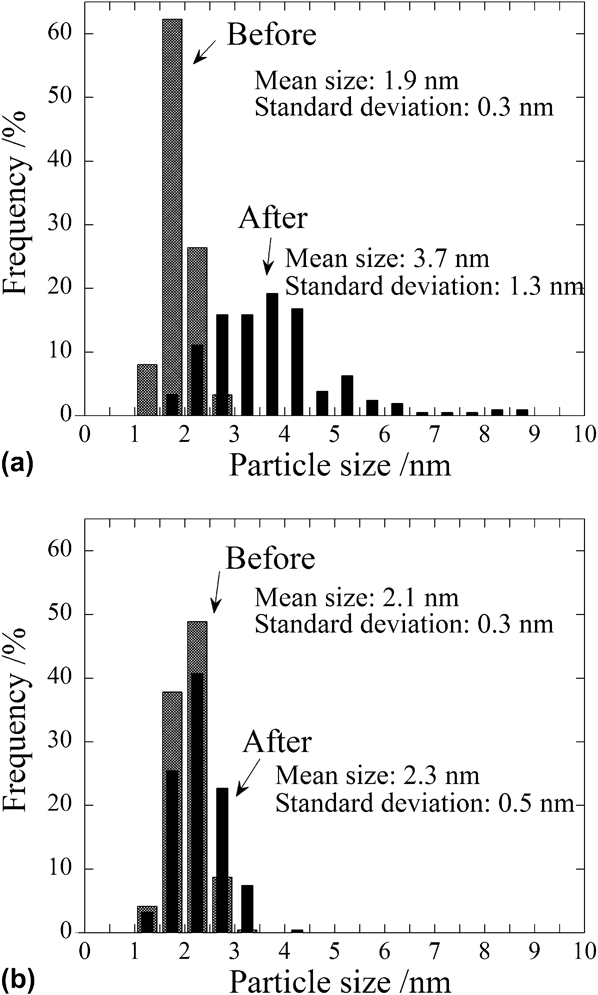
In summary, before potential cycling, PtRu and PtRuAu exhibited quite similar morphologies, average sizes, and size distributions, but they showed remarkable differences after cycling. These differences are probably correlated with the difference in the electrochemical durability. It is very clear that the addition of Au prevents coarsening and reduction of the catalytic activity of the 2-nm-diameter bimetallic particles.
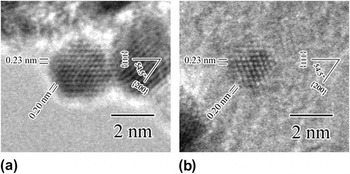
To investigate the crystallinity change induced by potential cycling, higher magnification TEM images were obtained and compared. Figures 10 and 11 show TEM micrographs obtained before and after cycling, respectively. Figures 10(a) and 10(b), respectively, show typical TEM images of PtRu and PtRuAu before cycling. They show spherical particles with high crystallinities. Lattice spacings of 0.23 and 0.20 nm with an angle of 54.5° are observed for both the samples; these are, respectively, attributed to the {111} and {200} planes of Pt with a fcc structure (JCPDS, No. 4-0802).
TEM images of as-prepared (a) PtRu/C and (b) PtRuAu/C and their lattice fringes.

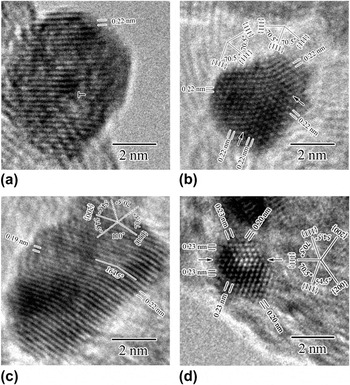
TEM images of the samples after potential cycling and their lattice fringes. (a), (b), and (c) show particles in PtRu/C; (b) shows a particle in PtRuAu/C.

Figures 11(a)–11(c) show typical images of PtRu after cycling. In contrast to Fig. 10(a), they exhibit crystal imperfections, significant coarsening, and concavo–convex shapes. Figure 11(a) shows a particle that has been spherically coarsened to diameter of about 7 nm. It has a dislocation (labeled by the symbol “T” in the figure). However, the lattice strains do not appear to be localized about the dislocation because nonuniform contrasts in the particle are not concentrated about the dislocation, but rather they spread over the remaining region. The lattice spacing of 0.22 nm corresponds to the {111} plane of fcc Pt. Figure 11(b) indicates the presence of a multiple twin and a concavo–convex shape after cycling. Mirror symmetry was observed at the twin planes indicated by the arrows. The lattices with a spacing of 0.22 nm make an angle of 70.5° to the {111} planes of fcc Pt. Figure 11(c) shows an image of a grown and elongated particle with a concavo–convex shape. Lattice fringes are observed with spacings of 0.19 and 0.22 nm, and they make an angle of 164.5°. These lattice spacings and angles imply the presence of twin planes of Pt with a fcc structure because the angle of 164.5° is equal to the sum of 54.5 and 110°, which are respectively the angle between the {111} and {200} planes and the angle between two {111} planes. All the above observations indicate that potential cycling not only causes simple growth but it also simultaneously produces various crystal defaults.
Figure 11(d) shows a typical high-magnification image of a particle in PtRuAu after cycling. As noted above, only slight coarsening occurred. The lattice fringes corresponding to the {111} and {200} planes of the Pt fcc structure were observed, and twin occurrence was observed (indicated by arrows in the figure). In contrast to PtRu, no concave surface was observed. The suppressed particle growth in PtRuAu may be due to suppression of dissolution of the constituent elements of the particle, Ru and/or Pt. This suppression must be due to incorporation of Au atoms in or on the particles. However, no direct information about the state of the Au atoms is available at this stage in the investigation.
C. Pt–Ru substructure modified with Au atoms
To summarize the results for the electrochemical durability and the material characterization of the radiolytic trimetallic catalyst PtRuAu, improved durability on Au addition is evident, but the state of the Au atoms and their role in this improvement are rather unclear. The chemical analysis clearly indicates the presence of Au in the samples, and the TEM-EDS analysis reveals the presence of large but sporadic Au particles that have XRD peaks corresponding to those of pure metallic Au. The catalytic activity should be attributed to smaller particles that are 2 nm in size. TEM-EDS analysis revealed the presence of Pt and Ru, but not Au (probably because the Au content was too low and the particles were too small). They exhibited similar XANES and EXAFS results as those in our previous study for radiolytic PtRu bimetallic catalysts,Reference Kageyama, Seino, Nakagawa, Nitani, Ueno, Daimon and Yamamoto10, Reference Nitani, Nakagawa, Daimon, Kurobe, Ono, Honda, Koizumi, Seino and Yamamoto15 which had a bimetallic structure of Pt-rich core/PtRu shell. This structure is favorable for methanol oxidation catalysis because of the enhanced density of Pt–Ru atomic pairs on the surface. These pairs prevent CO poisoning of the catalyst by the bifunctional mechanism.Reference Watanabe and Motoo2 This core–shell structure in PtRuAu is reasonable because the same radiolytic process was used,Reference Kageyama, Seino, Nakagawa, Nitani, Ueno, Daimon and Yamamoto10, Reference Nitani, Nakagawa, Daimon, Kurobe, Ono, Honda, Koizumi, Seino and Yamamoto15 and the present PtRu showed highly reproducible XRD, XANES, and EXAFS results. We conjecture that Au atoms are in/on the particles with a bimetallic structure of Pt-rich core/PtRu shell and that the Au contents are too low to be detected in these analyses. Since PtRu and PtRuAu have quite similar LSV curves before cycling, they should have quite similar surfaces because the LSV curve is generally sensitive to the surface.Reference Kageyama, Seino, Nakagawa, Nitani, Ueno, Daimon and Yamamoto10, Reference Nitani, Nakagawa, Daimon, Kurobe, Ono, Honda, Koizumi, Seino and Yamamoto15 However, the drastic difference in the catalysis degradation after cycling may indicate that very few Au atoms contribute to the improved durability.
We conjecture that the Au atoms must exist in the PtRu particle, and not only on it, based on the nature of the radiolytic synthesis. Aqueous Au ions should be far more easily reduced than aqueous Pt and Ru ions based on their redox potentials. In fact, we found that Pt and Au readily form well-mixed alloy nanoparticles by the radiolytic process.Reference Yamamoto, Nakagawa, Seino and Nitani9, Reference Kageyama, Seino, Nakagawa, Nitani, Ueno, Daimon and Yamamoto10 The Au-rich particles may not be formed by irradiation because their population is very low and Au ions could be reduced by other triggers, such as solvent temperature, 2-propanol, and light.
D. Stabilized Pt–Ru particles by Au atoms
Comparison of the particle morphologies of PtRu and PtRuAu after cycling (see Figs. 8, 9, and 11) indicates that Au addition stabilized the 2-nm nanoparticles. From the above considerations, this stabilization can be attributed to Au atoms incorporated in the structure of Pt-rich core/PtRu shell. During electrochemical cycling, the constituent metal species should dissolve and redeposit onto the particle surfaces. Based on their redox potentials, Ru dissolves most easily, followed by Pt and Au and Au ions redeposit followed by Pt and Ru ions. As reported in many studies, Pt dissolves and redeposits and then deforms and grows under the severe electrochemical conditions in fuel cells.Reference Shao-Horn, Sheng, Chen, Ferreira, Holby and Morgan4 Under such a cycling potential environment, Pt should play the main role in reforming the morphology of the PtRu binary particles since Pt dissolves later and redeposits earlier to form a scaffold for the renewed structure. Au may be inert because it is the most stable species. In the present potential cycling, Ostwald ripening must occur because dissolution and redeposition readily occur in potentials above 0.8 V in the aqueous phaseReference Shao-Horn, Sheng, Chen, Ferreira, Holby and Morgan4 (the present potentials were in the range 0.6–1.1 V). This ripening must have led to serious coarsening, and consequently, the activity was degraded (see Fig. 1).
On the other hand, Au-added PtRuAu did not show any of these changes on cycling. Rather, they maintained the original particle size and distribution, spherical shape, and high crystallinity with little imperfections on cycling. The incorporation of Au atoms probably inhibited the dissolution of metals. This effect of Au has been reported by some researchers who used x-ray photoelectron spectroscopy to investigate the relationship between the electronic structure of metal and the resistance to dissolution. Liang et al.Reference Liang, Zhao and Xu6 reported that Au decoration on PtRu nanoparticle gave rise to a positive shift in the binding energy of the Ru 3p orbital and a consequent decrease in Ru dissolution. Zhang et al.Reference Zhang, Huang, Zou, Yang, Vogel and Yang7 reported that Au decoration on Pt nanoparticles gave rise to a positive shift of the binding energy of the Pt 4f orbital and inhibited the dissolution of Pt. These positive shifts of the binding energies imply charge transfer from Pt and Ru to Au. Similar charge transfer in Pt or Ru could inhibit their dissolution in the present PtRuAu catalysts. Further research is necessary to clarify the mechanism and the precise state of the Au atoms.
IV. CONCLUSIONS
We have synthesized highly durable PtRuAu/C catalysts by a radiolytic process involving electron beam irradiation. The results of durability tests combining LSV and potential cycling indicate that the addition of Au to the initial solution significantly improves the durability without reducing the high activity. Material characterization was performed by TEM, STEM, XRD, XANES, and EXAFS. The catalysts contain 2-nm-diameter metal particles that have a Pt-core/PtRu-shell structure. After potential cycling, the metal particles in PtRu/C without Au exhibited significant coarsening (1.9–3.7 nm), changes in shape, and various crystal imperfections caused by Ostwald ripening. In contrast, PtRuAu/C was highly stable. Considering the synthesis mechanism, Au atoms incorporated in the particles of Pt-core/PtRu-shell structure would inhibit Ostwald ripening and consequently enhance the durability. Further study is necessary to determine the substructure of these trimetallic particles and its correlation with the electronic structure.
ACKNOWLEDGMENTS
The authors thank K. Ueno (EBIS, Japan) for providing us time on the electron accelerator and T. Onodera (Hitachi Maxell, Ltd.) for assistance with the electrochemical measurements. The TEM observations were supported by Osaka University Trans-disciplinary Graduate and Refresher Programs for Education, Research and Training in the Fields of Nanoscience and Nanotechnology. This research was partially supported by a Grant-in-Aid for Scientific Research (No. 22241023) from the Ministry of Education, Culture, Sports, Science and Technology of Japan.