INTRODUCTION
In India, sorghum is grown during both rainy and post-rainy seasons. Rainy-season sorghum is mainly becoming an industrial crop, while post-rainy season sorghum is used for food. Due to climate change, dry spells can occur any time during the growing season and water stress at crucial growth stages may become a major constraint to agricultural production. In the scenario of climate change, understanding of the yield-limiting factors and development of new strategies for breeding programmes is essential (Sener et al. Reference Sener, Arslan, Soysal and Erayman2009), and more research is needed to develop new varieties (Eitzinger et al. Reference Eitzinger, Orlandini, Stefanski and Naylor2010).
The entire sorghum crop growth period is divided into three main stages of growth, viz. growth stage 1 (GS1) starting from planting to panicle initiation, growth stage 2 (GS2) from panicle initiation to flowering and growth stage 3 (GS3) from flowering to physiological maturity (Eastin Reference Eastin, Rao and House1972; Vanderlip & Reeves Reference Vanderlip and Reeves1972; Zadoks et al. Reference Zadoks, Chang and Konzak1974; Rao et al. Reference Rao, Seetharama, Kiran Kumar and Vanderlip2004). Previous studies have indicated that drought at any of these three growth stages can cause substantial yield losses in sorghum (Tuinstra et al. Reference Tuinstra, Grote, Goldsbrough and Ejeta1997). A number of known physiological traits have been associated with drought tolerance: earliness, reduced leaf area, leaf rolling, wax content, efficient rooting system, presence of awns and yield stability, as well as reduced transpiration resulting in higher water-use efficiency, stomatal closure and osmotic adjustment (Mitra Reference Mitra2001). Biochemical traits also identified include the accumulation of proline, polyamine and trehalose together with increased nitrate reductase activity (Mitra Reference Mitra2001).
Mutava et al. (Reference Mutava, Prasad, Tuinstra, Kofoid and Yu2011) reported large variability for phenology, physiological traits and yield components related to drought in sorghum. Even at a reduced total root mass, root length and depth may be increased in a drying soil (Blum Reference Blum2005). Water use in space and time is influenced by root distribution, density and resistance. The rate of growth and spread of roots can affect water-use efficiency, particularly in the early stages of crop growth. Patil & Biradar (Reference Patil and Biradar2005) found that more roots resulted in greater accessibility to moisture and nutrients.
Reduced stomatal conductance has been found to result in higher transpiration efficiency (TE) and higher biomass (Xin et al. Reference Xin, Aiken and Burke2009). Stomatal aperture can be significantly influenced by factors such as osmotic adjustment, determining TE under water stress. Genetic variation is shown by crop plants for stomatal characteristics such as stomatal density, aperture size, opening patterns and sensitivity to changes in internal plant water status and soil water status (Ludlow Reference Ludlow, Turner and Kramer1980; Farquhar & Richards Reference Farquhar and Richards1984; Markhart Reference Markhart1985). Higher rates of osmotic adjustment are correlated to yield and biomass under drought conditions in sorghum (Ludlow et al. Reference Ludlow, Santamaria and Fukai1990; Santamaria et al. Reference Santamaria, Ludlow and Fukai1990). Osmotic adjustment helps to maintain higher LRWC at low leaf water potential (Blum Reference Blum2005). The plant adaptation by osmotic adjustment brings about deeper root growth and increased root length (Tangpremsri et al. Reference Tangpremsri, Fukai, Fischer and Henzell1991).
In sorghum, the stay-green trait (maintenance of green stems and upper leaves during grain filling even when water is limiting) is an important trait associated with improved adaptation to post-flowering drought situations in post-rainy sorghum (Borrell et al. Reference Borrell, Hammer and Douglas2000; Subudhi et al. Reference Subudhi, Rosenow and Nguyen2000). Higher grain yield in stay-green compared with senescent genotypes is associated with the maintenance of higher green leaf area at maturity, leaf nitrogen status and TE (Borrell & Hammer Reference Borrell and Hammer2000). The stay-green trait has been significantly correlated to chlorophyll content measured by a soil plant analytical development (SPAD) chlorophyll meter (Xu et al. Reference Xu, Rosenow and Nguyen2000; Talwar et al. Reference Talwar, Surwenshi and Seetharama2009).
Breeding for resistance is slow, since drought tolerance is the expression of many component traits and drought can occur at any growth stage. The resistance mechanism involves various morphological, physiological and biochemical traits. Also, the intensity of drought varies from year to year. Breeding for widely adapted drought-tolerant lines is difficult, as compared with breeding for genotypes adapted for a specific environment. Reddy et al. (Reference Reddy, Rao, Deb, Stenhouse, Ramaiah, Ortiz, Bantilian, Deb, Gowda, Reddy, Obilana and Evenson2004) have identified improved R, A (male and female parents of hybrid) and B lines (maintainer of A line) in sorghum for drought tolerance through empirical screening. Due to global warming and rainfall being low and highly erratic, there is a need to have high-yielding genotypes tolerant to drought at all growth stages. Hence, the main objectives of the present study were to (1) understand the traits associated with drought tolerance at various growth stages and (2) identify stable genotypes across stress at all stages of growth in sorghum.
MATERIALS AND METHODS
Three crosses, namely SPV 772 × S-35, SPV 772 × ICS V272 and S-35 × SU 663 were developed at Udaipur Centre of the All India Coordinated Sorghum Improvement Project (AICSIP) in India (9°10′N, 73°40′E, 105 m asl). SPV 772 and SU 663 are elite varieties from Udaipur centre and S-35 and ICSV 272 are drought-tolerant sources. The F1s were raised at Udaipur and the F1 seed of the first two crosses were distributed for evaluation to three centres, Akola (20°43′N, 77°0′E, 282 m asl), Coimbatore (10°59′N, 72°54′E, 404 m asl) and Surat (20°58′N, 72°54′E, 2 m asl), while a third cross was sent to Udaipur centre. Fifty-seven selections were made for improved drought tolerance on the basis of agronomical performance under natural water deficit conditions. These 57 F3s were evaluated at three centres: Coimbatore, Kovilpatti (9°10′N, 77°52′E, 105 m asl) and Udaipur, and 25 superior selections based on productivity under water deficit conditions were made. The F4 and F5 of these 25 derivatives (selected over the locations) and two high-yielding genotypes showing moderate drought tolerance, namely C43 (male parent of the commercial hybrid CSH 16, tolerant to drought) and CSV 17 (a pure line commercial cultivar released for drought-prone areas) used as check plants, were screened for drought tolerance during the rain-free months of April–June in both 2007 and 2008. The experiment was carried out at the Agricultural Research Station, Tamil Nadu Agricultural University, Kovilpatti. The soil was a typical vertisol with depth of 1100–1200 mm, bulk density of 1·21–1·36 kg/m3, infiltration rate of 9 mm/h and soil moisture of 350 g/kg of soil at field capacity. The soil had a clay content of 46·4–61·2% by volume, with 10·0–17·5% by volume silt and 12·6–24·5% by volume of coarse sand.
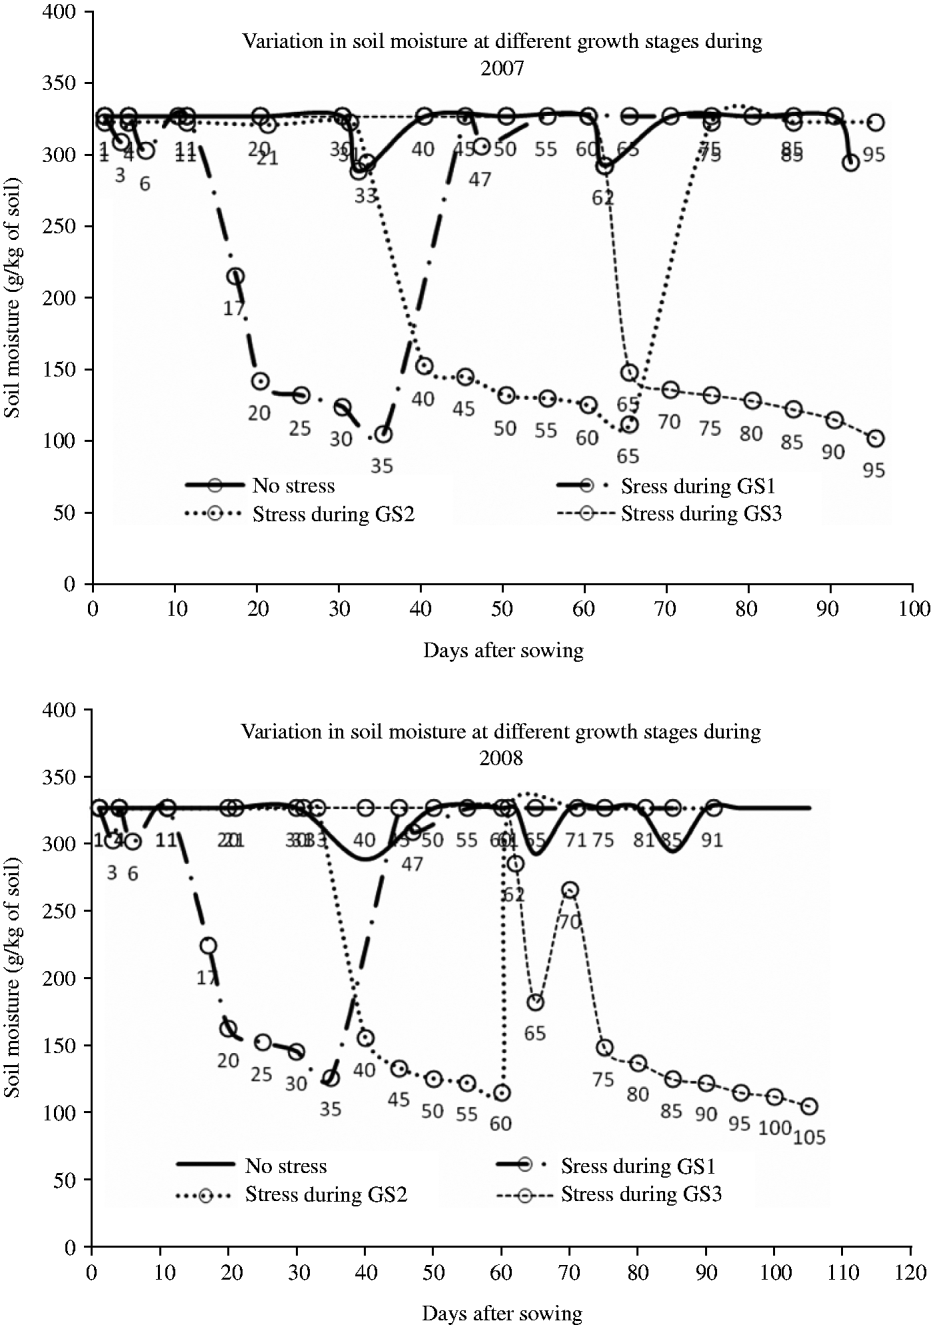
Before sowing each experiment, observations on soil fertility status (168 kg N/ha, 18·4 kg P/ha and 250·0 kg K/ha), water holding capacity (soil moisture of 340 g/kg of soil) and wilting point (150 g/kg of soil) were noted. The experiment was laid out in a factorial randomized block design with three replications adopting a normal spacing of 450 × 150 mm with a plot size of 2·7 × 3·0 m. Land was prepared by deep ploughing, discing and harrowing. Atrazine (1·0 kg/ha a.i.) was applied after sowing. A basal fertilizer dose of 42 kg N/ha and 42 kg P2O5/ha was applied just before sowing and a top dressing of 46 kg N/ha was applied 1 month after germination (floral initiation stage). In each generation (F4 and F5), four trials were conducted to induce four levels of water stress during different phases of crop growth (viz. vegetative (GS1), pre-flowering (GS2) and post-flowering (GS3)) along with the control (no stress, i.e. normal irrigation). Treatments were imposed by withholding irrigation during different growth stages during both years (Fig. 1). The irrigation was scheduled based on growth stage, and soil moisture content was monitored regularly. The soil moisture was 105–126, 112–115 and 102–105 g/kg of soil during GS1, GS2 and GS3, respectively, compared with c. 300 g/kg of soil under well-watered conditions. The soil moisture content was monitored gravimetrically (Black Reference Black1965) at regular intervals (Fig. 1). A total of eight environments were created in 2 years as given below:
1. E1 = (GS1) Stress at vegetative phase (20–35 days) during 2007.
2. E2 = (GS1) Stress at vegetative phase (20–35 days) during 2008.
3. E3 = (GS2) Stress at flowering phase (40–65 days) during 2007.
4. E4 = (GS2) Stress at flowering phase (40–60 days) during 2008.
5. E5 = (GS3) Stress at maturity phase (70–115 days) during 2007.
6. E6 = (GS3) Stress at maturity phase (70–115 days) during 2008.
7. E7 = (Control) No stress − Control during 2007.
8. E8 = (Control) No stress − Control during 2008.
Observations on grain yield, straw yield and plant height were recorded at maturity for each environment. The methodologies of recording other physiological traits are given below.
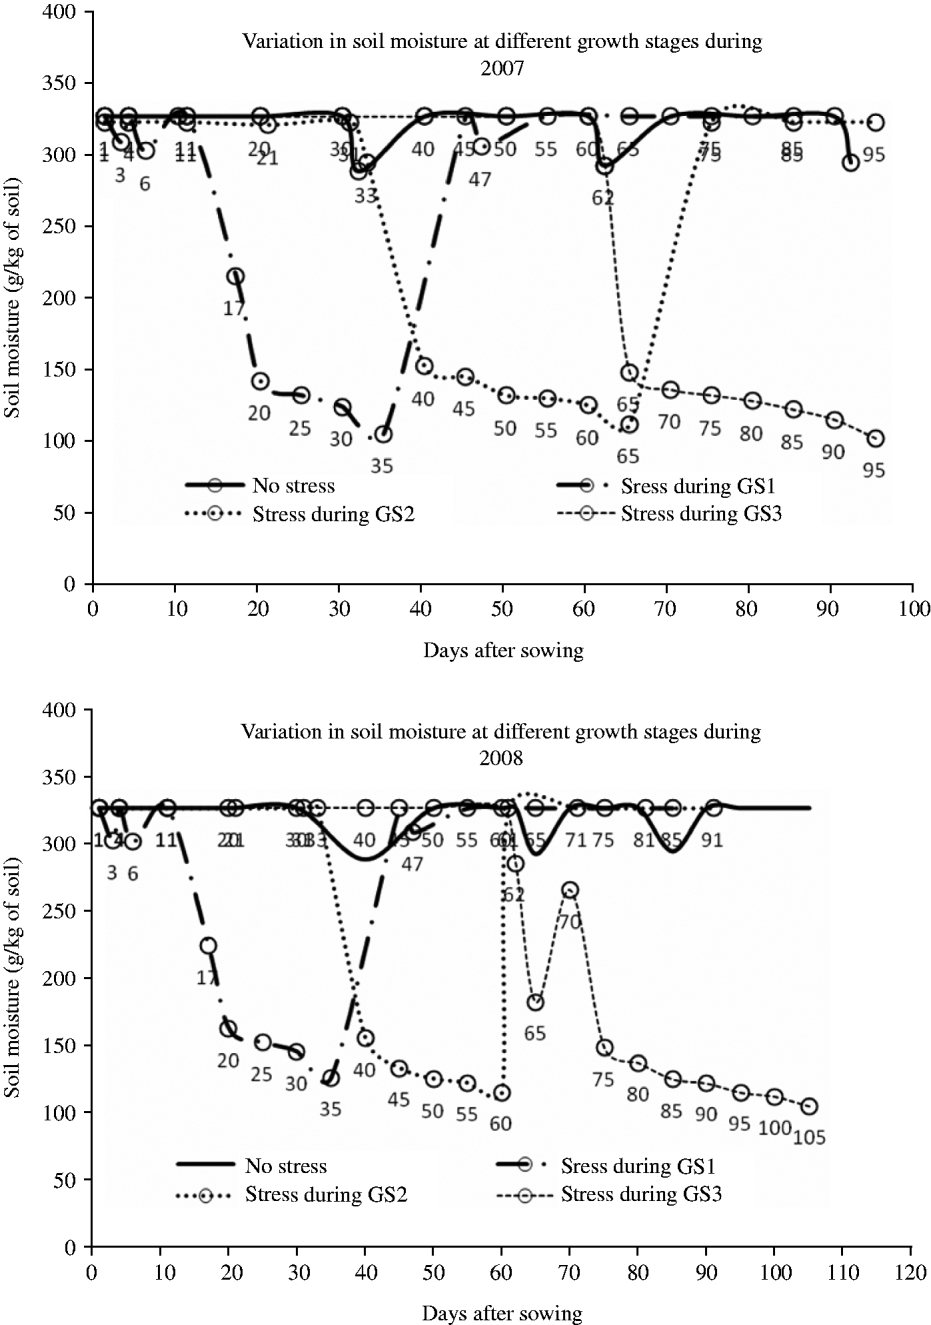
Variations in soil moisture in different treatments of stress created during different growth stages during 2007 and 2008. Digits below the circles indicate soil sampling times in days after sowing.
Root number and root length
At the end of each treatment period, experimental plots were soaked by irrigation and five plants were dug up at random, each with 300 × 450 × 600 mm of soil; the soil attached to the plants was washed off and measurements taken of the number and lengths of roots (Sankarapandian & Bangarusamy Reference Sankarapandian and Bangarusamy1995).
LRWC
The LRWC was measured according to the procedure of Weatherley (Reference Weatherley1950). For all stages of the crop, the physiologically active leaf (fully expanded fourth leaf from the top) was taken for observations. The leaf water content was measured between 10·00 h and 12·00 h. Ten cuttings of 625 mm2 were collected from each leaf and fresh weight measured immediately (W1). The cuttings were immersed in distilled water in Petri dishes for 8 h. Subsequently, the cuttings were wiped dry with tissue paper to remove free water from the leaf surface and weighed (W2). The leaf cuttings were dried in an oven for 48 h at 80 °C and dry weights were recorded (W3)
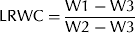 $${\rm LRWC} = \displaystyle{{{\rm W}1 - {\rm W}3} \over {{\rm W}2 - {\rm W}3}}$$
Chlorophyll content
Chlorophyll content was measured as chlorophyll content index (CCI) by a SPAD chlorophyll content meter (Model CCM-200 plus, ADC Bioscientific Ltd, UK). For all stages of the crop, the physiologically active leaf (fully expanded fourth leaf from the top) was taken for observations. Data were recorded on five plants at 10 locations in each leaf to cover the whole lamina.
Stomatal conductance
Stomatal conductance (mmol/m2/s) was measured by a steady-state porometer (PMR 5) (Sritharan & Vijayalakshmi Reference Sritharan and Vijayalakshmi2008). For all stages of the crop, the physiologically active leaf (fully expanded fourth leaf from the top) was taken for observations. This observation was taken between 10.00 and 12.00 h and leaf temperature was c. 27–28 °C for each of the four trials (i.e. imposing stress at GS1, stress at GS2, stress at GS3 and no stress).
Statistical analysis
Data collected over the eight environments were analysed using the model of Eberhart & Russell (Reference Eberhart and Russell1966) to study stability. Simple correlations were computed with Statistix version 8.1 (Analytical Software, Tallahassee, FL, USA). Partial least square (PLS) analysis was carried out for each environment with the help of the statistical package SAS version 9.3 (SAS Institute, Carey, NC, USA). The grain and fodder yields were taken as dependent/response variables, and plant height, number of roots, root length, LRWC, chlorophyll content and stomatal conductance as independent/predictor variables. For each environment, three PLS models were tried: (i) grain yield as dependent variable, (ii) straw yield as dependent variable and (iii) grain yield and straw yield as dependent variables. Coefficients of determination (R 2) and root mean prediction residual error sum of squares (PRESS) were used to select the best models. The variable importance projection (VIP) of independent variables represented the value of the variable in fitting the PLS model for both predictors and responses. The VIP for each factor was defined as the square root of the weighted average times the number of predictors. If a predictor had a relatively small coefficient (in absolute value) and a small value of VIP, then it was a prime candidate for deletion (Wold Reference Wold and van de Waterbeemd1994). Variables with VIP values less than 0·8 and outliers were removed from the variable list.
Stability analysis
Stability analysis was carried out according to Eberhart & Russell (Reference Eberhart and Russell1966) by using Windostat version 7.1 (Ameerpet, Hyderabad, India). In the model, sum of the mean squares attributable to environment and genotype × environment (G × E) interactions is partitioned into three components, viz. environment (linear), G × E (linear) and deviations from regression (pooled deviation over all genotypes). A linear model proposed by Eberhart & Russell (Reference Eberhart and Russell1966) is
 $$Y_{ij} = \mu _i + \beta _i I_j + \delta _{ij} $$
where Y ij is the mean performance of the ith variety (i = 1, 2, 3,…,v) in jth (j = 1,2,…,n) environment, μ i is the mean of ith variety over all environments, β i is the regression coefficient that measures the response of ith variety to varying environments, δ ij the deviation from regression of the of ith variety in the jth environment and I j is the environmental index of the jth environment. The environmental index, I j, for jth environment is calculated as
 $$\left[ {\left( {\sum\limits_i {Y_{ij} /v}} \right) - \left( {\sum\limits_i {\sum\limits_j {Y_{ij} /vn}}} \right)} \right],\quad \sum\limits_j {I_j} = 0$$
Various sums of squares (SSs) are calculated as
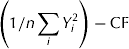
(i) Genotypes SS
where $$\left( {1/n\sum\limits_i {Y_i^2}} \right) - {\rm CF}$$$\sum\limits_i {Y_i^2} $ is obtained by squaring totals of each genotype over environment and adding all the squared values and CF is the correction factor.
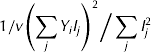
(ii) Environment (linear) SS:
This value is obtained from pooled analysis. Environment SS of pooled analysis is the environment (linear) SS of the stability analysis. It is calculated as
$$1/v\left( {\sum\limits_j {Y_i I_j}} \right)^2 \Big/\sum\limits_j {I_j^2} $$(iii) G × E (linear) SS:
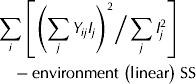
$$\eqalign{\tab\sum\limits_i {\left[ {\left( {\sum\limits_j {Y_{ij} I_j}} \right)^2 \Big/\sum\limits_j {I_j^2}} \right]} \cr\tab\quad- {\rm environment\ }\left( {{\rm linear}} \right)\;{\rm SS}$$(iv) SS for pooled deviations is obtained thus
Pooled deviation SS is made up of v components each with (n − 2) degrees of freedom. For ith genotype Σδ 2ij is calculated as$$\sum\limits_i {\sum\limits_j {\delta _{ij}^2}} $$The pooled deviations mean square (M 3) is tested against the pooled error mean square (M 4). Thus F test is$$\left( {\sum\limits_j {Y_{ij}^2} - Y_i^2 /n} \right) - \left( {\sum\limits_j {Y_{ij} I_j}} \right)^2 \Big/ {\sum\limits_j {I_j^2}} $$When the mean square for pooled deviations is significant but mean square for G × E (linear) is non-significant, variation in the performance of genotypes is entirely unpredictable. However, significance of mean square for pooled deviations, when the mean square for G × E (linear) is also significant, implies that part of the variability is unpredictable in nature.$$M_{\rm 3} /M_{\rm 4} $$




Stability parameters
Eberhart & Russell (Reference Eberhart and Russell1966) proposed a model to test a stability of varieties under various environments. They defined a stable variety as having unit regression over the environment (b i = 1) and minimum deviation from the regression (S2 d i = 0).
The estimate of stability factor b i is obtained for ith variety as follows:
 $$b_i = \displaystyle{{\sum\limits_j \sum Y_{ij} I_j} \over {\sum {I_j^2}}} $$
where Y ij is the mean performance of the ith variety (i = 1,2,3,…,v) in the jth (j = 1,2,…,n) environment, and I j is the environmental index of the jth environment.
Another stability parameter is the squared deviations from this regression. Estimate of this stability parameter (S 2di) is obtained thus
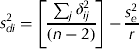 $$s_{di} ^2 = \left[ {\displaystyle{{\sum\nolimits_j {\delta _{ij}^2}} \over {(n - 2)}}} \right] - \displaystyle{{s_e^2} \over r}$$
δ ij is the derivation of ith variety in the jth environment from regression and is obtained by
 $$\delta _{ij} = y_{ij} - \hat y_{ij} $$
where  $ \hat y_{ij} $ is the expected value of ith variety in jth environment, predicted as
 $\bar x_i + b_i I_j $. The estimate of pooled error mean square is
 $S_e^2 /r$.
In practice  $\sum\limits_j {\delta _{ij}^2} $ is calculated as
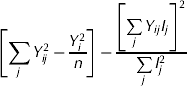 $$\left[ {\sum\limits_j {Y_{ij}^2 - \displaystyle{{Y_i^2} \over n}}} \right] - \displaystyle{{\left[ {\sum\limits_j {Y_{ij} I_j}} \right]^2} \over {\sum\limits_j {I_j^2}}} $$
This approach to the measurement of phenotypic stability is based on regression analysis. In the regression analysis, variation of dependent variable (y) can be partitioned into two components due to its regression on independent variable (x) and deviation from regression or residual variation. The former could be expressed as  $b\sum {(x - \bar x)} (y - \bar y)$, the latter as
 $\sum {(y - \bar y)} ^2 - b\sum {(x - \bar x)} (y - \bar y)$. In the present context, the regression component could be expressed as
 $$\sum\limits_j {Y_{ij} I_j \big/\sum\limits_j {I_j^2}} \times \sum\limits_j {Y_{ij}} I_j = \left( {\sum\limits_j {Y_{ij} I_j}} \right)^2 \Big/\sum\limits_j {I_j^2} $$
Therefore, the residual variation for ith variety  $\left( {\sum\limits_j {\delta _{ij}^2}} \right)$ is obtained as shown above.
The current model, therefore, provides a means of partitioning the G × E interaction of each variety into two parts:
I Variation due to the response of a variety to varying environmental indices (SSs due to regression) and
II Deviation from regression on environmental index.
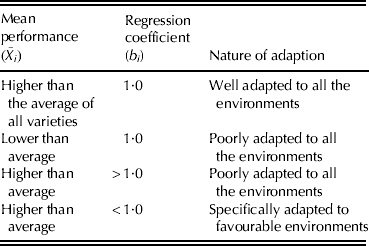
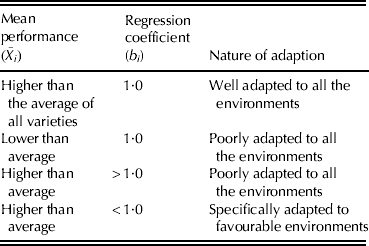
A generalized interpretation of varietal adaptation (Finlay & Wilkinson Reference Finlay and Wilkinson1963) is given in Table 1.
A generalized interpretation of varietal adaptation (Finlay & Wilkinson Reference Finlay and Wilkinson1963)
RESULTS
Soil moisture
Variability in soil moisture under each of the four water regimes during 2007 and 2008 was evident (Fig. 1). The soil moisture was maintained almost at field capacity in no-stress treatments during both years. Withholding of irrigation during different stages resulted in the reduction of soil moisture below the wilting point of 150 g water/kg soil. Soil moisture was reduced to 105 and 126 g water/kg soil in 2007 and 2008, respectively, when imposed during GS1, to 112 and 115 g water/kg soil in 2007 and 2008, respectively, when imposed during GS2 and to 102 and 105 g water/kg soil in 2007 and 2008, respectively, when imposed during GS3.
Mean performance
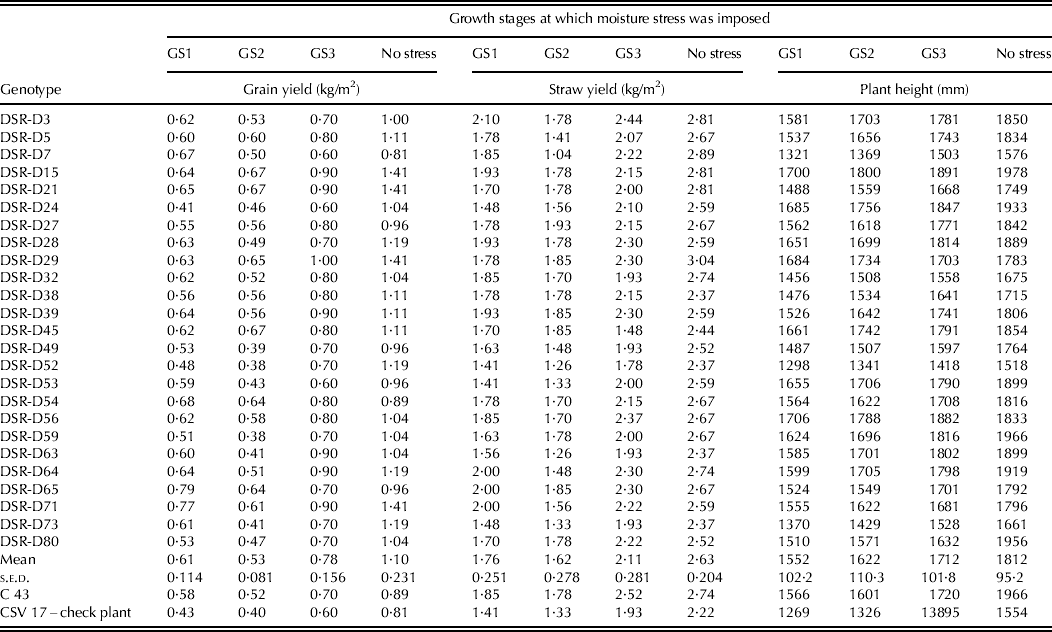
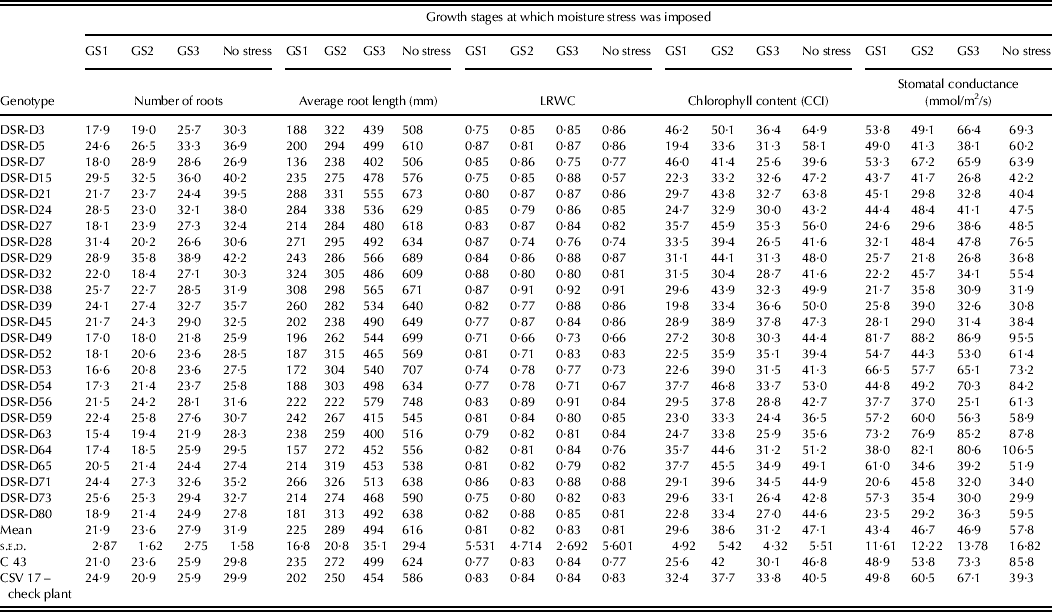
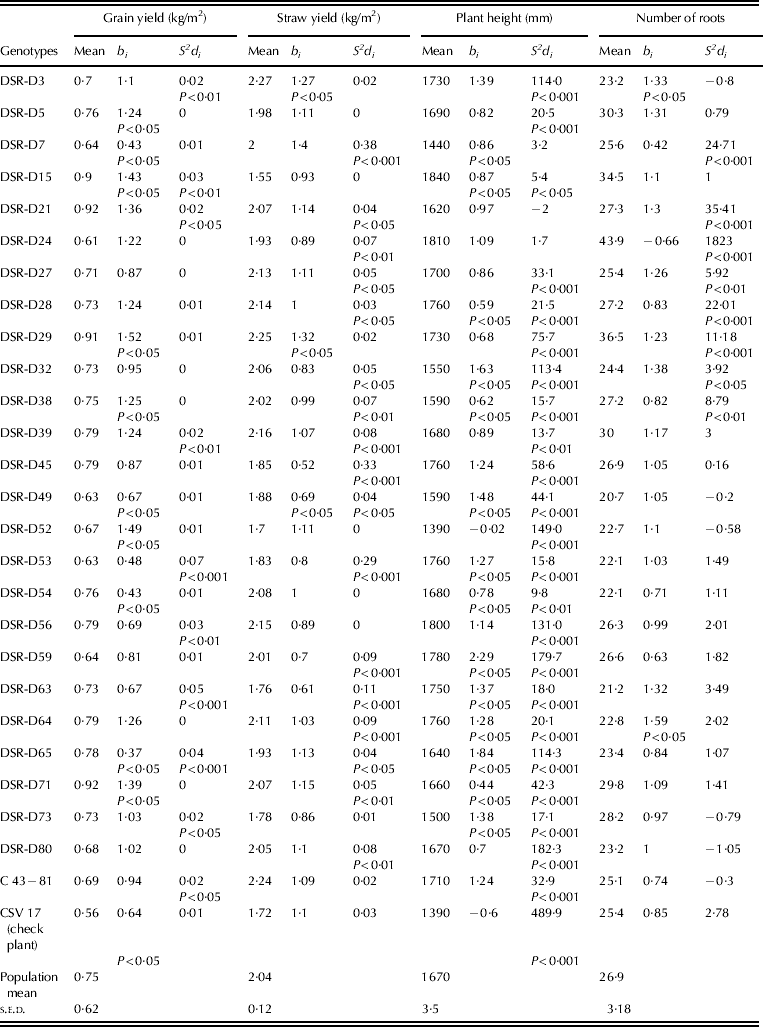
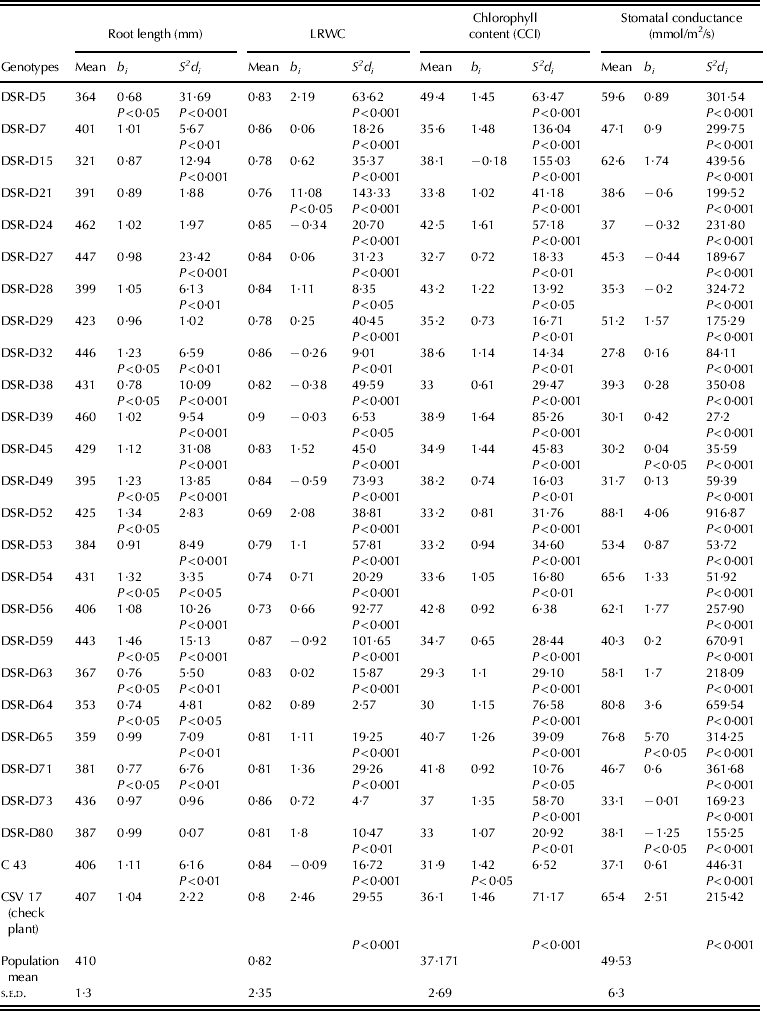
Means of the derivatives across 2 years under moisture stress imposed during GS1, GS2, GS3 and control (no stress) are presented in Tables 2a and 2b.
Performance of sorghum derivatives for grain and straw yields and plant height over 2 years

Performance of sorghum derivatives for morphological and drought resistant traits over 2 years
Grain yield
The grain yield varied from 0·41 to 0·79 kg/m2 when stress was imposed during GS1, 0·38 to 0·67 kg/m2 when stress was imposed during GS2, 0·59 to 0·95 kg/m2 when stress was imposed during GS3 and 0·81 to 1·41 kg/m2 under non-stressed conditions.
Straw yield
Straw yield varied between the stress and no stress treatments, from 1·04 to 3·04 kg/m2. The variations within each growth stage were as follows: stress imposed during GS1 1·41–2·10; GS2 1·04–1·93; GS3 1·48–2·52; no stress 2·22–3·04 kg/m2.
Plant height
The height of the drought-tolerant check plants ranged from 1520 to 1978 mm. Plant height was reduced to a population mean of 1549 mm with imposition of water stress during GS1, 1618 mm at GS2 and 1709 mm at GS3.
Number of roots
Number of roots/plant in the check plants ranged from 25·8 to 42·2 but reduced under stress during GS1 (15·4–31·4); GS2 (18·0–35·8); and slightly reduced under stress in GS3 (21·8–38·9).
Average root length
Population mean was 232, 292 and 496 mm when stress was imposed during GS1, GS2 and GS3 respectively. It was 618 mm in the check plants.
LRWC
The LRWC ranged from 0·75 to 0·88 when stress was imposed during GS1, 0·71–0·91 when stress was imposed during GS2, 0·71–0·92 when stress was imposed during GS3 and 0·57–0·91 under no-stress conditions (control).
Chlorophyll content
Chlorophyll content (CCI) varied under the different treatments, ranging from 19·4 to 46·2, 30·4 to 50·1, 24·4 to 37·8 and 35·6 to 64·9 when stress was imposed during GS1, GS2, GS3 and in the control treatment, respectively.
Stomatal conductance
Stomatal conductance varied from 29·9 to 106·5 under no-stress conditions, 20·6 to 81·7 under moisture stress during GS1, 21·8 to 88·2 under stress imposed during GS2 and 25·1 to 86·9 mmol/m2/s under moisture stress during GS3.
Correlations and PLS analysis
Grain yield
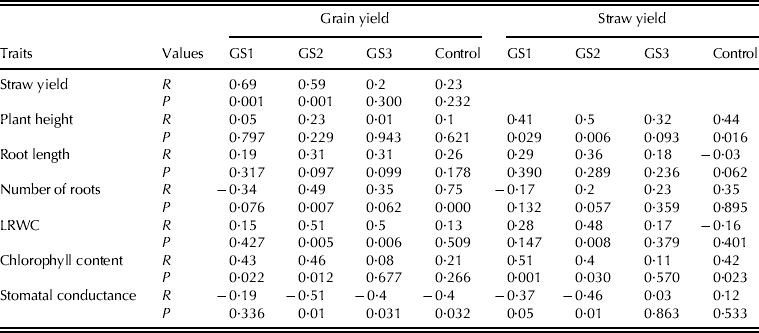
Grain yield was strongly correlated (r = 0·43, P < 0·05) with CCI under stress during GS1 (Table 3). Under stress during GS2, it was positively correlated to number of roots (r=0·49, P ⩽ 0·01), LRWC (r = 0·51, P ⩽ 0·01) and chlorophyll content (r = 0·46, P ⩽ 0·01), and negatively correlated to stomatal conductance; however when stress was imposed during GS3, it was only positively correlated (r = 0·50, P ⩽ 0·01) to LRWC and had a negative correlation (r = − 0·4, P < 0·05) with stomatal conductance.
Correlation coefficient of grain yield with other morpho-physiological traits in sorghum
Straw yield
Correlations of straw yield with plant height (r = 0·41, P < 0·05), and chlorophyll content (r = 0·51, P ⩽ 0·001), were positive and significant when stress was imposed during GS1 and significantly negative with stomatal conductance (r = −0·37, P ⩽ 0·05); when stress was imposed during GS2, plant height (r = 0·5, P ⩽ 0·01), LRWC (r = 0·48, P ⩽ 0·01), chlorophyll content (r = 0·4, P < 0·05) and stomatal conductance (r = −0·46, P ⩽ 0·01) were significantly correlated with straw yield.
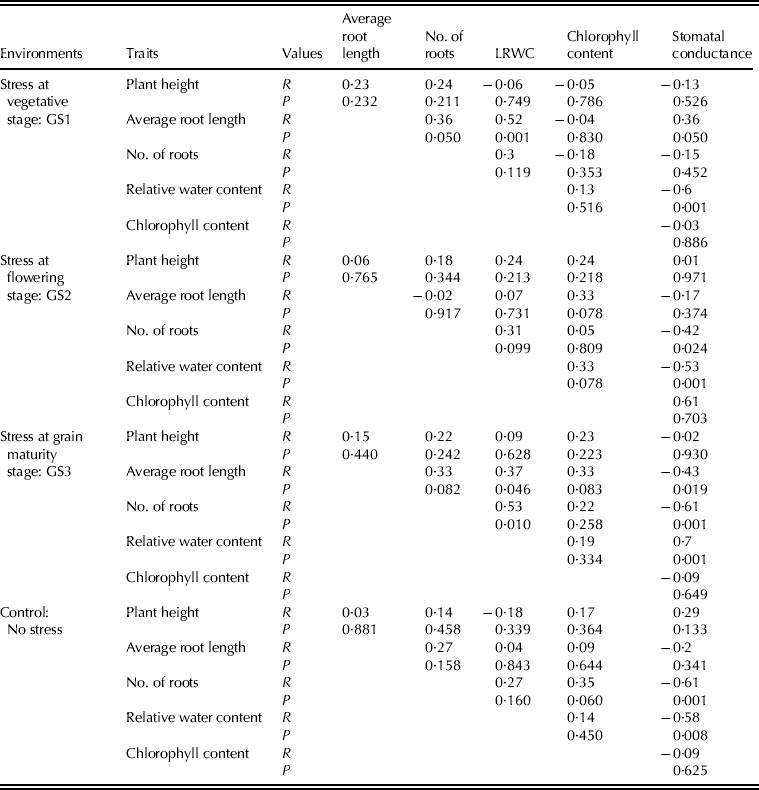
Root length was correlated to number of roots when stress was imposed during GS1, and to LRWC and stomatal conductance when stress was imposed during GS1 and GS3 (Table 4). Chlorophyll content was not correlated to any other trait in the present study in any growth stage or the control (well-watered conditions). However, stomatal conductance was correlated to many of the traits in all stresses.
Correlation coefficient between morphological and physiological traits in sorghum
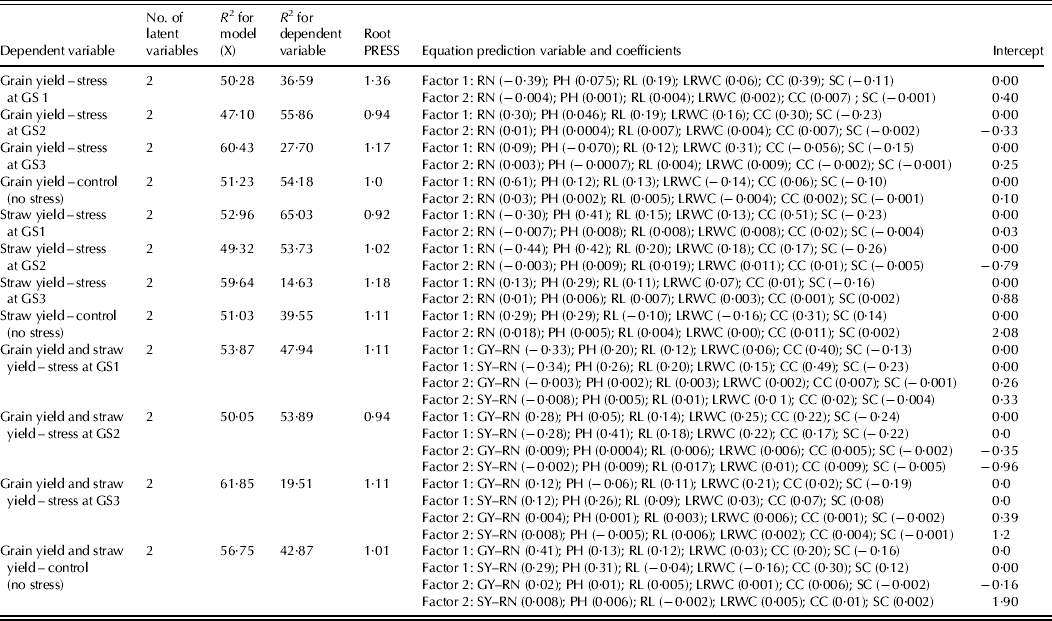
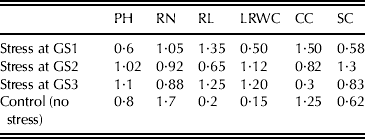
Since simple correlation studies showed that the independent variables were correlated in the present study, PLS analysis was carried out to understand the importance of each independent variable. PLS regression is typically used when the independent variables are correlated, or the number of independent variables exceeds the number of observations. It differs from standard multiple linear regression because it accounts for the variation of both response and predictor variables (Jurs Reference Jurs, Lipkowitz and Boyd1990). The PLS regression matrix is presented in Table 5. For each environment, three regression models were tried: (i) grain yield as dependent variable, (ii) straw yield as dependent variable and (iii) grain and straw yields as dependent variables. The R 2 for X (the independent variable) were similar across environments and models, ranging from 0·47 to 0·60. For Y, the dependent variable, it ranged from 0·15 to 0·65 and was low for environment 3 (0·15–0·28) in all three models. VIP is presented in Table 6. Different traits were important for grain yield under stress at different growth stages. Root number under stress at all the three growth stages, chlorophyll content under stress at GS1 and GS2, and LRWC and stomatal conductance under stress at GS2 and GS3 were important for explaining the variability in grain yield.
PLS regression matrix
PRESS, prediction residual error sum of squares; GY, grain yield; SY, straw yield; GS1, growth stage 1; GS2, growth stage 2; GS3, growth stage 3; RN, root number; PH, plant height; RL, root length; LRWC, leaf relative water content; CC, chlorophyll content; SC, stomatal conductance.
Variable importance for projecting scores of the predictor, grain yield
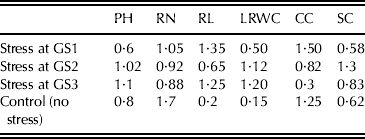
PH, plant height; RN, root number; RL, root length; LRWC, leaf relative water content; CC, chlorophyll content; SC, stomatal conductance.
Stability analysis
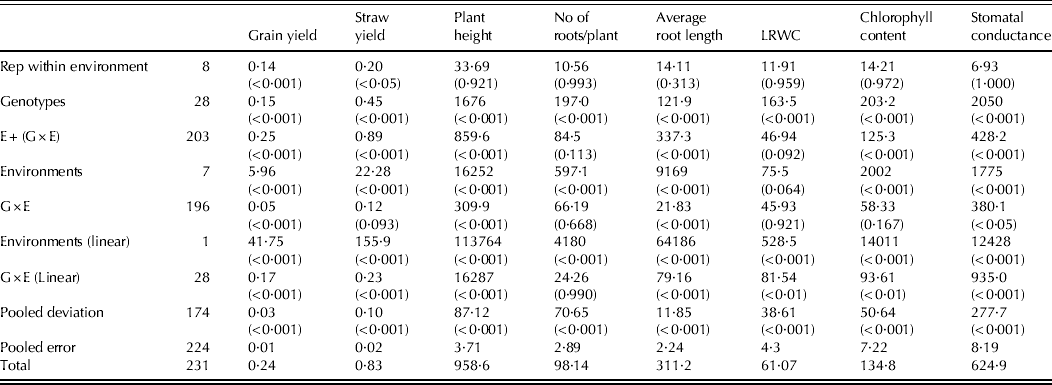
Analysis of variance showed that there was genotypic difference for all the traits studied, viz. grain yield, plant height, root length, stomatal conductance, straw yield, chlorophyll content, number of roots and LRWC (Table 7). Mean squares arising due to G × E were significant for the traits of grain yield, plant height, average root length and stomatal conductance. Component analysis of environment + (G × E) were significant for all the traits except for number of roots/plant and LRWC. Mean squares due to environments were significant for all the traits except for LRWC. However, mean squares for environment linear were significant for all the traits. Significant mean SSs due to G × E (linear) were recorded for all the characters except for number of roots per plant. Mean squares due to pooled deviations were significant for all the traits.
Stability analysis of grain yield and other traits over years and environments (P values in parentheses)
Stability parameters
Tables 8a and 8b represent stability parameters of the sorghum derivatives. Eberhart & Russell (Reference Eberhart and Russell1966) proposed a model to test the stability of varieties under various environments, and defined a stable variety as having unit regression over the environments (b i = 1) and minimum deviation from the regression (S2d i = 0).
Stability parameters for grain and straw yields and morphological traits over four environments
Stability parameters for grain and straw yield and morpho-physiological traits over four environments
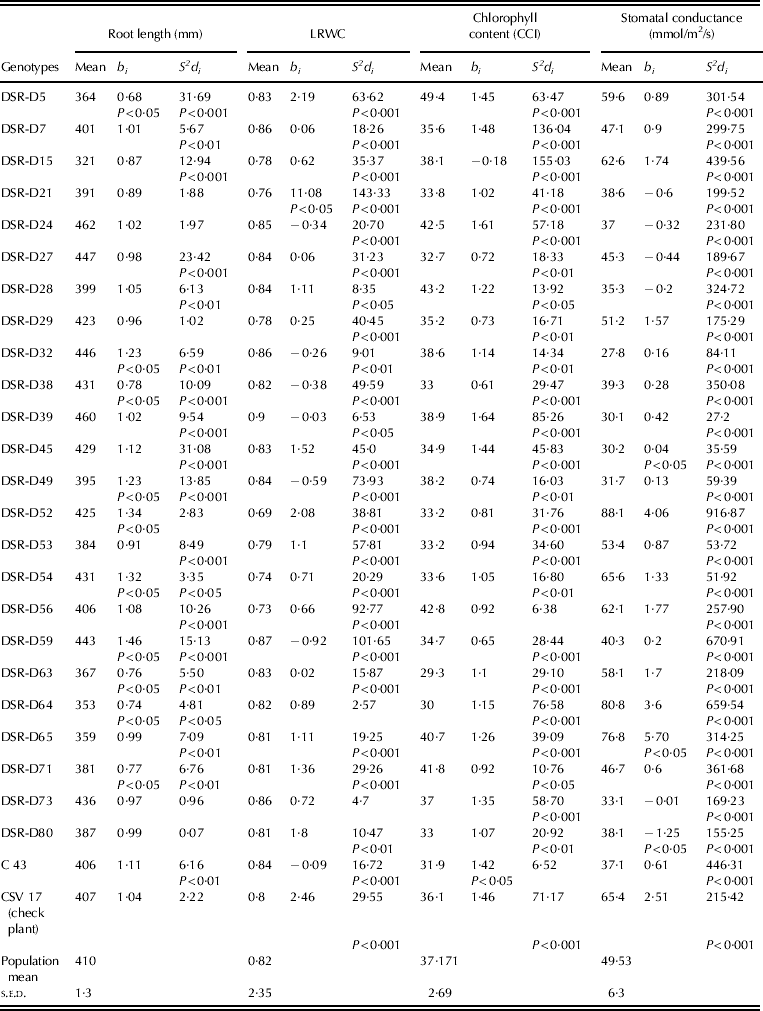
In the present study, the derivatives showing high-to-moderate mean performance compared with the population mean for grain yield, b i (regression over the environment) nearing one and S2d i (deviation from the regression) nearing zero were DSR-D32, DSR-D73 and DSR-D3. The derivatives showing high-to-moderate mean performance compared with the population mean, b i more than one and S2d i nearing zero were DSR-D5, DSR-D15, DSR-D21, DSR-D28, DSR-D29, DSR-D38, DSR-D39, DSR-D64 and DSR-D71. However, derivatives DSR-D45, DSR-D54, DSR-D56 and DSR-D65 showed high-to-moderate mean performance compared with the population mean, b i less than one and S2d i nearing zero. Similarly, derivatives showing straw yield superior to the population mean, b i nearing one and S2d i nearing zero were DSR-D27, DSR-D28, DSR-D38, DSR-D39, DSR-D54, DSR-D56, DSR-D64, DSR-D65, DSR-D80 and C43.
DISCUSSION
The performances of genotypes varied over all the eight environments with respect to grain yield. In the present study, the stress was more damaging when imposed during GS1 and GS2 than during GS3. The percentage decrease in grain yield (53·3%) was more conspicuous due to stress during GS2 as compared with stress imposed during GS1 (46·6%) and GS3 (33·3%). In the present study, the period between the end of GS1 and beginning of GS2 was the stage where the floral initiation of sorghum took place (30–40 days after germination) and the panicle was formed. Yield losses in sorghum can be caused by drought at the early vegetative seedling stage, during the period of panicle development prior to flowering or during the post-flowering stage of grain development (Tuinstra et al. Reference Tuinstra, Grote, Goldsbrough and Ejeta1997). Those authors also reported that drought at GS2 causes delayed flowering, poor panicle emergence, floret abortion and panicle blasting, resulting in poor yields. Sankarapandian et al. (Reference Sankarapandian, Krishnadoss, Muppidathi and Chidambaram1993) reported that grain yield was severely affected by stress at maturity and in the flowering phase and least affected in the vegetative phase. This finding conflicts with the results of the present study, but the differences may be due to genotypic differences between the two studies and/or different types and levels of drought stress.
Stress at various growth stages affected grain and straw yield. However, the population means of physiological traits over environments, in general, did not show variation. Some genotypes adapt to environmental change by alteration of physiological traits such as LRWC, chlorophyll content and stomatal conductance and these may not have been reflected in population means of the traits. Changes in the external environment affect stomatal functions, which in turn influence rates of transpiration and carbon dioxide (CO2) fixation (Wenkert Reference Wenkert, Taylor, Jordan and Sinclair1983). Population mean values over years for stress at different growth stages increased from GS1 to GS2 and decreased from GS2 to GS3 for chlorophyll content measured as CCI. This could be due to senescence of the leaves because of drought during GS3.
The R 2 for Y, the dependent variable, from PLS analysis was quite high for all the models at all the growth stages except at growth stage GS3. There is a need for further study to identify some more independent variables which influence grain straw yield under stress at GS3. Studies from simple correlations and PLS analysis generally showed that grain yield under stress during different growth stages was associated with different physiological traits. Chlorophyll content measured as CCI was strongly correlated with grain yield under stress during GS1 and GS2; however, LRWC and lower stomatal conductance were important for grain yield under stress during GS2 and GS3. González et al. (Reference González, Bermejo and Gimeno2010) found that the variable, most sensitive to water deficit, was stomatal conductance in barley. Also, in the present study, grain yield was strongly correlated to number of roots/plant under stress at GS2 and control conditions. Greater numbers of roots give increased accessibility to moisture and nutrients (Patil & Biradar Reference Patil and Biradar2005); it has been found that drought-tolerant lines show the highest root length and weight (Mutisya et al. Reference Mutisya, Sitieney and Gichuki2010). The root traits (root length, root dry weight and root number) play important roles in overcoming moisture stress in sorghum (Maiti Reference Maiti and Maiti1996). In contrast, Blum (Reference Blum2005) found that even when total root mass is reduced, there may still be an increase in root length and depth in a drying soil.
Important physiological traits correlated to straw yield were chlorophyll content measured as CCI and lower stomatal conductance under drought stress treatments imposed during GS1 and GS2. Also, straw yield was correlated to LRWC in GS2. Lower stomatal conductance has been shown to result in higher TE and greater accumulation of biomass in crops (Xin et al. Reference Xin, Aiken and Burke2009). Mutisya et al. (Reference Mutisya, Sitieney and Gichuki2010) reported that high RWC was correlated to drought tolerance in sorghum. Water deficit stress that determines the grain yield is known to alter many physiological processes such as leaf temperature, stomatal conductance, transpiration, photosynthesis and respiration (Mutisya et al. Reference Mutisya, Sitieney and Gichuki2010).
All the physiological traits examined in the present study were correlated to each other in one or two growth stages when stress was imposed during growth stages (Table 4). Signals affecting stomatal conductance can originate from the root system (Davies & Zhang Reference Davies and Zhang1991); number of roots was correlated to stomatal conductance in the present study.
The F4 and F5 derivatives studied were significantly different for grain yield, straw yield, plant height, average root length, number of roots/plant, LRWC, chlorophyll content and stomatal conductance (Table 7). The traits grain yield, plant height, average root length and stomatal conductance (significant mean SSs for G × E) had significant differential responses to the changing environments. The canopy development pattern (root length and depth, leaf morphology and stomatal control) adjusts to soil moisture availability by developmental plasticity (Subbarao et al. Reference Subbarao, Johansen, Slinkard, Nageswara Rao, Saxena and Chauhan1995). On partitioning the G × E interaction into linear and non-linear components, both were found to be significant, indicating their importance in the inheritance of the traits. However, the magnitude of the linear component was larger than that of the non-linear, suggesting the feasibility of production of stable sorghum genotypes for grain yield, plant height, average root length and stomatal conductance across the environments.
Significant mean SSs due to G × E (linear) were recorded for the characters straw yield, LRWC and chlorophyll content, indicating that the behaviour of genotypes for the traits is partly governed by genetics and partly influenced by environment. Mohammadi et al. (Reference Mohammadi, Amri, Haghparast, Sadeghzadeh, Armion and Ahmadi2009) reported that the grain yield in wheat was influenced by environment with 0·85 of the total SS accounted for by environment.
It is important to have yield stability of a genotype across a range of production environments (Mutava et al. Reference Mutava, Prasad, Tuinstra, Kofoid and Yu2011). As discussed earlier, significant G × E interaction for grain yield indicates that a stable genotype can be identified in response to stress at all stages, i.e. GS1, GS2 and GS3. The lines DSR-D32, DSR-D73 and DSR-D3 were most stable over all the three stress environments and under controlled conditions (Table 8). Rosenow et al. (Reference Rosenow, Ejeta, Clark, Gilbert, Henzell, Borrell and Muchow1997) reported that the sorghum genotypes SC23-14, SC701-14 and P 954 035 showed resistance to drought at both pre-flowering and post-flowering stages.
In conclusion, grain yield and stomatal conductance showed differential responses to water stress imposed during different growth stages, indicating that stable genotypes can be developed. The important traits associated with high grain yield under stress at different growth stages were stomatal conductance, chlorophyll content and LRWC. In turn, stomatal conductance was correlated with other traits such as average root length, number of roots and LRWC. Different physiological traits were associated with grain yield under stress at various growth stages. Hence, population breeding or marker-assisted selection will be fruitful; however, population breeding is time consuming. Identifying the markers for physiological traits associated with tolerance and pyramiding them in elite genotypes will help in developing drought-tolerant genotypes across stresses at different stages of plant growth.
We are thankful to Dr A. Dandapani, Principal Scientist (ICM Division), National Academy of Agricultural Research Management, Hyderabad, India, for helping us in carrying out PLS analysis.