I. INTRODUCTION
Bi2Te3-based materials are known as the best thermoelectric materials for applications around room temperature, typically reaching a thermoelectric figure of merit, ZT, close to 1. Thermoelectric generators based on these compounds can potentially be used for energy harvesting applications, for example, as independent powers sources for sensor networks or in consumer electronics. To integrate the material into microscale devices, it is necessary to use synthesis methods that are compatible with microfabrication processes.
Various synthesis methods can be used in the fabrication of microscale thermoelectric devices, including electrochemical deposition (ECD).Reference Glatz, Schwyter, Durrer and Hierold1 However, the thermoelectric properties of electrochemically deposited Bi2Te3 are typically low when compared with state-of-the-art bulk materials. This can partly be attributed to the high sensitivity of the material properties to small changes in the composition, a parameter that, in electrochemical processes, is difficult to control with the necessary precision.Reference Michel, Diliberto, Boulanger, Stein and Lecuire2 Additionally, the carrier density in electrodeposited materials is typically significantly higher than predicted by the commonly applied antistructure model, even if the desired composition is achieved.Reference Tittes, Bund, Plieth, Bentien, Paschen, Plotner, Grafe and Fischer3
Postdeposition annealing in oxygen-free environments has been investigated as a means of reducing the defect density in the material and can lead to an improvement in the thermoelectric properties.Reference Jun, Lee and Oh4 However, because of the high partial pressure of tellurium and its associated preferred evaporation at elevated temperatures, this treatment is again very sensitive to the initial composition.Reference Kim, Oh and Kim5
One possible method to avoid the dependence of the annealing results on the starting composition of the material is the use of an equilibrium annealing process. The process is based on creating a solid–vapor equilibrium between the sample and the tellurium vapor supplied by an independent source in an enclosed system.Reference Brebrick and Scanlon6, Reference Brebrick7 This method has already been successfully applied to thermally evaporated thin film samples and led to a significant reduction of the carrier concentration and the associated improvement of the Seebeck coefficient.Reference Taylor, Mortensen, Rostek, Nguyen and Johnson8 However, the effect of vapor annealing has not yet been studied for electrochemically deposited materials.
In this article, we investigate the effect of this vapor annealing process on the thermoelectric properties of galvanostatically deposited Bi2Te3 films. We show that the composition of the final material can be controlled through the annealing and is, within certain limits, independent of the initial composition. The annealed material also shows an improvement of more than a factor of two in the Seebeck coefficient.
II. EXPERIMENTAL
Electrolyte solutions were prepared by first dissolving TeO2 (99.995%; Sigma Aldrich, Munich, Germany) and Bi(NO3)3·5H2O (99.99%; Sigma Aldrich) in concentrated HNO3 (69%; Sigma Aldrich). The resulting solution was diluted with water to achieve a pH value of 0, corresponding to ∼1 M HNO3. The tellurium concentration was fixed at 20 mM for all electrolytes, while the bismuth content was varied, with values of 13.3, 20, and 30 mM, to achieve Bi:Te cation ratios of 2:3, 1:1, and 3:2, respectively.
The deposition was carried out on Si/SiO2 substrates, coated with a 20-nm titanium layer (to improve adhesion) and a 100-nm platinum seed layer. All samples were cleaned successively in acetone, isopropyl alcohol, and deionized water ultrasonic baths, followed by an electrochemical cleaning step in a 3% Extran AP-13 solution.
During deposition, the substrate was held vertically in a custom-made Teflon holder, which exposed 1.69 cm2 of the sample surface. The electrolyte solution (600 ml) was not stirred during deposition, and a platinized titanium mesh was used as an anode. The films were galvanostatically grown at room temperature, using a Keithley 2601A System Sourcemeter (Kiethley Instruments, Cleveland, OH) as the current source. Current densities were varied between 1 and 10 mA/cm2. Required deposition times were calculated for a desired sample thickness of 10 μm using Faraday’s law and assuming a current yield of 100%, as well as the reported half reaction for reduction of HTeO2+ and Bi3+ to Bi2Te3Reference Martin-Gonzalez, Prieto, Gronsky, Sands and Stacy9:

The composition of the deposited layers was analyzed by energy-dispersive x-ray analysis (EDX; Oxford INCA 300, Oxford Instruments, Oxfordshire, UK). A minimum of three measurements, at different locations on the deposited film, were conducted for each sample. To minimize the influence of local compositional variations, each of these spectra covered an area of ∼0.3 mm2. The individual results of these measurements were averaged, with calculated standard deviations smaller than 0.5 at.% for all samples.
Annealing experiments were performed in an evacuated glass ampoule with an initial pressure of <5 × 10⁻⁵ mbar. The ampoule consisted of two parts, which were connected by ground glass fittings (leaky ampoule) and contained the samples and a ceramic boat with powdered tellurium as source material (99.999%; Sigma Aldrich). The annealing temperature for all experiments was fixed at 250 °C, while the duration was varied.
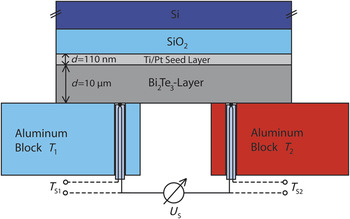
Seebeck coefficients were measured around room temperature on a self-built apparatus, which is shown schematically in Fig. 1. A temperature gradient is created across the sample by placing it on two aluminum blocks that have different temperatures T 1 and T 2. The deposited film is contacted by two spring-loaded thermocouples (type T) embedded in these blocks. Using a Keithley multimeter and switch card (Kiethley Instruments, Cleveland, OH), both the temperatures at the thermocouple junctions (T S1 and T S2) and the resulting Seebeck voltage (U S, using the copper lines of the thermocouples) are measured. The Seebeck coefficient of the sample/copper combination is then calculated as U S/(T 2−T 1) and corrected for the known influence of the copper lines. The temperature difference across the sample is typically around 5 to 8 K. As the measurement is automated, the reported values show the average of some hundred individual data points taken on three to five different positions of the samples, with standard deviations of less than 5 μV/K at typical average values between −50 and −150 μV/K.
Schematic of the setup used for measuring the Seebeck coefficient.

The Seebeck measurements were conducted with the seed layer still intact underneath the deposited film and therefore represent a mixed value of the electrochemically deposited material and the Ti/Pt film. According to the model reported in Ref. Reference Nurnus, Böttner, Beyer and Lambrecht10, an approximate value for the transport properties of a two-layer system can be calculated from:

where α i, σ i, and d i are the Seebeck coefficient, electrical conductivity, and thickness of the individual layers. This equation shows that the Seebeck coefficient measured for a two-layer system will always be smaller than the highest value of any single layer. As the measured Seebeck values for the Ti/Pt layer are small (between −5 and −8 μV/K), all values reported in this article can be considered to represent the lower limit (with respect to the absolute value) for the deposited films.
III. RESULTS AND DISCUSSION
A. Electrolyte characterization
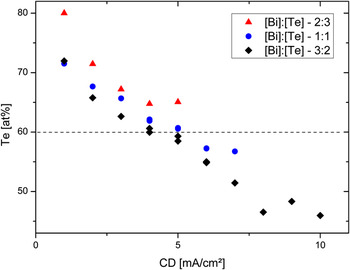
The first goal of this study was to find an electrolyte composition that allowed the repeatable galvanostatic deposition of stoichiometric Bi2Te3. In addition, the synthesis of both tellurium-rich and tellurium-deficient materials should be possible by adjusting the current density. On the basis of Ref. Reference Michel, Diliberto, Boulanger, Stein and Lecuire2, we chose an electrolyte with a Bi to Te ratio of 1:1 and a Te concentration of 20 mM as the starting point for the investigation. Additionally, electrolytes with a higher ratio of Bi to Te (3:2) and a lower ratio (2:3) were prepared. Depositions were carried out starting at a current density of 1 mA/cm2 for all electrolytes. The current density was then increased with a step size of 1 mA/cm2 for each successive sample until the onset of hydrogen evolution was observed. This limiting current density resulted in black and powdery samples with bad adhesion to the substrate. Figure 2 shows the measured Te content as a function of the deposition-current density for the different electrolyte compositions. Three major trends can be observed:
(i) Higher current density leads to lower Te content in the film.
(ii) Higher Bi content in the electrolyte leads to higher Bi content in the film.
(iii) Higher total ion concentration in the electrolyte allows higher deposition-current densities.
Te content as a function of deposition-current density for different electrolyte compositions.

All of the above results are consistent with the results from previous studies.Reference Michel, Diliberto, Boulanger, Stein and Lecuire2, Reference Tittes, Bund, Plieth, Bentien, Paschen, Plotner, Grafe and Fischer3
The electrolyte with the lowest Bi:Te (2:3) ratio does not allow the deposition of Bi2Te3 (dashed line in Fig. 2), as only samples with a Te content of more than 60 at.% could be achieved. It is therefore not suitable for this study. The other two electrolytes can both be used for the deposition of samples with a range of compositions around the correct stoichiometry, but the Bi-rich electrolyte covers a wider range and was therefore chosen for further experiments.
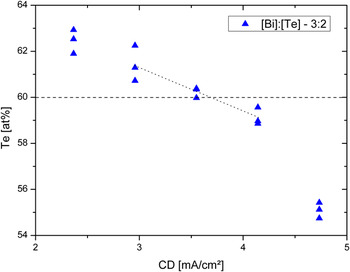
To identify the optimum current density for stoichiometric material, we deposited a second series of samples with five different current densities between 2.4 and 4.7 mA/cm2. The repeatability of the process was tested by depositing three individual samples for each current density. Figure 3 shows the dependence of the Te content on the current density. On the basis of these results, stoichiometric material can be expected at deposition-current densities approximately between 3.5 and 4 mA/cm2, whereas a lower Te content can be achieved at higher current densities and vice versa. A steep increase in the Bi content is observed for higher current densities and is consistent with the results shown in Ref. Reference Tittes, Bund, Plieth, Bentien, Paschen, Plotner, Grafe and Fischer3. The variation in composition for samples deposited under formally identical conditions is smaller than ±1 at.%.
Te content as a function of deposition-current density for an electrolyte with a Bi:Te ratio of 3:2.

B. Seebeck coefficient
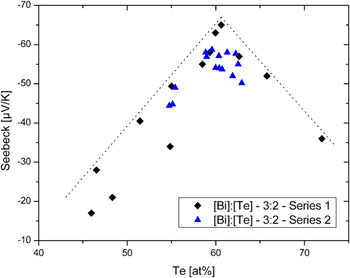
Figure 4 shows the measured Seebeck coefficient of the deposited samples (including the Ti/Pt seed layer) as a function of the composition. The Seebeck coefficient is negative for all samples, regardless of the composition, but it is generally larger for materials which are closer to stoichiometry. Typically, the magnitude of the Seebeck coefficient reported for electrochemically deposited materials is between −50 and −100 μV/K,Reference Li, Toprak, Soliman, Zhou, Muhammed, Platzek and Müller11, Reference Xiao, Hangarter, Yoo, Rheem, Lee and Myung12 which is consistent with the results of this article. The achieved values of approximately −60 μV/K are still significantly lower than the desired value of approximately −200 μV/K reached in state-of-the-art bulk materials.
Seebeck coefficient as a function of Te content for two series of samples deposited from similar electrolytes.

On the basis of the commonly assumed antistructure model for Bi2Te3,Reference Brebrick7 materials with a Te content of less than 60 at.% should be p-type. However, most reports have found electrochemically deposited materials to be n-type regardless of the composition.Reference Heo, Hagiwara, Ichino and Okido13 This indicates the existence of a second, dominant doping mechanism in this type of material, which we believe to be related to structural defects introduced by the growth process.
According to Refs. Reference Tittes, Bund, Plieth, Bentien, Paschen, Plotner, Grafe and Fischer3 and Reference Magri, Boulanger and Lecuire14, the carrier concentration for electrodeposited, near-stoichiometric materials is on the order of 3 × 10²⁰ L/cm3 and further increases for both tellurium-rich and tellurium-deficient materials. This behavior is mirrored in the measured distribution of the Seebeck coefficients. Samples with a large excess of either bismuth or tellurium exhibit a smaller value, indicating a higher number of charge carriers. To achieve a high thermoelectric figure of merit in Bi2Te3, it is, however, necessary to significantly reduce the number of carriers. Excellent properties have been found for materials with doping levels of ∼3–6 × 10¹⁹ L/cm3.Reference Fleurial, Gailliard, Triboulet, Scherrer and Scherrer15
C. Annealing process
One way to lower the carrier concentration in Bi2Te3 is a postdeposition annealing process aimed at reducing the structural defect density of the material. Although good results have been achieved by annealing electrodeposited samples in a H2 atmosphere,Reference Jun, Lee and Oh4, Reference Kim, Oh and Kim5 the process is highly dependent on the initial composition of the material because of the preferred evaporation of tellurium at elevated temperatures.Reference Brebrick7 This difficulty can be avoided by employing an equilibrium annealing process in an enclosed tellurium vapor atmosphere. If the applied temperature and duration for the annealing is sufficient to reach equilibrium, the composition of the treated samples will be fixed. The achieved composition should correspond to Bi2Te3 saturated with the maximum amount of tellurium. On the basis of previous results for evaporated Bi2Te3 thin films, a significant reduction in carrier concentration as well as an improved Seebeck coefficient can be achieved through this process.Reference Taylor, Mortensen, Rostek, Nguyen and Johnson8
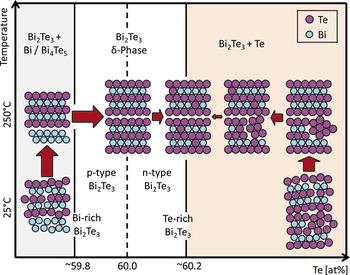
The proposed changes in the composition and structure of the material along the phase diagram are schematically shown in Fig. 5 for the annealing treatment under Te atmosphere. The locations of the Bi2Te3 phase boundaries are only an approximation, as precise measurements, to the best of our knowledge, have only been reported for high-temperature synthesis of the material.Reference Brebrick7 The complete phase diagram can be found in Ref. Reference Massalski16.
Section of the Bi2Te3 phase diagram with schematic illustrations of the changes in the material during the annealing process.

Depending on the initial composition of the deposited material, we consider three different cases for the annealing process:
1. Bi-rich material with a Te content below ∼59.8 at.%
In the case of Bi-rich material, the phase diagram indicates the existence of a secondary phase (Bi4Te5) in addition to the Bi2Te3 compound. Bi4Te5 is a layered material, and its crystal structure can be described as an ordered stack of five layers of Bi2Te3 and one layer of Bi2 (for a detailed description of the structure see Ref. Reference Bos, Zandbergen, Lee, Ong and Cava17). At sufficiently high annealing temperatures, the Bi2 layers will react with tellurium from the gas phase to form Bi2Te3. This process will continue until the material has reacted to form a uniform phase of Bi2Te3. The further evolution of this material is similar to the next case.
2. Near-stoichiometric material with a Te content of ∼59.8 to 60.2 at.%
The Te partial vapor pressure over the δ-phase of Bi2Te3 depends on the exact composition of the material, with higher partial pressures for materials with a higher Te content.Reference Brebrick7 During the annealing process, however, the partial pressure in the system is dominated by evaporation of the powdered Te source material and will correspond to the partial pressure of elemental tellurium at the annealing temperature. Equilibrium conditions can only be reached in this system when the Te vapor pressures are equal for both the Te source material and the Bi2Te3 phase. This is only the case for Te-saturated Bi2Te3, corresponding to the right-hand phase boundary of the δ-phase in Fig. 5. The composition of the Bi2Te3 phase will therefore change (with additional Te supplied through the vapor phase) until the composition of the phase boundary is reached.
3. Te-rich material with a Te content above ∼60.2 at.%
Te-rich material is composed of Bi2Te3 and elemental tellurium. As described above, the Te content of the Bi2Te3 phase will change until equilibrium with the Te vapor is reached. On the other hand, the elemental tellurium in the sample is expected to at least partially crystallize and form a second phase. Some amount, however, will probably evaporate during the formation of the Te gas phase, leading to a reduction in the overall Te content.
In addition to the compositional changes, the annealing process should lead to an improvement in crystallinity and a reduction of structural defect levels in the material. Ideally, the annealing treatment will significantly reduce the number of charge carriers introduced by undesired defects (e.g., grain boundaries, vacancies, interstitials, etc.) and leave the antistructure disorder as the dominant doping mechanism. This should effectively fix the carrier concentration.
D. Annealing experiments
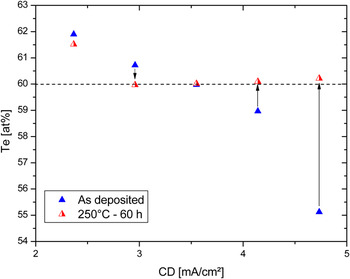
The feasibility of the annealing process was first tested on a series of five samples with tellurium content varying between 55 and 62 at.%. The chosen annealing temperature was 250 °C for 60 h. Figure 6 shows the measured tellurium content of the as-deposited and annealed samples as a function of deposition-current density. The annealing process changes the composition of all samples toward the desired stoichiometry, regardless of the initial value. All samples with a Te content between 55 and 61 at.% resulted in near-stoichiometric Bi2Te3. As the deposition process allows the repeatable fabrication of materials with a Te content of 60 ± 1 at.%, the annealing procedure is a viable method for controlling the final composition.
Te content as a function of deposition-current density for as-deposited and annealed samples.

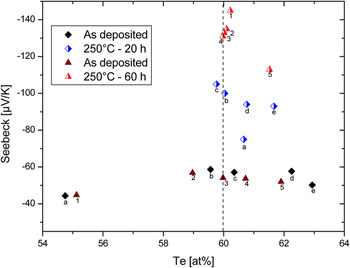
Figure 7 shows the measured Seebeck coefficient as a function of composition for two series of samples. For both series, the initial Te content varied between 54 and 63 at.%. The samples were annealed at 250 °C for 20 and 60 h respectively, to test whether shorter annealing times were sufficient to reach equilibrium. After 20 h, samples with initially low or near-stoichiometric Te content were closer to the desired composition, but the values still show a significant spread. The Seebeck coefficient for these samples was also significantly lower than that for samples annealed for 60 h. This result indicates that annealing for 20 h is not sufficient for reducing the defect density to the desired level. Samples annealed for 60 h consistently (Fig. 7, samples 1–4) showed Seebeck coefficients of approximately −130 μV/K, a more than twofold increase from the initial value. Although this value is still lower than the bulk value of −200 μV/K, it shows that the carrier concentration was successfully decreased through the annealing step. The composition of the annealed samples indicates slightly tellurium-rich Bi2Te3, as expected from the process conditions.
Seebeck coefficient as a function of composition for two series of as-deposited and annealed samples.

Samples with initially high tellurium content (>61 at.%, sample 5) do not reach the desired composition after annealing and are therefore not suitable for this process. These samples also show a consistently lower Seebeck coefficient, indicating higher defect levels.
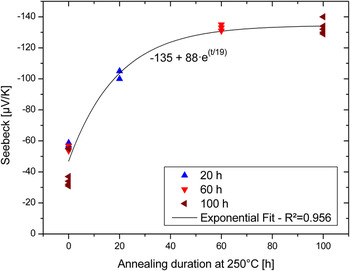
Figure 8 shows the evaluation of the Seebeck coefficient as a function of annealing duration. All samples had an initial Te content of 60 ± 1 at.% and were annealed for either 20, 60, or 100 h at 250 °C. The spread in the Seebeck coefficient of the as-deposited samples is due to the variation of the starting composition. The Seebeck coefficient increases for the first two annealing steps, reaching a value of approximately −130 μV/K after 60 h, but no further improvement is observed when the duration is increased from 60 to 100 h. A similar behavior is observed for the composition, as all samples annealed for 60 h or more show a consistent tellurium content of 60.4 ± 0.4 at.%, regardless of their initial composition. This result indicates that a repeatable steady state is reached for the sample properties after ∼60 h of annealing at 250 °C.
Seebeck coefficient as a function of annealing duration at 250 °C. The curve is fitted with an exponential function.

IV. CONCLUSIONS
This study shows that the combination of ECD and postdeposition annealing can be used for the repeatable synthesis of n-type Bi2Te3 with a defined composition and Seebeck coefficients on the order of −130 μV/K. The presented galvanostatic process allows the deposition of material with near-stoichiometric composition, but relatively low Seebeck values from aqueous electrolytes. The Te content of the electrodeposited material can be controlled with an accuracy of ±1 at.%. In a second step, equilibrium annealing in a Te atmosphere is used to readjust the composition, leading to slightly tellurium-rich, n-type Bi2Te3. This process also reduces the defect density in the material, thereby increasing the Seebeck coefficient. Steady state conditions for the material properties are reached after 60 h of annealing at 250 °C.
ACKNOWLEDGMENTS
This research was supported by the DFG under Grant No. GRK 1322. The authors thank Dr. Harald Böttner (Fraunhofer IPM, Freiburg) for performing some of the annealing experiments and Prof. Clotilde Boulanger (Université Paul Verlaine, Metz) for helping with the electrolyte chemistry.