Glucose is the main precursor of lactose synthesis in mammary tissue (MT) while it is also involved in milk protein and lipid metabolism. All the glucose utilised by this organ must be taken up from the circulation with the glucose transporters (Qi-Zhao & Keating, Reference Qi-Zhao and Keating2007; Mueckler & Thorens, Reference Mueckler and Thorens2013). These glucose transporters are derived from two families: one mediated by Na+/glucose contransporter (protein symbol: SGLT) and another mediated by facilitative glucose transporters (protein symbol: GLUT) (Qi-Zhao, Reference Qi-Zhao2014). The family of GLUTs consists of 14 isoforms with GLUT1 and GLUT3 being the most abundant in the lactating MT (Bionaz & Loor, Reference Bionaz and Loor2011; Qi-Zhao, Reference Qi-Zhao2014). Additionally, the sodium glucose transporter-1 (SGLT1) from the other family plays also a major role in the absorption of dietary glucose (Wright et al. Reference Wright, Loo and Hirayama2011). Further to the glucose availability ensured via the glucose transporter system, the final step for the lactose synthesis in the MT requires the presence of β–(1,4) galactosyltransferase 1 [β-(1,4) GAT 1] and its co-factor, α-lactalbumin (LALBA), while β–(1,4) galactosyltransferase 3 [β-(1,4) GAT 3] is also responsible for the synthesis of the complex–type-N- linked oligosaccharides in many glycoproteins as well as the carbohydrate moieties of glycolipids (Almeida et al. Reference Almeida, Amado, David, Levery, Holmes, Merkx, Van Kessel, Rygaard, Hassan, Bennett and Clausen1997; Lo et al. Reference Lo, Shaper, Pevsner and Shaper1998)
A positive correlation exists between the glucose uptake from the MT and the lactose synthesis (Mirzaei-Aghsaghali & Fathi, Reference Mirzaei-Aghsaghali and Fathi2012) the amount of which is affected by many factors including the energy intake (Szymanski et al. Reference Szymanski, Schneider, Friedman, Ji, Kurose, Blache, Rao, Dunshea and Clarke2007). Indeed, it has been proven that energy restriction causes reduction in the entry of glucose into the whole body, resulting in lower arterial glucose levels (Wieghart et al. Reference Wieghart, Slepetis, Elliot and Smith1986), while on the other hand the high feeding level increases gluconeogenesis (Sano et al. Reference Sano, Takebayashi, Kodama, Nakamura, Ito, Arino, Fujita, Takahashi and Ambo1999). However, although glucose content is modified by energy availability, little is known about the nutritional regulation of genes involved in glucose metabolism in MT. Until now, to the best of our knowledge, the effect of energy restriction on the expression of some genes related to glucose metabolism have been studied only in cows, in both mammary epithelial cells (MEC) purified from milk (Boutinaud et al. Reference Boutinaud, Ben Chedly, Delamaire and Guinard-Flament2008; Sigl et al. Reference Sigl, Meyer and Wiedemann2014) as well as in their MT (Dessauge et al. Reference Dessauge, Lollivier, Ponchon, Bruckmaier, Finot, Wiart, Cutullic, Disenhaus, Barbey and Bautinaud2011). Therefore, the aim of the present study was to determine the effect of long term under- and over-feeding on the expression of genes [GLUT1, GLUT3, SGLT1, β-(1,4) GAT1, β-(1,4) GAT3 and LALBA] related to glucose metabolism in sheep MT.
Materials and methods
The experiment was conducted according to guidelines of the Agricultural University of Athens for the care and use of farm animals by the use of proper management in order to avoid any unnecessary discomfort to the animals. Twenty-four Friesian cross bred dairy sheep, 3 years old and 90–98 d in milk were divided into three homogeneous sub-groups (n = 8) based on their mean body weight (59 ± 4·1 kg) and their mean daily milk yield (1·01 ± 0·197 kg). Each sheep of each group was fed individually throughout the experimental period which lasted for 60 d. The three sub-groups (treatments) were fed with a diet which covered 70% (under-feeding), 100% (control), and 130% (over-feeding) of their daily individual energy and crude protein requirements respectively. The feeding values of the components were taken from published tables (Zervas, Reference Zervas2007) which were used to re-calculate the daily energy supply to the sheep. Crude protein values were determined according to Weende proximal analysis. The amount of food offered to sheep was calculated according to their maintenance and lactation requirements (Zervas, Reference Zervas2007) taking into account their body weight, milk yield and milk fat content. The quantities of food offered to the animals were adjusted at experimental days 0, 12, 24, 31, 39 and 52 according to their individual requirements based on their body weight, milk yield and milk fat content. No refusals were left after feeding. The diet given to sheep consisted of alfalfa hay and concentrates with a forage/concentrate ratio of 50/50. Details of the experimental design were reported previously by Tsiplakou et al. (Reference Tsiplakou, Chadio and Zervas2012).
Sample collection
Milk samples
Individual milk samples were collected from sheep on experimental days 30 and 60 for milk yield and lactose measurements after mixing the yield from the evening and the morning milking on a per cent volume (5%). The lactose analysis was done with IR spectrometry (Milkoscan 133/Foss Electric, Hilerød, Denmark).
Mammary tissue
Mammary tissue samples were taken by biopsy on experimental days 30 and 60 of each dietary treatment after the morning milking. Before the biopsy, the under of the animals was shaved and cleaned, and local anaesthesia was administered by subcutaneous injection of 2 ml lidocaine hydrochloride (xylocaine 2%, AstraZenera, Athens, Greece). A 2-mm incision was made to facilitate the insertion of the biopsy needle. Biopsy samples were taken from the right udder by using a human Bard ®Magnum® Biopsy instrument (BARD, Athens, Greece) in which the BARD biopsy needle (14G) was adapted (BARD, Athens Greece). The length of the sample notch was about 1·9 cm of up to approximately 15 mg tissue from a depth of 3–5 cm. After the tissue samples were taken, a stapler (Leukoclip SD, Smith and Nephew, UK) was used to close the wound and the site of sampling received a prophylactic treatment with a disinfecting powder (Terramycin, w/Polymyxin, Pfizer, Athens, Greece) and then covered with spray (Oxyvet spray, oxytetracycline HCL, Provet, Athens, Greece) for the plaster. Immediately after the biopsy sampling, all animals received antibiotic prophylaxis with 5 ml of Terramycin Long Acting (Pfizer, Athens, Greece).
Determination of transcript levels using real-time RT-qPCR assay
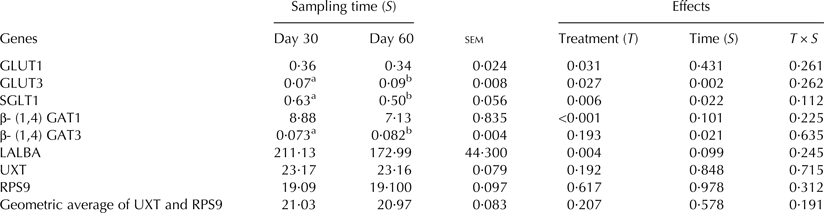
Total RNA was isolated from 15 mg of MT using the Trizol reagent (Invitrogen, Paisley, UK) according to the manufacturer's protocol. Prior to RT-PCR, the total RNA samples were treated with DNase I (Promega, Madison WI, USA) at 37 °C for 60 min. RNA quality was assessed by agarose gel electrophoresis; the quantity was measured with a NanoDrop ND-1000 spectrophotometer, while the purity was determined by the ratio A260/A280>1·9. The different feeding treatments did not affect the quality of the RNA. The complete digestion of genomic DNA was confirmed by real-time PCR reaction using our gene specific primers. First-strand cDNA was reverse transcribed from 2 μg of DNase-treated total RNA, using SuperScript II reverse transcriptase (Invitrogen), according to standard protocols. The resulting first-strand cDNA was diluted to a final volume of 100 μl, and SYBR green-labelled PCR fragments were amplified using gene-specific primers (Table 1) designed from the transcribed region of each gene using Primer Express 1.5 software (Applied Biosystems, Darmstadt, Germany). RT-PCR reactions were performed on the Stratagene MX3005P real-time PCR apparatus using iTaq Fast SYBR Green Supermix with ROX (BioRad, Hercules CA, USA) at a final volume of 15 μl, gene-specific primers at a final concentration of 0·2 μm each and 1 μl of the cDNA as template. PCR cycling started at 95 °C for 10 min, followed by 40 cycles of 95 °C for 15 s and 60 °C for 1 min. The primer specificity and the formation of primer-dimmers were monitored by dissociation curve analysis and agarose gel electrophoresis. The geometrical average of the expression levels from genes ribosomal protein S9 (RPS9) and ubiquitously expressed transcript protein (UXT) was used as internal standard (Bionaz & Loor, Reference Bionaz and Loor2007). Relative transcript levels of the gene of interest (X) were calculated as a ratio to the geometrical average of RPS9 and UXT (C), as (1+E)−ΔCt, where ΔCt was calculated as (C tX–C tC). PCR efficiency (E) (Table 1) for each amplicon was calculated employing the linear regression method on the Log (Fluorescence) per cycle number data, using the LinRegPCR software (Ramakers et al. Reference Ramakers, Ruijter, Deprez and Moorman2003). While some studies have identified stable references genes for cow (Bionaz & Loor, Reference Bionaz and Loor2007) and goat (Bonnet et al. Reference Bonnet, Bernard, Bes and Leroux2013) MT during lactation there is scarce information, to the best of our knowledge, for sheep. So, based on the fact that UXT has been proposed both in cows and goats as a stable reference gene for the MT during lactation (Bionaz & Loor, Reference Bionaz and Loor2007; Bonnet et al. Reference Bonnet, Bernard, Bes and Leroux2013) it was also selected in the present study. Additionally, UXT has been used as a reference gene in a recent study with sheep MT (Carcangiu et al. Reference Carcangiu, Mura, Daga, Luridiana, Bodano, Sanna, Diaz and Cosso2013). As for the choice of RPS9, it was done by taking into account that it has been characterised also by high stability in the MT of cows (Bionaz & Loor, Reference Bionaz and Loor2007), while in goats Finot et al. (Reference Finot, Guy-Marnet and Dessauge2011) concluded that in the choice of reference genes should be included at least a ribosomal protein gene. Further to that, both the reference genes (UXT and RPS9) as well as their geometric average were also tested by the statistical model which was used in this study in order to assure that there was no dietary treatments as well as sampling time effects in their expression (Table 2).
Primers used for real-time RT-Qpcr and the mean PCR efficiency for each gene as calculated by LinRegPCR software (Ramakers et al. Reference Ramakers, Ruijter, Deprez and Moorman2003)

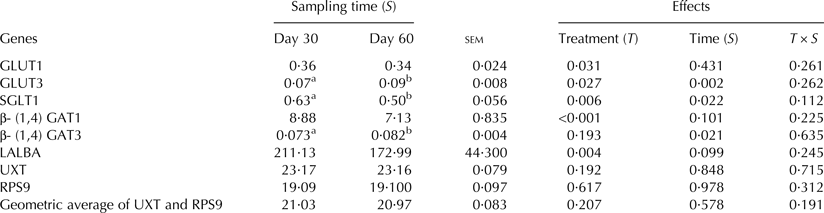
Mean relative transcript accumulation of genes in sheep mammary gland at the two sampling times (experimental days 30 and 60), the main effects (treatment-sampling time) and their interaction
Statistical analysis
The experimental data were analysed using the SPSS statistical package (version 16.0) using a general linear model (GLM) for repeated measures analysis of variance (ANOVA) with dietary treatments (T) (under-feeding = 70%; control = 100%; over-feeding = 130%) and sampling time (S) as fixed effects and their interactions (T × S) according to the model:
 $$Y_{ijk} = \mu + T_i + S_j + (T \times S)_{ij} + A_k + e_{ijk} $$
where Υ ijk is the dependent variable, μ the overall mean, T i the effect of dietary treatment, S j the effect of sampling time, (T × S)ij the interaction between dietary treatments and sampling time, A k the animal's effect and e ijk the residual error. Multiple comparisons were obtained using Duncan's test. Pearson's correlation coefficients were used to determine relationships between gene expression data and lactose yield and content data. Normality of data distribution was tested with Kolmogorov-Smirnov test. Significance was set at 0·05.
Results
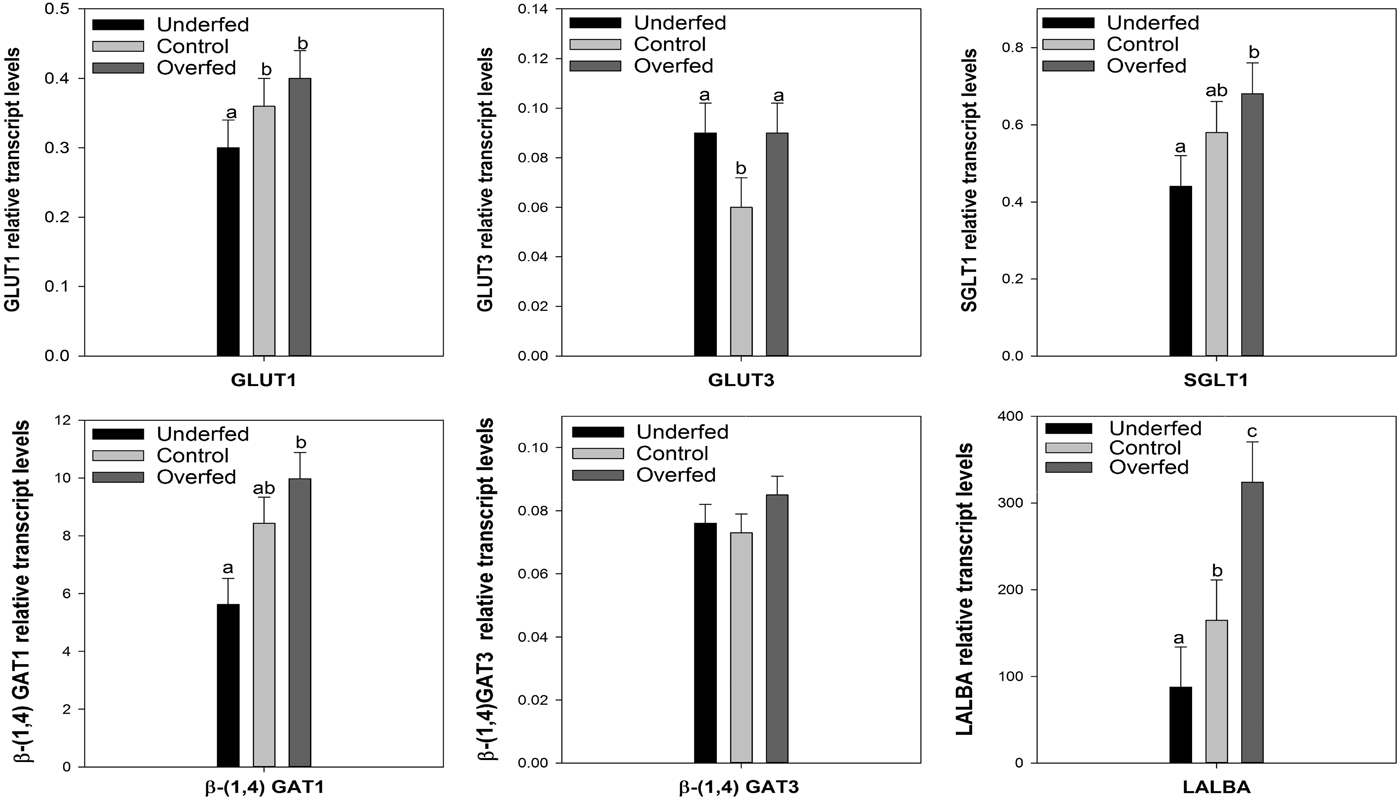
The results showed that underfeeding in sheep caused a significant reduction in their milk and lactose yield compared with over-feeding (Table 3). The mRNA levels of GLUT1 and LALBA genes were reduced significantly in the MT of under-fed sheep compared with the respective control and over-fed (Fig. 1). Additionally, a significant reduction on the mRNA abundance of the SGLT1 and β-(1,4) GAT1 gene in the MT of under-fed sheep compared with the over-fed was observed (Fig. 1). Significantly higher GLUT3 mRNA transcript accumulation in the MT of both under- and over-fed sheep was found (Fig. 1). The dietary treatments did not affect the expression of β-(1,4) GAT 3 gene (Fig. 1). Moreover, the GLUT3 and β-(1,4) GAT 3 transcript accumulation increased significantly throughout the experimental period (experimental day 30 vs. 60) while that of SGLT1 reduced (Table 2). Finally, significantly positive correlations for the mRNA levels of GLUT1 (r = 0·45; P = 0·006), SGLT1 (r = 0·30; P = 0·043), β-(1,4) GAT1 (r = 0·37; P = 0·026) and LALBA (r = 0·58; P < 0·001) gene with the milk lactose content was found (Table 4) as well as for the mRNA levels of GLUT1 (r = 0·37; P = 0·024), SGLT1 (r = 0·40; P = 0·014), β-(1,4) GAT1 (r = 0·47; P = 0·003) and LALBA (r = 0·74; P < 0·001) with the milk lactose yield (Table 4). On the contrary, the correlation observed between the mRNA level of GLUT3 and the milk lactose yield was significantly negative (r = −0·34; P = 0·040) (Table 4).
Relative transcript accumulation of genes involved in glucose metabolism: glucose transporter 1: GLUT1, glucose transporter 3: GLUT3, sodium glucose contransporter 1: SGLT1, two isoforms of β-(1,4) galactosyltransferase: β-(1,4) GAT1, β-(1,4) GAT3 and α-lactalbumin: LALBA. Bars show means ±sem of both sampling times (experimental days 30 and 60). Values without a common superscript (a, b, c) differ significantly (P ≤ 0·05) between dietary treatments (under-feeding/control/over-feeding).
Milk yield, lactose content and lactose yield on sheep at the three dietary treatments at the two sampling times (experimental days 30 and 60)
Pearson's correlation coefficients between the mRNA gene expression data and milk lactose (%) and lactose yield (g/d) at the two sampling times (experimental days 30 and 60)
*P < 0·05, **P < 0·01, and ***P < 0·001
Discussion
Nutrition is a significant factor affecting glucose availability in MT. However, little attention has been given so far to examining the effect of feeding level on gene expression related to glucose metabolism in MT. In this study a significant increase on the GLUT-1 mRNA expression in the MT of the over-fed sheep compared with under-fed was observed, as evidenced also from the significantly higher lactose yield in their milk. This increase may be due to higher insulin concentration already found in their plasma (Tsiplakou et al. Reference Tsiplakou, Chadio and Zervas2012), since recently has been shown in vitro that insulin stimulates glucose uptake via a phosphatidylmositide 3-kinase-linked signalling pathway in bovine MEC (Zhao et al. Reference Zhao, Liu, Zhou, Zhao and Liu2014).
Further to that, recent findings also propose that hypoxia (low oxygen concentration) signalling, through hypoxia inducible factor 1α (HIF-1α), may be another mechanism that underlies the increase in GLUT-1 expression. Besides increased glucose uptake as a consequence of over-feeding is a common response of cells experiencing hypoxia. Indeed, hypoxia (below 5% O2) significantly stimulated glucose uptake and GLUT-1 mRNA expression in bovine MEC in vitro (Shao & Qi-Zhao, Reference Shao and Qi-Zhao2014; Qi-Zhao, Reference Qi-Zhao2014), while a positive correlation exists between GLUT mRNA expression and some hypoxia-related genes in MT of cows (Mattmiller et al. Reference Mattmiller, Corl, Gandy, Loor and Sordillo2011). Elevated expression of the mRNA of GLUT-1 levels in response to high glucose availability in vitro has also been found in chickens and rat thymocypes (Aulwurm & Brand, Reference Aulwurm and Brand2000; Humphrey & Rudrappa, Reference Humphrey and Rudrappa2008). On the contrary, Zhao et al. (Reference Zhao, Liu, Wang, Zhou and Liu2012) in a study in vitro found that 5 and 10-mm glucose compared with the control (2·5 mm) did not influence GLUT-1 gene expression, whereas 20-mm glucose decreased its expression in bovine MEC. Hypoxia can also occur in the cells during under-feeding. It has been observed that starvation results in a 75% reduction in mammary oxygen uptake from blood (Williamson et al. Reference Williamson, Lund and Evans1995). So it was expected that the under-feeding must also lead MT to stimulate glucose uptake in order to defend against the low oxygen supply (Zhang et al. Reference Zhang, Behrooz and Ismail-Beigi1999; Ren et al. Reference Ren, Deng, Wang, Zhu, Wei and Zhou2008). Indeed, (Boado & Pardridge, Reference Boado and Pardridge2002) observed that glucose deprivation increased the mRNA of GLUT-1 expression in rat C6 glioma stable transfected cell lines in vitro. Accordingly, the same has been found in vitro by Fladeby et al. (Reference Fladeby, Skar and Serck-Hanssen2003) using bovine chromaffin cells. However, in our study it was found that under-feeding reduced significantly the GLUT-1 abundance in MT of sheep. Our results agree with those of Boutinaud et al. (Reference Boutinaud, Ben Chedly, Delamaire and Guinard-Flament2008) who concluded that feed restriction causes a significant reduction in the mRNA of GLUT-1 level in bovine MEC purified from milk, which was accompanied by a significant reduction in their milk lactose yield and mammary glucose uptake. The discrepancy of our and Boutinaud et al. (Reference Boutinaud, Ben Chedly, Delamaire and Guinard-Flament2008) results, with those which have been observed in the above studies in vitro, as the effect of glucose deprivation and/or hypoxia on GLUT-1 gene expression, may be due to the different cell types that were used. Additionally, this differentiation of our and Boutinaud et al. (Reference Boutinaud, Ben Chedly, Delamaire and Guinard-Flament2008) results from those in the above studies in vitro, may indicate that glucose availability alone cannot explain the mechanism that regulates the GLUTs metabolism. Besides, even if the mammary glucose uptake is usually decreased under feed restriction in most species (Chaiyabutr et al. Reference Chaiyabutr, Faulkner and Peaker1980; Guinard-Flament et al. Reference Guinard-Flament, Delamaire, Lemosquet, Boutinaud and David2006), its ability to extract glucose (mammary glucose extraction rate) does not vary under feed restriction in lactating dairy cows (Guinard-Flament et al. Reference Guinard-Flament, Delamaire, Lamberton and Peyraud2007). So it seems that the energy balance of the animal may have a stronger impact than the glucose supply on the regulation of glucose metabolism. However, in our study, we had under- or over-supplies of energy and crude protein at the same time, so it is difficult to separate the different effects on glucose metabolism. Perhaps both of them affect this metabolic pathway simultaneously since, in addition to the energy, the crude protein intake of the animal may also have an effect on glucose metabolism. However, the impact of the availability of essential amino acids has been examined only on glucose concentrations and mammary glucose uptake. Indeed, MT glucose uptake in cows does not appear to be affected by availability of essential amino acids, because an infusion of amino acids into the abomasum did not alter mammary glucose uptake (Doepel & Lapierre, Reference Doepel and Lapierre2010; Galindo et al. Reference Galindo, Ouellet, Pellerin, Lemosquet, Ortigues-Marty and Lapierre2011). Whereas Muscher-Banse et al. (Reference Muscher-Banse, Piechotta, Schröder and Breves2012) observed a decrease in blood glucose concentrations in young goats fed with low dietary crude protein levels under isoenergetic conditions. Thus, more research is needed in order to clarify whether the availability of the essential amino acids or the crude protein level affects genes related to glucose metabolism in MT.
GLUT3 has been associated with cells that require rapid bursts of energy (Pantaleon et al. Reference Pantaleon, Harvey, Pascoe, James and Kaye1997). In this study, GLUT3 gene expression increased significantly in the MT of both under- and over-fed sheep compared with the controls. Indeed, in accordance with our findings, Humphrey & Rudrappa (Reference Humphrey and Rudrappa2008) found an increase in GLUT3 abundance with increasing glucose concentrations in chicken thymocypes cultured in vitro. Overall, the different patterns found in the present study, concerning GLUTs isoforms expression in sheep MT, in response to the feeding level are not surprising since each of GLUT isoform serves a specific physiological function (Qi-Zhao & Keating, Reference Qi-Zhao and Keating2007) and each is regulated by distinct mechanisms. The above assumption is supported by the fact that insulin alone increases GLUT1 expression in bovine MT, while it has no effect on other GLUT isoforms (Shao et al. Reference Shao, Wall and McFadden2013). Additionally, the large GLUT1 mRNA abundance, relative to the GLUT3, indicates that GLUT1 plays a critical role in glucose uptake in sheep MT. However, Bionaz & Loor (Reference Bionaz and Loor2011) found that GLUT3 abundance is the highest expressed isoform in bovine MT compared with those of GLUT1. This discrepancy may indicate animal species differences between sheep and cows.
Further to the involvement of GLUTs in the glucose pathway, changes in its uptake are partly achieved by changes in SGLT1 mRNA through a passive mechanism (Zhao et al. Reference Zhao, Dixon and Kennelly1996). Indeed, in this study in accordance with the pattern which follows the GLUT1 mRNA expression, the mRNA level of SGLT1 gene was reduced significantly in MT of the under-fed animals in comparison with the respective over-fed. In agreement with our findings, a reduction on the SGLT1 mRNA gene expression was found in bovine MEC purified from milk, in food-restricted cows (Sigl et al. Reference Sigl, Meyer and Wiedemann2014). A trend towards reduction of the SGLT1 mRNA level was also found in purified MEC from milk in cows fed with a diet which covered 70% of their requirements (Boutinaud et al. Reference Boutinaud, Ben Chedly, Delamaire and Guinard-Flament2008). Further to the energy, nitrogen deprivation reduces also the SGLT1 expression as has been already found in the intestine of young goats fed isoenergetic diets with various crude protein contents (Muscher-Banse et al. Reference Muscher-Banse, Piechotta, Schröder and Breves2012). In this study there was a lower energy and protein content at the same time in the case of under-feeding, and the opposite during the over-feeding. Owing to that, it is difficult to distinguish separate effects between these nutrients on glucose metabolism as mentioned previously. On the other hand, an up-regulation of SGLT1 mRNA expression in the intestine occurred in chickens submitted to feed restriction (Duarte et al. Reference Duarte, Vicentini-Paulino, Buratini, Castilho and Pinheiro2011) and in rats, when subjected in a hypoproteic diet (6%) in comparison with the control (17%) (Pinheiro et al. Reference Pinheiro, Pinheiro, Buratini, Castilho, Lima, Trinca and Vicentini-Paulino2013). The discrepancy concerning SGLT1 gene expression between ruminants, and chickens and rats, in response to changes in the energy or protein intake, may indicates differences between these species or may be also due to the different tissue types used (MT vs. intestine) since the regulation of glucose metabolism may be tissue-type dependent.
Beta-1, 4 galactosyltransferase is the only enzyme to transfer galactose from 5′-dishaspho-galactose terminal N-acetylglucoseamine to form lactose (Ramakrishnan & Qasba, Reference Ramakrishnan and Qasba2001). In this study a significant decrease in the expression of β-(1,4) GAT 1 isoform in MT of under-fed sheep compared with the over-fed was observed and a trend toward a reduction in the mRNA expression of β-(1,4) GAT 3 isoform in the MT of under-fed sheep compared with the over-fed. Despite the fact that mRNA expression of all the specific isoforms of the β-(1,4) GAT gene (including both β-(1,4) GAT 1 and β-(1,4) GAT 3) have been studied in human MT (Mohammad et al. Reference Mohammad, Hadsell and Haymond2012), little attention has been paid so far to ruminant MT, where the transcript accumulation of the β-(1,4) GAT gene has been determined as a whole. Indeed, Liu et al. (Reference Liu, Zhao and Liu2013) observed that 5 and 10 mmol/l glucose compared with 2·5 mmol/l glucose increase the expression of β-(1,4) GAT in bovine MEC but not the 20 mmol/l level. These results by Liu et al. (Reference Liu, Zhao and Liu2013) may indicate that the mammary glucose uptake is controlled by its metabolic use at the intracellular level. However, simultaneously an upper limit level (saturation level) of this utilisation exists. Further to that, Boutinaud et al. (Reference Boutinaud, Ben Chedly, Delamaire and Guinard-Flament2008) showed that feed restriction did not affect the mRNA of β-(1,4) GAT in cow MEC purified from milk. The same has been observed by Dessauge et al. (Reference Dessauge, Lollivier, Ponchon, Bruckmaier, Finot, Wiart, Cutullic, Disenhaus, Barbey and Bautinaud2011) in MT of cows. The discrepancy between sheep and cow, in the effect of feeding level on the β- (1,4) GAT transcript accumulation, may again indicate an animal species differences.
A significant down-regulation of the LALBA mRNA gene expression, involved also in lactose synthesis, in MT of under-fed sheep compared with the respective control and over-fed was found in this study in agreement with the drop in lactose yield in their milk. This result is in line with what has been determined by Ollier et al. (Reference Ollier, Robert-Granie, Bernard, Chilliard and Leroux2007) in MT of 48-h food-deprived goats. Additionally, Dessauge et al. (Reference Dessauge, Lollivier, Ponchon, Bruckmaier, Finot, Wiart, Cutullic, Disenhaus, Barbey and Bautinaud2011) found a reduction in LALBA mRNA level in MT of feed-restricted cows which was followed by lower lactose production in their milk. On the contrary, Nørgaard et al. (Reference Nørgaard, Sørensen, Theil, Sehested and Sejrsen2008) observed that the mRNA abundance of the LALBA gene did not change in MT of cows fed either with a normal or with a low feeding level. No influence of restricted feeding (70% of allowance) on mRNA of LALBA gene expression in cow MEC purified from milk was also found by Boutinaud et al. (Reference Boutinaud, Ben Chedly, Delamaire and Guinard-Flament2008). It should be pointed out here that in the present study a significantly positive correlation (P < 0·001) was determined between the mRNA levels of LALBA with the milk lactose yield. Thus, by taking into account the above results as well as the expression of LALBA and β-(1,4) GAT gene, it can be concluded that sheep, unlike cows, can adapt more easily the glucose metabolism at intracellular level according to the feed supply.
A significant increase on the expressions of β-(1,4) GAT1 and GLUT3 genes throughout the experimental period was found in MT of sheep while the opposite happened for the SGLUT1 gene. In line with our results, Mattmiller et al. (Reference Mattmiller, Corl, Gandy, Loor and Sordillo2011) showed that the GLUT3 gene expression increased significantly into late lactation, while no relative information exists to our knowledge, for possible changes in the expressions of β- (1,4) GAT1 and SGLUT1 over time.
Finally, as expected, significantly positive correlations were observed between the mRNA levels of GLUT1, SGLT1, β-(1,4) GAT1 and LALBA and milk lactose content and milk lactose yield respectively. In accordance with our findings Boutinaud et al. (Reference Boutinaud, Ben Chedly, Delamaire and Guinard-Flament2008) found also a high correlation between LALBA (r = 0·54) and GLUT1 (r = 0·57) mRNA levels, of MEC purified from milk, and the milk lactose yield respectively in cows subjected in once-daily milking which cause a reduction in their milk lactose yield. However, contrary to our results the same researchers (Boutinaud et al. Reference Boutinaud, Ben Chedly, Delamaire and Guinard-Flament2008) did not observe any correlation between the milk lactose yield and SGLT1 and /or β-(1,4) GAT1 mRNA levels in the MEC of cows with once-daily milking despite the fact that a drop in their lactose milk yield was found.
Conclusions
The glucose regulation in MT of sheep fed with different feeding levels depends on its transportation through passive (GLUT1) and active (SGLT1) mechanisms as well as on its metabolic use at intracellular level [β-(1,4) GAT and LALBA]. Energy and nitrogen homoeostasis have a strong impact on the regulation of glucose metabolism in sheep MT. GLUT1 was the most abundant transcript relative to the GLUT3 isoform in sheep MT, which indicates its pivotal role in glucose uptake. GLUT1 accumulation seems to be under the control of insulin and has a different response to the feeding level in relation to the GLUT3 isoform in MT of sheep. Additionally, feeding level has a different impact on β-(1,4) GAT1 and LALBA gene expression in sheep MT compared with cows which may indicate animal species differences.