Introduction
Weeds have specific evolutionary adaptations to diverse crop and weed management strategies and can therefore sustain their populations under a wide range of conditions (Ghersa et al. Reference Ghersa, Roush, Radosevich and Cordray1994). Because weeds compete for resources with crop plants and cause substantial economic losses (Oerke Reference Oerke2006), controlling them is one of the main objectives of crop production. In the past, weed scientists placed less emphasis on the study of weed communities and instead focused primarily on individual weed species and their responses to weed control practices. However, weeds exist within a community, and an increase or decrease in abundance of one species can drive a decrease or increase in abundance of another species (Booth and Swanton Reference Booth and Swanton2002). Therefore, understanding crop management–induced changes in weed community composition is key when devising long-term sustainable weed management strategies (Clements et al. Reference Clements, Weise and Swanton1994; Hobbs and Humphries Reference Hobbs and Humphries1995). Despite early debates, plant ecologists now believe that plant community composition is a result of both deterministic and random processes in the environment (Chase Reference Chase2007). Thus, in agroecosystems, weed species composition is assumed to follow the temporal pattern of environmental changes resulting from the interactions between climatic variables and agronomic variables related to a particular farming system (Ghersa et al. Reference Ghersa, Roush, Radosevich and Cordray1994). Compared with plants in natural environments, weeds in agroecosystems undergo continuous predictable disturbances in the form of crop management practices; hence, deterministic processes can be more important in shaping such communities (Chase and Liebold Reference Chase and Liebold2003).
Understanding weed community dynamics requires knowledge of environmental factors, crop management practices, and community-level interactions. According to community assembly theory, plant communities are assembled and follow trajectories (community states) through time controlled by both biotic and abiotic factors (Diamond Reference Diamond1975). Membership in the community is limited by filters or ecological constraints acting on the species pools (Belyea and Lancaster Reference Belyea and Lancaster1999). Weed communities are also believed to be assembled like other biological communities (Booth and Swanton Reference Booth and Swanton2002). Crop management practices can be highly different depending on the type and the amount of inputs used, types and length of crop rotations, and weed control adopted. Organic and conventional cropping systems often differ in crop management practices that ultimately influence weed community assembly. Few studies have been carried out to understand the overall impact of organic and conventional cropping systems on weed community dynamics (Hyvönen et al. Reference Hyvönen, Ketoja, Salonen, Jalli and Tiainen2003; Roschewitz et al. Reference Roschewitz, Gabriel, Tscharntke and Thies2005; Ryan et al. Reference Ryan, Smith, Mirsky, Mortensen and Seidel2010).
Studying the overall cropping systems effect within a given region can provide insights into the combined effects of contrasting crop management practices such as tillage, fertilization, crop rotation, and weed control strategies on weed community assembly. In some studies, it was found that the cumulative effects of organic and conventional systems have caused differences in species composition and species diversity (Hyvönen et al. Reference Hyvönen, Ketoja, Salonen, Jalli and Tiainen2003; Menalled et al. Reference Menalled, Gross and Hammond2001; Ryan et al. Reference Ryan, Smith, Mirsky, Mortensen and Seidel2010). Still, most long-term studies tend to look at point estimations or cumulative effects over time on species composition rather than real plant community dynamics throughout a time period. Because random environmental perturbations often influence the annual weed community composition more than crop management (Andersson and Milberg Reference Andersson and Milberg1998; Dale et al. Reference Dale, Thomas and John1992; Thomas and Dale Reference Thomas and Dale1991), estimating weed composition at a particular time point may not be ideal for understanding weed dynamics. Hence, there is a need to look at annual variations as well as long-term trajectories in weed community composition among contrasting cropping systems in a given region.
Cropping practices in the Canadian prairies change over time in order to enhance productivity and maintain sustainability. Due to the growing awareness of negative environmental impacts of tillage-based, high-input, crop–fallow cropping systems, alternative cropping systems such as no-till, reduced-input systems or organic systems with more diverse crop rotations are widely practiced in the prairies (Dhuyvetter et al. Reference Dhuyvetter, Thompson, Norwood and Halvorson1996; Lafond et al. Reference Lafond, Loeppky and Derksen1992, Reference Lafond, Zentner, Geramia and Derksen1993; Zentner et al. Reference Zentner, Wall, Nagy, Smith, Young, Miller, Campbell, McConkey, Brandt, Lafond and Johnston2002). Even though the agronomic and environmental benefits of these alternative cropping systems have been evaluated, their impacts on long-term weed community dynamics are not known. Because weeds are believed to be the greatest yield-limiting factor in most of the low-input and organic systems and herbicides are the most frequently used synthetic pesticides in conventional systems, a comprehensive understanding of the long-term impact of these contrasting cropping systems on weed communities contributes to the development of sustainable weed management practices. The long-term alternative cropping systems (ACS) study at Scott, SK, Canada was established to study the agronomic, economic, and environmental aspects of cropping systems in the Canadian prairies (Brandt et al. Reference Brandt, Thomas, Olfert, Leeson, Ulrich and Weiss2010). This study includes three levels of input systems (high, reduced, and organic) and three levels of crop rotation diversities (low diversity, diversified annual grains, and diversified annuals and perennials) that resemble past and present cropping systems in the prairies. Therefore, the aim of our study is to use the ACS data to understand long-term weed community dynamics among diverse cropping systems.
Advanced statistical approaches are needed to understand the impacts of cropping systems and their interactions with the environment on weed community composition. Multivariate statistical tools are the most widely used analytical techniques for studying plant community composition. Even though multivariate techniques are commonly used in ecology, these techniques are underutilized in weed science (Kenkel et al. Reference Kenkel, Derksen, Thomas and Watson2002). Ordination techniques such as canonical discriminant analysis, canonical correspondence analysis, and redundancy analysis are the most common multivariate constrained ordination techniques used to study the relationship between crop management and weed community composition (Derksen et al. Reference Derksen, Lafond, Thomas, Loeppky and Swanton1993; Fried et al. Reference Fried, Norton and Reboud2008; Moonen and Barberi Reference Moonen and Barberi2004; Ryan et al. Reference Ryan, Smith, Mirsky, Mortensen and Seidel2010; Sosnoskie et al. Reference Sosnoskie, Herms and Cardina2006). However, these techniques only examine the cumulative effects over a given time period rather than temporal dynamics of the species composition, so they are not sufficient for understanding the crop management–induced, long-term temporal dynamics in weed communities. Furthermore, none of these techniques consider the repeated nature of the data sampling in long-term experiments. To overcome these limitations in common ordination methods, the principal response curve method (PRC) has been used in ecotoxicology studies (Van den Brink and Ter Braak Reference Van den Brink and Ter Braak1999) and in restoration ecology studies (Pakeman Reference Pakeman2004; Palik and Kastendick Reference Palik and Kastendick2010; Poulin et al. Reference Poulin, Andersen and Rochefort2013; Vandvik et al. Reference Vandvik, Heegaard, Måren and Aarrestad2005). The PRC method is a variant of RDA for repeated observation designs (Van den Brink and Ter Braak Reference Van den Brink and Ter Braak1999). This method allows one to contrast the treatments to a specified control (treatment time series or a time point in the experiment) and determine changes over the time period. This technique can be useful in long-term weed community studies in cropping systems when weed abundance data are collected on multiple occasions within the same experimental units. Therefore, the PRC method is proposed as a means to understand long-term weed dynamics in the ACS study.
Using the PRC method, this study aims to understand the temporal dynamics of the weed community composition due to diverse cropping systems over a long time period. First, we hypothesize that the majority of the variation in the weed community composition in arable land is determined by the interaction between cropping systems practiced and year-to-year random environmental changes. Secondly, we hypothesize that a more diverse cropping system has a more diverse weed community composition than a less diverse cropping system throughout the time. Thirdly, we test the hypothesis that the species diversity of the weed community is high in organic rotations due to more diverse ecological filters.
Materials and Methods
Location and the Experimental Design
An alternative cropping systems trial was established in 1994 at Scott, SK, Canada ( 52°21'57.6" N, 108°49'58.8" W, elevation=713 m) to evaluate the long-term impact of diverse cropping systems on various crop production parameters in the Canadian prairies. It was located near the geographic center of the Canadian prairies in the Dark Brown soil zone. The details of the experiment were presented in Brandt et al. (Reference Brandt, Thomas, Olfert, Leeson, Ulrich and Weiss2010). The experiment was a four-replicate split-split plot in a randomized complete block design with main plot treatments having three levels of inputs and subplots having three levels of crop rotation diversity. Each crop rotation diversity was a 6-yr rotation cycle, and all the six phases were present within each growing season. The experimental site consisted of 16 ha. Within each replicate in a given year, three main plots (input systems) of 76.8m by 140m, three subplots (rotation diversity) of 76.8m by 40m, and six cropping phase plots of 12.8m by 40m within each rotation diversity were present. The year 1994 was the benchmark year in which a barley (Hordeum vulgare L.) crop was seeded to the experimental site. All the treatments were applied from the year 1995 and carried out for 18 yr. The two main treatments were the input level (systems) and the crop diversity level (rotations) with three levels under each treatment. Among input levels, the organic (ORG) system used tillage and nonchemical pest control and soil nutrient management strategies. The reduced system (RED) was a no-tillage system using site-specific integrated management of pests and nutrients (Brandt et al. Reference Brandt, Thomas, Olfert, Leeson, Ulrich and Weiss2010). The high-input system (HIGH) was a tillage-based system that used pesticides according to conventional recommendations and fertilizers based on requirements.
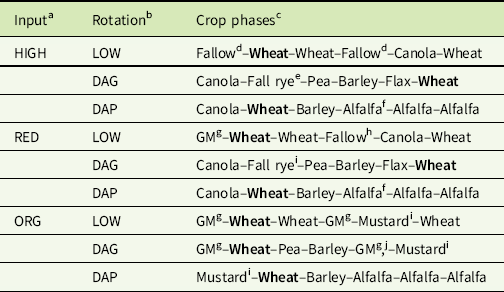
Three levels of crop diversity were used as a 6-yr crop rotation cycle, including low diversity (LOW), diversified annual grains (DAG), and diversified annuals and perennials (DAP). Crop rotations differed between systems to reflect commonly grown crops and practices for each particular system. The crops used in the crop rotations were wheat (Triticum aestivum L.), canola (Brassica napus L.), fall rye (Secale cereale L.), flax (Linum usitatissimum L.), barley (Hordeum vulgare L.), pea (Pisum sativum L.), alfalfa (Medicago sativa L.), mustard (Brassica juncea L.), smooth brome (Bromus inermis L.), oat (Avena sativa L.), lentil (Lense culinaris L.) and yellow sweet clover (Melilotus officinalis L.). All the crop phases in all cropping systems are given in Table 1. In this study, only the wheat (Triticum aestivum L.) phase that was commonly represented in all cropping systems was used for the weed community analysis. The details of the crop phases and their management were described previously (Brandt et al. Reference Brandt, Thomas, Olfert, Leeson, Ulrich and Weiss2010; Benaragama et al. Reference Benaragama, Shirtliffe, Gossen, Brandt, Lemke, Johnson, Zentner, Olfert, Leeson, Moulin and Stevenson2016).
Crop phases of all cropping systems in the alternative cropping systems trial near Scott, SK, Canada.

a HIGH, high-input, conventional tillage; ORG, organic; RED, reduced-input, no-till.
b DAG, diversified annual grains; DAP, diversified annuals and perennials; LOW, low diversity.
c Only weed data from crop phases in bold type were used for the weed community analysis.
d Fallow, summer fallow with weeds controlled by tillage.
e In the third cycle, fall rye was replaced with soft white spring wheat.
f In the first cycle, alfalfa and smooth brome were underseeded to Avena sativa L. in the forage establishment year.
g Lentil GM, green manure (cultivar Indian Head Lentil) partial fallow.
h Chem fallow, summer fallow with weeds controlled by herbicides.
i After the first cycle, canola was replaced with mustard.
j Sweet clover in the first two cycles.
k Barley was underseeded to sweet clover in the first two cycles.
Data Collection
Weed species composition was determined by their density of individual species. Residual weed counts (after application of weed control methods) were taken using twenty 0.25-m2 quadrats per plot in every year from 1994 to 2012. Five quadrats were randomly placed in each quarter of the plot. Weeds were identified to the species level.
Data Analysis
The multivariate statistical analysis technique known as constrained ordination was used to reduce the dimensionality of the species data constrained by the treatment variables and the experimental design. The treatment variables were the nine combinations of the three input systems, the three crop rotation levels, and their interactions with time. The replicate block and subplots were considered covariates, which represent the spatial variability among plots of the treatments applied. The three input systems were the main plots, and the three rotations were the subplots. All multivariate analyses were carried out with log-transformed data using Canoco for Windows v. 4.5 (Ter Braak and Smilauer 1998; Ter Braak and Smilauer Reference Ter Braak and Smilauer2002). Initially, detrended correspondence analysis was carried out for the species data to identify the gradient length (Leps and Smilauer Reference Leps and Smilauer2003; Ter Braak and Prentice Reference Ter Braak and Prentice1988). For this data set, the gradient length was less than 4.0, indicating a linear distribution (non-unimodal); therefore, redundancy analysis was used for all further analyses (Leps and Smilauer Reference Leps and Smilauer2003). To quantify the amount of variation in the species community composition explained by each component (treatments, time, spatial variation) and its statistical significance, several runs of RDA were carried out using several permutations to assess the effects of time, input by rotation, input by time, rotation by time, input by rotation by time, and spatial variability (blocks and subplots) on the species composition (Leps and Smilauer Reference Leps and Smilauer2003). In each permutation test, the individual components were set either as environmental variables (treatments) or as covariates. The spatial variation, identified as replication (blocks) and spatial pattern of sampling plots (split-plot design), was used as the covariate in all tests. A Monte Carlo test with 999 permutations was used to test the significance of each component on species composition and was declared significant at P≤0.05.
The PRC method was used to study the changes in species composition over time. PRCs were derived from the RDA output, in which treatments by time (input by rotation by time) were set as constrained variables and spatial patterns as covariates. The pretreatment year 1994 was set as the reference time point for the PRCs, with species community changes influenced by treatments and their interaction with time expressed relative to the species composition in each treatment in the year 1994 in the ordination diagrams. To obtain PRCs, standardized canonical regression coefficients (Cdt), standard deviations of environmental variables (SD), and total standard deviation in the species data (TAU) were obtained from the RDA output (Van den Brink and Ter Braak Reference Van den Brink and Ter Braak1999). PRC scores (canonical coefficients) were obtained using the following equation according to Van den Brink and Ter Braak (Reference Van den Brink and Ter Braak1999):
 $$\left( {{\it TAU}{\times}{\it C}_{{{\it dt}}} } \right)\,/\,{\it SD}$$
The PRC scores were graphed against time for each treatment. Species weights (bk) for the first axis were obtained from the RDA and were included in a separate table with the ordination diagram. The species weights were obtained using the following equation according to Van den Brink and Ter Braak (Reference Van den Brink and Ter Braak1999):
 $${\it exp}\left( {{\it b}_{{{\it k{\times}}}} {\it C}_{{{\it dt}}} } \right)$$
Equation 1 expresses the proportional change of species (k) in treatment (d) and in the year (t) relative to the species abundance in the year set as the reference or the control time point (in this study, it is the year 1994). The significance of each of first two ordination axes (effect of treatments and their interactions with time on species composition represented by the canonical axis) was tested using the Monte Carlo test with 499 permutations and declared significant at P<0.05.
To determine the species associated with a particular cropping system (cumulative effect over 18 yr, ), indicator species analysis was carried out by calculating the IndVal index (Dufrêne and Legendre Reference Dufrêne and Legendre1997) using the ‘indicspecies’ package (De Caceres and Legendre Reference De Caceres and Legendre2009) in R software v. 3.1.2 (R Development Core Team 2015). Species with significant association (P<0.05) were determined to be associated with the particular group of cropping systems. Only the species with an indicator value>0.2 were shown in the results. The overall species community structure was determined by calculating species diversity indices such as species richness, evenness, and the Shannon-Wiener diversity index for each plot using the package ‘BiodiversityR’ (Kindt and Coe Reference Kindt and Coe2005) in R software v. 3.1.2. All these biodiversity indices for each treatment in each year were then analyzed by repeated-measures ANOVA performed using the PROC MIXED in SAS software v. 9.3 (SAS Institute 2011) to compare the mean species diversity indices among cropping systems. Cropping systems were considered fixed factors, while time and the design of the experiment were considered random factors. Compound symmetry was used as the covariance structure to model the data. Means were separated using the LSD test and declared significant at P<0.05.
Results and Discussion
Factors Determining the Weed Species Composition
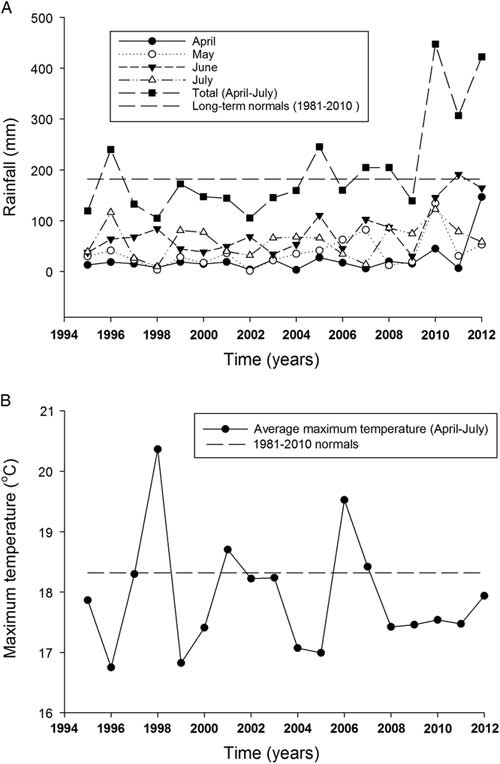
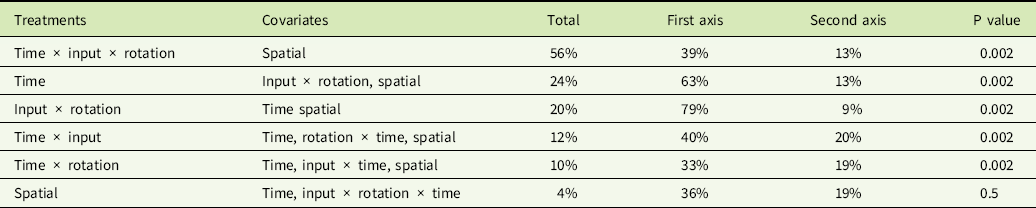
The variance partitioning (Table 2) explains the amount of variation of species composition that can be explained by the factors considered in the experiment (time, cropping systems, spatial arrangement, and their interactions). Weed community composition was influenced by both environmental factors (time) and crop management factors (Table 2). In this study, we assume that the variation of main environmental factors (seasonal rainfall and temperature) is reflected in the time factor. The time by input by rotation interaction accounted for the greatest amount of total variation at 56%. This indicates that, overall, time, input, rotation, and their interactions account for the highest variation (Table 2). Time itself had considerable effect on weed composition and accounted for 24% of the variation. Most of the temporal effects on weed community composition could be due to the changes in rainfall pattern and temperature throughout the period. The total and monthly rainfall during the growing season (Figure 1A) and the monthly temperature (Figure 1B) showed year-to-year fluctuations. Therefore, the time-dependent random variation in environmental conditions could be the most important single factor that determines the weed community composition. However, some of the variation that is not accounted for by crop rotation and by input systems in this study may be also due to the differences in crop entry points, a factor not captured in this analysis, because the wheat phase that is the focus of the study did not have a uniform entry point across the various rotations.
Yearly total and monthly growing season rainfall (A) and growing season average maximum temperature (B) at the alternative cropping systems site in Scott, SK, Canada. The dotted lines represent the long-term normals, and the solid lines represent the mean growing season (April to July) total rainfall and maximum temperature.

The amount of variation of the species composition extracted by the first two ordination axes attributed to cropping systems, time, and the spatial variation.Footnote a

a Weed species data collected in the wheat phases from all cropping systems in the ACS trial during 1995 to 2012 were used in the ordination.
Crop production practices were the second most influential factor that affects species composition. Crop input and rotation interaction explained 20% of the variation in weed species composition that was not explained by temporal and spatial variability (Table 2). The interaction of time by input systems accounted for 12% of the variation, and time by rotation accounted for 10% variation in the weed species community composition.
Changes in Weed Community Composition over Time
In this study, the PRCs were used to understand the weed community composition change over the time period. Of the 56% of the variation explained by input by rotation by time interaction (Table 2), 39% was explained by the first canonical axis and 13% by the second canonical axis of the PRC (Table 2).
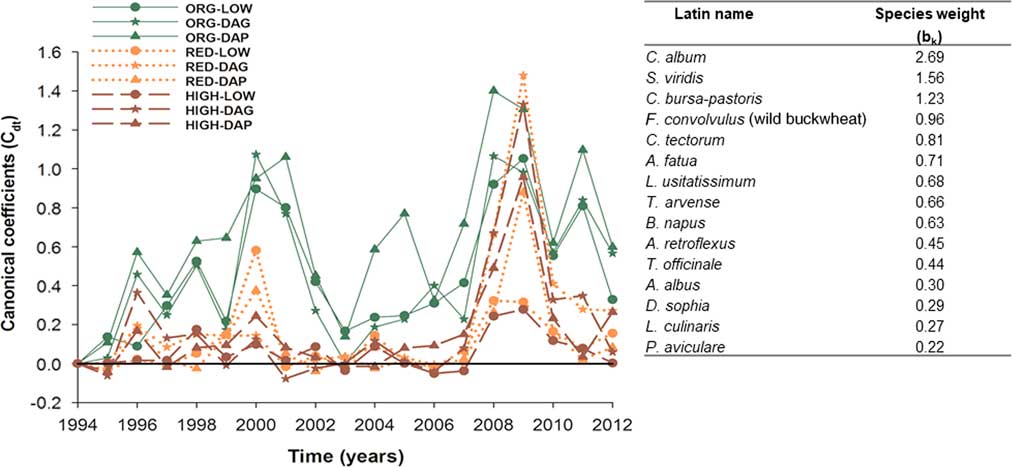
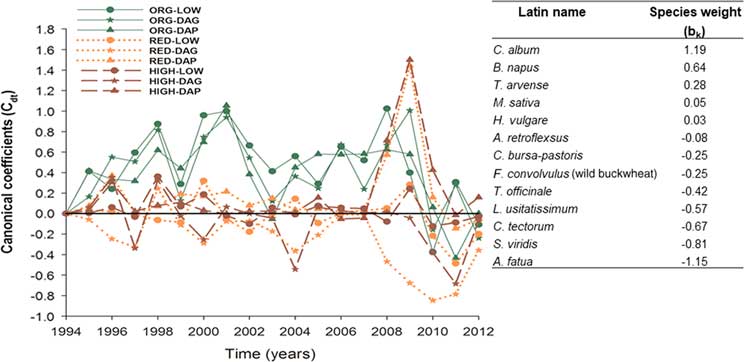
The first PRC axis explained 39% of the variability, indicating significant changes in the weed community composition attributed to treatments over time compared with the year 1994 (Figure 2). A PRC above or below zero for any time point indicated changes in species composition relative to the year 1994. Species weights given in the table in Figure 2 provide the association of the particular species to the PRC. The higher the species weight of a particular species, its dynamics can be explained by the pattern of the PRC particular to a given treatment. For instance, in the year 1996 in ORG-DAP, the canonical coefficient was 0.58 (Figure 2); hence, the abundance of common lambsquarters (Chenopodium album L.) was 4.7 (exp(2.69×0.58)) times greater in the year 1996 than the year 1994.
The first ordination axis (principal response curves [PRCs]) for the species abundance data collected in the alternative cropping systems study in Scott, SK, Canada, from 1994 to 2012. The horizontal solid line at zero represents the reference time point (year 1994), and all the changes in the weed composition were explained by PRCs for each treatment relative to the year 1994. Of the 56% of the variation in the weed community explained by input by rotation by time interaction, 39% was explained by the first axis and was significant at P < 0.01. The table to the right of the graph provides the species weights (bk), which indicate the association of a particular species to the PRCs. The higher the value of the species weight for a particular species, the more the species follows the pattern in the PRCs. DAG, diversified annual grains; DAP, diversified annuals and perennials; HIGH, high-input, conventional tillage; LOW, low diversity; ORG, organic; RED, reduced-input, no-till.

The first principal response axis was mostly found to explain the variation among input systems, because they are shown to deviate along the first axis. Accordingly, the weed community composition in the three ORG treatments began to change after 1994. Importantly, the community composition was different in all years following 1994. However, apart from year-to-year variation, there were no continuous trajectories in the weed community in any of the treatments over time. Despite year-to-year variation, the weed composition in the ORG systems was found to deviate clearly from the RED and HIGH systems in most years. Some of the rotation treatments within the RED and HIGH systems had a species composition similar to that of ORG systems in 2009. Despite differences in the use of tillage among conventional systems (RED and HIGH), the species compositional dynamics over time were similar, except in a few years. In most previous studies, tillage was found to be the most influential factor determining the weed composition (Buhler Reference Buhler1995; Légère et al. Reference Légère, Stevenson and Benoit2005). If tillage is the predominant filter for weed communities, we should have observed greater variation in community composition in the reduced input system (RED), as it is the only system in which tillage was not used. Hence, this study confirms that weed compositional dynamics are determined by many collective factors in a cropping system, rather than by tillage alone. Blackshaw (Reference Blackshaw2005) also showed that even though tillage was usually associated with different weed compositions, weed species were not consistent in their response to tillage. Furthermore, there was no increase in perennial species with no-till systems as was observed in many other studies (Cardina et al. Reference Cardina, Regnier and Harrison1991; Moyer et al. Reference Moyer, Roman, Lindwall and Blackshaw1994; Swanton et al. Reference Swanton, Clements and Derksen1993; Zanin et al. Reference Zanin, Otto, Riello and Borin1997). Because weed abundances in the present study were estimated after application of weed control treatments, the in-crop weed control strategies should have been the strongest selective forces determining the weed community. Accordingly, the increase in weed abundance and composition in all systems found in the years 2000 and 2009 could be due to the failure of weed control strategies. Rainfall events might have interfered with both herbicide applications in conventional systems and mechanical weed control in ORG systems, or these years might have had rainfall events after weed control that triggered the emergence of new weeds.
Chenopodium album, green foxtail [Setaria viridis (L.) P. Beauv.], shepherd’s-purse [Capsella bursa-pastoris (L.) Medik.], and wild buckwheat [Fallopia convolvulus (L.) Á. Löve] strongly followed the pattern of the first PRC in all systems (Figure 2). The common pattern observed in community changes was distorted in the years after 2008, when the two conventional systems showed greater changes in the weed community and clearly showed differences among rotations as well. These contrasting changes observed after 2008 could be due to some notable changes in the rainfall pattern (Figure 1).
The second principal response axis explained 13% of the treatment by time interactions that were not explained by the first principal response axis (Figure 3). In general, crop rotations were found to separate along the second axis more than along the first axis. The effect of crop rotation on weed community composition was found to depend on the input system. In ORG systems, the difference in composition among crop rotations was not high, but in the two conventional systems, the DAG rotation showed a more diverse community throughout many years, as the PRCs in the DAG rotations in both HIGH and RED systems are lying in the negative side of the graph, indicating dominance of different type of species (Figure 3).
The second axis (second set of principal response curves [PRCs]) for the species abundance data collected in the alternative cropping systems study in Scott, SK, Canada, from 1994 to 2012. The year 1994 was used as the reference time point, and all the changes in the weed composition were explained by PRCs for each treatment relative to the year 1994. Of the 34% residual variation (variation left after excluding the variation explained by the first axis), 13% was explained by treatment by time interaction, and it is significant at P < 0.01. The table to the right of the graph provides the species weights (bk), which indicate the association of a particular species to the PRCs. The higher the value of the species weight for a particular species, the more the species follows the pattern in the PRCs. DAG, diversified annual grains; DAP, diversified annuals and perennials; HIGH, high-input, conventional tillage; LOW, low diversity; ORG, organic; RED, reduced-input, no-till.

According to the species coefficients table (Figure 3), C. album, volunteer canola (Brassica napus L.), and field pennycress (Thlaspi arvense L.) were highly associated with treatments with a PRC above zero, while wild oat (Avena fatua L.), S. viridis, and narrowleaf hawksbeard (Crepis tectorum L.) were declining in abundance in treatments above the curve. Until 2008, the three ORG rotations were found to follow a distinct pattern compared with the HIGH and RED rotations, except for a few years. After 2008, an abrupt changes in species composition occurred, probably due to a greater fluctuation in total rainfall (Figure 1). Among conventional systems, crop rotations were found to diverge over time in terms of species composition. The diversified annual rotations (DAG) in both the HIGH and RED systems resulted in a distinct pattern compared with other treatments. In most years, these two treatments showed negative coefficient values. Therefore, according to the species coefficients table (Figure 3), A. fatua, S. viridis, C. tectorum, and flax (Lens usitatissimum L.) were the most abundant in DAG rotations in both HIGH and RED systems. Furthermore, the species C. album, volunteer canola, and stinkweed [Pluchea camphorata (L.) DC.] were declining in abundance in most years in these DAG rotations in the two conventional systems. The PRC showed a consistent, low abundance of A. fatua in all the DAP rotations in most years. Similarly, in a different study in the ACS, Beckie et al. (Reference Beckie, Johnson, Leeson, Shirriff and Kapiniak2014) found better control of A. fatua in the same DAP rotation. In another study, Harker et al. (Reference Harker, O’Donovan, Turkington, Blackshaw, Lupwayi, Smith, Johnson, Pageau, Shirtliffe, Gulden and Rowsell2016) found that A. fatua was well controlled following a 3-yr alfalfa (Medicago sativa L.) crop. In this study, a distinct pattern was observed in the diversified annual perennial rotation in RED and HIGH systems, where an increase in C. album, canola, and P. camphorata occurred, while a decrease in A. fatua, S. viridis, and C. tectorum was observed. The HIGH-LOW and the RED-LOW systems were found to follow a similar pattern with less deviation from the year 1994. After 2008, the deviation in species composition was higher than the other years.
In this study, none of the cropping systems showed a distinct weed community composition throughout the time period, and none of the systems showed any clear trajectories (continuous changes) in species abundance. Therefore, we confirmed the importance of understanding temporal dynamics of weed composition associated with cropping systems before making any conclusions about the association of community with particular cropping systems or with particular management practices. However, the ORG systems tended to have the most influence on changes in species community over time compared with the year 1994, indicating that ORG systems imposed contrasting ecological filters on weed communities. Comparatively consistent weed composition indicates that weed communities in ORG systems were either stable under the diverse ecological conditions or were dominated by a few species not controlled in the ORG systems. A greater abundance of weeds in ORG systems due to lack of effective weed control strategies was identified in the ACS study (Benaragama et al. Reference Benaragama, Shirtliffe, Gossen, Brandt, Lemke, Johnson, Zentner, Olfert, Leeson, Moulin and Stevenson2016). Therefore, an increase in abundance of some weed species may have caused a distinct weed community in ORG systems throughout the time period. The differences in the use of inputs also could have caused ORG systems to be distinct in weed community response over time. Differences in types and the intensity of fertilizer application can influence weed composition to a greater degree (O’Donovan et al. Reference O’Donovan, Blackshaw, Harker, Clayton, Moyer, Dosdall, Maurice and Turkington2007; Smith et al. Reference Smith, Mortensen and Ryan2010). ORG systems in the ACS have a low fertility status (Benaragama et al. Reference Benaragama, Shirtliffe, Gossen, Brandt, Lemke, Johnson, Zentner, Olfert, Leeson, Moulin and Stevenson2016), but organic systems can have diversity in resource dynamics (Ryan et al. Reference Ryan, Smith, Mortensen, Teasdale, Curran, Seidel and Shumway2009; Smith et al. Reference Smith, Mortensen and Ryan2010) and thus differentially influence weed emergence. Weed species such as C. album, S. viridis, P. camphorata, and F. convolvulus were the dominant species in ORG systems. Among these, C. album and S. viridis were found to be the two most dominant species in ORG systems, indicating the difficulty of controlling weeds in organic systems. The less selective disturbances of mechanical weed control methods used in organic systems compared with the herbicides used in conventional systems may be the most important factor determining the differences in weed species communities.
Overall Species Associations with Cropping Systems
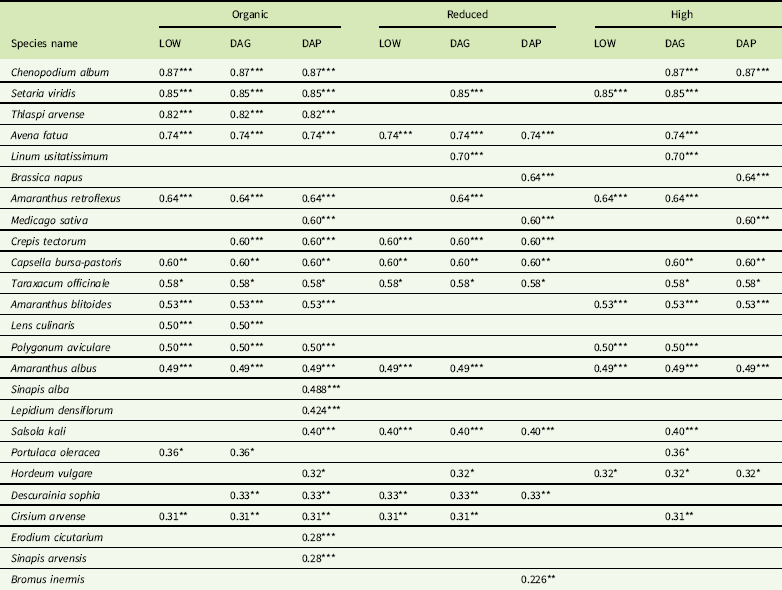
In contrast to the PCR method, indicator species analysis provides the mean species association with the particular cropping system. In this study, indicator species analysis showed distinct associations of weed species with particular cropping systems, while some weeds were associated with more than one cropping system (Table 3). Weed species such as white mustard (Sinapis alba L.), greenflower pepperweed (Lepidium densiflorum Shrad.), redstem filaree [Erodium cicutarium (L.) L’Hér. Ex Alton], and wild mustard (Sinapis arvensis L.) were only associated with ORG systems with perennials in rotation (ORG-DAP) (Table 3). Smooth brome (Bromus inermis Leyss.) was mainly associated with reduced systems with perennials in rotation (RED-DAP), as it was found in all DAP rotations during the first 6 yr. Even though the above-named species were associated with particular cropping systems, their mean abundance was fairly low (unpublished data). All the other most abundant species were found to be associated with more than one cropping system. Chenopodium album was associated with all ORG rotations and with the HIGH-DAG and HIGH-DAP rotations, indicating some association with conventional tillage systems. Setaria viridis was associated with all ORG systems and the HIGH-DAG, HIGH-DAP, and RED-DAG systems. Volunteer flax was common in the DAG rotation in the RED and HIGH systems, as those were the rotations that used flax as the crop before wheat in the rotation. Volunteer canola was more abundant in DAP rotations in both HIGH and RED systems, probably because it was the crop before wheat in the rotation.
Indicator values and their probability for the species associated with the nine cropping systems at the alternative cropping systems trial near Scott, SK, Canada.Footnote a

*Significance at P = 0.05
**Significance at P = 0.01.
***Significance at P = 0.001.
a DAG, diversified annual grains; DAP, diversified annuals and perennials; LOW, low diversity.
Species Diversity
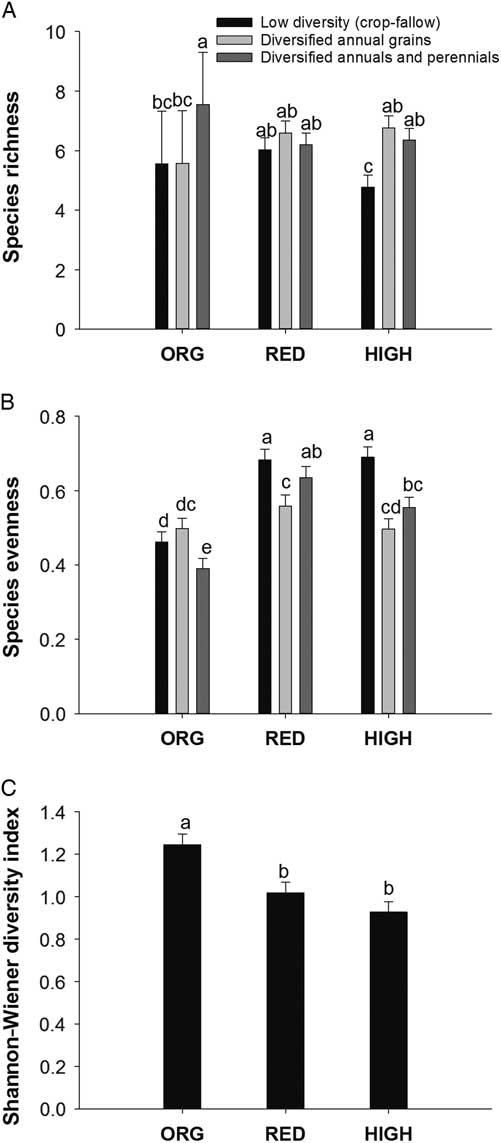
Species richness (number of species per unit area) and species evenness was determined by the input by rotation interaction (P≤0.05), but the Shannon-Wiener diversity index was affected by the input system only (P≤0.05). Therefore, the data on the Shannon-Wiener diversity index were shown as an average across rotations. Species richness was lowest in the HIGH-LOW system (Figure 4A). Both the DAG and DAP rotations had a greater species richness than the LOW rotation within HIGH system. Within the ORG system, the DAP rotation had the greatest species richness. Interestingly, there were no differences in species richness among RED rotations. Therefore, this study indicates that the presence of tillage in ORG and HIGH systems had an interaction with crop rotation diversity on determining species richness. The species evenness differed among cropping systems. It was similar among input systems in the DAG rotation (Figure 4B). The lowest evenness was in the ORG-DAP system, indicating a few species dominating that system. Within the RED system, evenness was lower in DAG than in other rotations. In HIGH systems, the LOW diversity rotation had fairly high evenness in comparison to the DAG and DAP rotations. Overall, the Shannon-Wiener diversity index indicated that ORG systems had the highest species diversity, and they were different from RED and HIGH systems (Figure 4C). Similarly, other studies also found that species diversity in organic systems was greater compared with conventional systems (Rotchés-Ribalta et al. Reference Rotchés-Ribalta, Armengot, Mäder, Mayer and Sans2017; Ryan et al. Reference Ryan, Smith, Mirsky, Mortensen and Seidel2010). Both the HIGH and RED systems had similar diversity. Even though the rotation with annuals and perennials was functionally more diverse, the annual grain rotation, which had many different annual crop species, had a more distinct weed community composition. Smith and Gross (Reference Smith and Gross2007) also found that the effect of the individual crop has more effect than the overall diversity in the crop rotation on weed composition. Still, the crop rotations with perennials had the greatest number of weed species. High species richness in these rotations could be due to either greater functional diversity among crops grown or fewer disturbances because of the 3-yr perennial forage crop.
Mean species richness (A), species evenness (B) and Shannon-Wiener diversity index (C) for cropping systems at ACS study in Scott, Saskatchewan, Canada from 1995-2012. Error bars indicate standard errors of the lsmeans. Comparisons made between treatments with different letters indicate a significant different at LSD P < 0.05. HIGH, high-input, conventional tillage; ORG, organic; RED, reduced-input, no-till.

Chenopodium album was found to be the most problematic weed in most of these cropping systems. Its wide occurrence in most cropping systems indicates its ability to survive under a wide range of cropping conditions. Interestingly, C. album was highly associated with tillage systems (HIGH and ORG), and it was not as prominent in the no-tillage (RED) system. The fallow periods in the HIGH systems appear to be able to control this species, as it also was not associated with HIGH-LOW rotation. The grass species A. fatua and S. viridis tended to increase, while broadleaf species tended to decrease in abundance in the DAG rotation in both the HIGH and RED systems. Inefficient selective grass weed control using herbicides in the wheat crop compared to broadleaf weed control could be the reason for the high number of grass species. Furthermore, in the DAG rotation, the wheat crop used in this study was preceded by the less competitive flax crop, which might have increased the abundance of these two weed species. Having a fallow period in the LOW diversity rotation or a perennial forage crop in DAP rotations may have improved the suppression of A. fatua and S. viridis better than other rotations. Canola was grown in all conventional rotations, but the canola was found to be a problematic volunteer crop in HIGH-DAP and RED-DAP systems. Less soil disturbance in DAP rotations could be one of the main reasons for such observations. Similarly, in some other studies, volunteer crops were found in reduced tillage systems (Derksen 1993; Froud-Williams 1987).
By using the PRC method, this study provided insights into the long-term temporal dynamics of weed community composition. Importantly, it allowed comparison of the temporal weed compositional dynamics of nine cropping systems and assessment of the important species over time for each cropping system. In this study, the benchmark year was used as the reference time point, and all the changes in the species in the community were assessed with reference to that time point. This allowed interpretation of the progress of weed community development (succession) from the time of initiation of the cropping systems. On the other hand, it is also possible to use a treatment or treatment combination (cropping system) as the reference point instead of a time point. However, in this method, the actual changes in the reference treatment cannot be determined.
Overall, use of the PRC method in this study was found to be a powerful tool to understand long-term weed community dynamics among cropping systems. The use of the PRC method enabled us to provide evidence supporting the hypothesis that weed communities in cropping systems are determined by the interaction of year-to-year random environmental changes and crop management practices (cropping systems). Also, the PRC method was able to identify year-to-year environment-driven random changes as the predominant single factor causing fluctuations in weed community composition over time. Due to the random climatic changes, clear trajectories of weed community composition over time were not identified. This study also was able to support the second hypothesis: ORG rotations clearly differed from the two conventional rotations in most years and had more diverse weed communities compared with the two conventional systems. Organic rotations clearly differed in species composition compared with the two conventional systems in many years. There were no substantial differences identified in weed community composition among crop rotations of RED and HIGH systems. This study underscores that it is essential to understand the long-term dynamics of species composition associated with cropping systems to devise meaningful weed management strategies. Also, it further revealed that with current cropping system diversity, some weed species are difficult to manage and are better adapted to diverse crop management conditions.
Acknowledgments
The authors wish to acknowledge Agriculture Agri-Food Canada for initiating and running the long-term ACS experiment at Scott. Special thanks should go to all the scientists and technicians involved in this project over a long period of time. The authors also wish to thank Professor Paul van den Brink, Alterra and Wageningen University, for his valuable support in the statistical analysis. The authors wish to declare that there are no conflicts of interest.