I. INTRODUCTION
III-nitride semiconductors have been investigated extensively because of their superior properties in the development of high-efficiency devices for various applications, such as general illumination, biological sensors, and data storage. Reference Nakamura, Senoh, Nagahama, Iwasa, Yamada, Matsushida, Suhimoto and Kiyoku1–Reference Shmagin, Muth, Kolbas, Dupuis, Grudowski, Eiting, Park, Shelton and Lambert4 Significant progress has been made in bright light-emitting diodes (LEDs) and laser diodes through the use of InGaN/GaN multiquantum wells (MQWs) as active materials. Reference McCluskey, Romano, Krusor and Johnson5 These materials have a high-radiative recombination efficiency and are capable of emitting over a spectral range that almost covers the visible spectrum and extends into the ultraviolet region by control of In composition. Reference Mukai, Yamada and Nakamura6 It is expected that this compound could be used in future to develop tunable optical devices because of its wide wave length range. Reference Ko, Song, Leung, Han and Cho7 Since band gap is determined by In concentration, a direct determination of this composition is very important. And the inhomogeneity is often formed in InGaN/GaN system, it can be affected in device efficiency. Furthermore, the development of devices tends to increasingly complex and minimized. Therefore, the analysis method is necessary, which can provide accurate information in complex and small structure.
Typically, the analysis of In composition has been attempted by high-resolution x-ray diffractometry (HRXRD), Rutherford backscattering spectrometry (RBS), secondary-ion mass spectrometry (SIMS), etc. Reference Ramaiah, Su, Chang, Kerr, Liu and Chen8–Reference Marona, Perlin, Czernecki, Leszczyński, Boćkowski, Jakiela, Suski and Najda10 RBS and SIMS are powerful methods for compositional analysis. HRXRD can be used to obtain lattice parameters with subangstrom sensitivity, and chemical composition is estimated indirectly by applying Vegard's law. Reference Van de Walle, McCluskey, Master, Romano and Johnson11 However, the narrow width and complex structure of InGaN/GaN MQWs in LED devices make that the mentioned methods are difficult to analyze compositional analysis. High-resolution transmission electron microscopy (HRTEM) can be used for the direct imaging on the atomic scale. The HRTEM image is formed by interference of both transmitted beam and multiple diffracted beams, and it contains structural information. Therefore, the lattice image can determine lattice parameters through accurate measurement with subangstrom resolution by HRTEM. Reference Kisielowskia, Hetherington, Wang, Kilaas, O’Keefe and Thust12 Further, geometric phase analysis Reference Li, Zhao, Xing, Su and Cheng13 and peak finding methods, Reference Galindo, Kret, Sanchez, Laval, Yanez, Pizarro, Guerrero, Ben and Molina14 which are strain mapping methods based on the HRTEM technique, have been applied due to its accurate structural information. Thus, HRTEM can be used to analyze composition when the structural information is matched with the composition analysis. High-angle annual dark-field scanning TEM (HAADF-STEM) micrographs are formed by incoherently scattered electrons as opposed to Bragg scattered electrons. This analysis technique is sensitive to variations in sample atomic number (Z-contrast images), Reference Pennycook, Berger and Culbertson15 and HAADF-STEM can provide information on specimen composition. Thus, HRTEM and HAADF-STEM techniques can be very useful for analyzing In composition of InGaN. Reference Schulz, Remmele, Markurt, Korytov and Albrecht16,Reference Walther, Amari, Ross, Wang and Cullis17 Moreover, these techniques are expected to be the most suitable methods for analyzing InGaN/GaN MQWs in LED devices with complex structure by directing observation.
In this study, we determined the quantitative In composition in InGaN/GaN MQWs in real LED devices using HRTEM and HAADF-STEM techniques. To confirm the reliability of the results, the In compositions of InGaN were measured by RBS and HRXRD.
II. EXPERIMENTAL
We prepared thin InGaN layers with different In compositions. Test samples A (T-A) and B (T-B) were grown on thick GaN films on a sapphire (0001) substrate by metal organic chemical vapor deposition. The thicknesses of the InGaN layers in T-A and T-B, as determined from TEM, were ∼35.4 and ∼37.8 nm, respectively. The samples were thick enough for measurement using RBS and HRXRD. HRXRD measurements and simulation of the T-A and T-B samples were performed to measure the In compositions quantitatively, and the values obtained were compared with RBS results. HRXRD measurements were obtained using a Cu Kα x-ray source. The In composition in the InGaN layer from HRXRD results was simulated using the X'pert Epitaxy program. RBS was performed using a 1 mm collimated beam of 2.275 MeV4 He+ ions at 40 μC. Backscattered particles were detected at 160° with respect to the beam direction. TEM specimens were prepared by the focused ion beam (FIB) technique with the thickness of about 50 nm. TEM observations were carried out with a JEM-ARM200F (JEOL Ltd., Tokyo, Japan) at a 200 kV acceleration voltage with US1000 CCD cameras. The zone axis was the GaN
 $\left\langle {11\bar 20} \right\rangle$
beam direction. The HRTEM images were observed with the fast search mode of the Digital Micrograph using the exposure time of 0.5 s at the magnifications of more than 200,000. HAADF-STEM measurements were performed at 70–170 mrad detector angles, and the probe size was 0.1 nm. The Scan rate was of 2.5 milliseconds per line for 288 lines per frame. To measure accurate lattice parameters from HRTEM images, the lattice constant of GaN in the HRTEM images was calibrated by matching the known lattice parameter of GaN. From the HRTEM images, we measured the several InGaN lattices spacing through directly comparing the GaN lattices spacing in the same image. In compositions were evaluated by changing the lattice parameters and comparing these with HRXRD simulation results. We then analyzed the In composition of InGaN/GaN MQWs in a real LED device by HRTEM technique. The MQWs were positioned between a 7 μm-thick Si-doped GaN layer on the sapphire substrate and a 200 nm-thick Mg-doped GaN capping layer. The InGaN/GaN MQWs contained three 2 nm-thick InGaN wells with 6 nm-thick GaN barriers (low-In region) and five 3 nm-thick InGaN wells with 2 nm-thick GaN barriers (High-In region). The In composition of the InGaN/GaN MQWs was determined by HRTEM and HAADF-STEM techniques, while RBS and HRXRD measurements could not be conducted because of the very thin InGaN quantum wells and complex structure of the LED devices.
III. RESULTS AND DISCUSSION
A. Quantitative analysis of In composition in InGaN layers of test samples
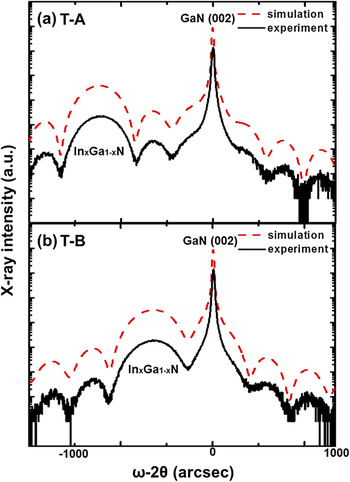
Figure 1 shows the measured and simulated 2θ/ω HRXRD spectra of the InGaN/GaN samples, T-A and T-B. Well-separated InGaN and GaN (002) peaks and layer thickness fringes were observed. When the epitaxial thin films have flat surfaces, in other words, film thicknesses are not subject to random fluctuations. Then the contribution of scattering from the interface is reinforced and can often be observed as fringes in the diffraction pattern. These are termed thickness fringes. The spectra show that the InGaN layers have flat surfaces and are of uniform thickness. The peaks of maximum intensity are the GaN (002) peaks, and the InGaN layer peaks of T-A and T-B are at 2θ = 34.15° and 33.81°, respectively.
(0002) reflection HRXRD ω–2θ scans measured from InGaN layers. The In compositions were 8 and 14% for (a) T-A and (b) T-B, respectively.

The lattice parameters can be calculated using Bragg's law, and data from the measured HRXRD spectra can be used to determine the In compositions. Any variation in composition is assumed to be linear, as in Vegard's law Reference Galindo, Kret, Sanchez, Laval, Yanez, Pizarro, Guerrero, Ben and Molina14 :
 $$c_{{\rm{InGaN}}} = xc_{{\rm{InN}}} + \left( {1 - x} \right)c_{{\rm{GaN}}} \quad .$$
The variable x can be determined from:
 $$x = {{\left( {c_0 - c_{{\rm{GaN}}} } \right)} \over {\left( {c_{{\rm{InN}}} - c_{{\rm{GaN}}} } \right)}}\quad .$$
This assumption may result in errors in calculation of the composition when the InGaN layers have a lattice strain with smaller thickness than the critical thickness. Reference Pereira, Correia, Pereira, O’Donnell, Alves, Sequeira and Franco18,Reference Srinivasan, Liu, Bertram, Ponce, Tanaka, Omiya and Nakagawa19 In this case, the layer will be pseudomorphic, and it is assumed that a InGaN = a GaN and c InGaN > c GaN.
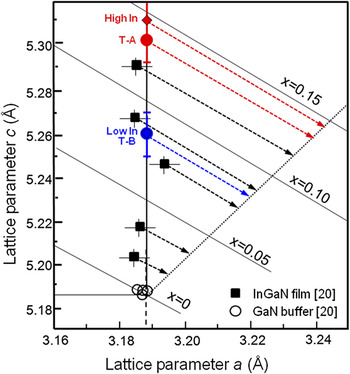
Figure 2 shows a plot of the c-versus a-lattice parameters for InGaN layers of 30 nm thick. The filled squares and open circles indicated parameters as determined by HRXRD for InGaN layers with different In compositions x and GaN layers from Ref. Reference Wagner, Ramakrishnan, Behr, Maier, Herres, Kunzer, Obloh and Bachem20, respectively. The InGaN layers are strained pseudomorphically to the in-plane lattice parameter of the GaN layer as confirmed by HRXRD. The unit cell is distorted in the biaxially strained wurtzite structure, InGaN/GaN. To differentiate between the effects of strain and composition on c InGaN, both lattice parameters a InGaN and c InGaN, must be measured. Then, x can be determined from Hooke's law Reference Pereira, Correia, Monteiro, Pereira, Alves, Sequeira and Franco21,Reference Pereira, Correia, Monteiro, Pereira, Soares and Alves22 :
 $$\left\{ {c_{{\rm{InGaN}}} - c_0 \left( x \right) + 2{{c_{13} \left( x \right)c_0 \left( x \right)} \over {c_{33} \left( x \right)a_0 \left( x \right)}}\left[ {a_{{\rm{InGaN}}} - a_0 \left( x \right)} \right]} \right\} = 0\quad ,$$
where the subscripts 0 and InGaN are the relaxed and measured lattice parameters, respectively, and c ij (x) is the linearly interpolated elastic constant from the binary semiconductors. The variable x can be determined from Eq. (3). Linear interpolations between the c- and a-lattice parameters of unstrained GaN and InN yield the composition-dependent lattice parameters of the unstrained InGaN (indicated in Fig. 2 by the dotted lines). The effect of biaxial strain on c and a is indicated by dashed lines for In compositions of x = 0, 0.05, 0.10, and 0.15. To confirm the reliability of the calculated In compositions of the strained InGaN layers, the lattice parameters measured by HRXRD in Ref. Reference Wagner, Ramakrishnan, Behr, Maier, Herres, Kunzer, Obloh and Bachem20 were projected parallel to the dashed lines onto the c-versus a-curve for unstrained InGaN, as indicated by the dashed arrow lines. The thicknesses of T-A and T-B as determined from TEM measurements were 35.4 and 37.8 nm, respectively, indicating that these layers are strained. Reference O’Donnell, Mosselmans, Martin, Pereira and White23 The c-lattice parameters of T-A and T-B as determined from HRXRD spectra were 5.247 and 5.299 Å, respectively, and the simulated In compositions were 8.0 and 14.0%. RBS was used for confirmation of the quantitative compositional analysis, and results indicate that the In compositions of T-A and T-B were 8.0 and 14.4%, respectively. These values agree well with the results from the HRXRD simulation. When the lattice parameters from Fig. 2 are applied, the In compositions are found to be ∼7.5 and ∼14% for T-A and T-B, respectively. Again, these results are similar to those from the HRXRD simulation and RBS. The In composition, can therefore, be determined accurately by measuring the c-lattice parameter.
c-lattice versus a-lattice parameters as determined by HRXRD for 30 nm-thick InGaN layers (filled squares) with different In compositions x and GaN layers (open circles). For comparison, c-lattice and a-lattice parameters as observed by HRTEM for T-A, T-B (filled circles) and high-In region, low-In region in MQWs (filled diamonds) are also shown, respectively.

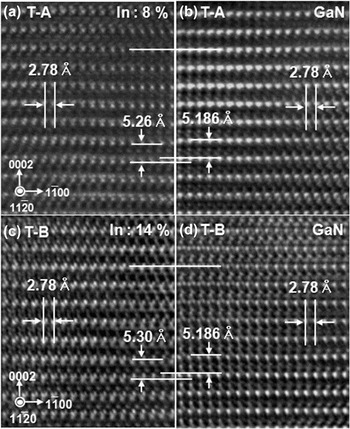
HRTEM technique is the most powerful method available for the direct observation of atomic structure and is, therefore, usually used to determine lattice parameters. Reference Niermann, Park and Lehmann24 However, when the thickness of HRTEM specimen is too thin, the elastic relaxation of strained structures can occur along the electron beam direction. Reference Pretorius, Müller, Yamaguchi, Kröger, Hommel and Rosenauer25 Hüe et al. reported that a 30 nm thickness TEM specimen is not sensitive in thin film relaxation induced by electron beam. Reference Hüe, Hÿtch, Hartmann, Bogumilowicz and Claverie26 Thus, our specimen may not be affected by the relaxation effect because the thickness is ∼50 nm (which is measured by FIB-SEM during TEM specimen preparation). Figure 3 shows HRTEM micrographs of T-A and T-B. The calibration process is necessary for accurate lattice parameter determination. The lattice parameters were determined by measuring the intensity profile of HRTEM images in the Gatan program. The c-lattice parameter in the HRTEM images was calibrated by matching the known lattice parameter of GaN, 5.186 Å, as shown in Figs. 3(b) and 3(d). The a-lattice parameters of the InGaN layers and GaN in Figs. 3(a) and 3(b) were both 2.78 Å, because the layer thicknesses are less than the critical thickness. From the HRTEM images, we measured the six c-lattices spacing of InGaN. Then the c-lattice spacing was through directly comparing the six c-lattices spacing of GaN in the same image. The measuring was repeated several times, and the results were averaged. The measuring accuracy was improved through directly comparing several lattices in the same image taken with in-focus, so we could measure the minute differences of lattice constants. The c-lattice parameters in the InGaN layers were 5.26 and 5.30 Å for T-A and T-B, respectively, and which are shown in Fig. 2 with error bars (±0.01 Å). Using these lattice parameters, the In compositions were found to be ∼8 and ∼14% for T-A and T-B, respectively, from Fig. 2. These values are consistent with the HRXRD and RBS results.
HRTEM images of (a, b) T-A and (c, d) T-B. The c-lattice parameter is 5.26 Å in T-A and 5.3 Å in T-B.

B. Quantitative analysis of In composition of InGaN/GaN MQWs in real LED devices
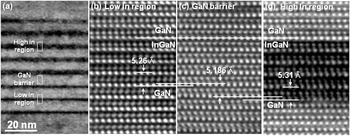
HRXRD is commonly used for InGaN MQW characterization because it is difficult to analyze the composition of thin quantum well layers using other methods. Reference O’Donnell, Mosselmans, Martin, Pereira and White23 The use of HRXRD data for compositional analysis of InGaN/GaN MQWs is difficult because they are composed of complex multilayer structures, such as in real LED devices. It was difficult to obtain an accurate In composition in the high- and low-In regions for our InGaN/GaN MQWs from HRXRD because the spectra were not clear. We, therefore, attempted to determine the In composition of InGaN/GaN MQWs in LED devices through c-plane measurement in HRTEM. Figure 4(a) shows a cross-sectional TEM image of InGaN/GaN MQWs. Figures 4(b)–4(d) show enlarged images of InGaN/GaN MQWs, corresponding to the rectangular regions in Fig. 4(a). To minimize errors, the c-lattice parameters of the GaN region were fixed at 5.186 Å in Fig. 4(c). And then, we measured the five c-lattices spacing of InGaN through directly comparing the five c-lattices spacing of GaN in the same HRTEM image. The a-lattice parameters in Figs. 4(b)–4(d) are identical to those in Fig. 2. The c-lattice parameters were measured to be 5.26 Å in the low-In region [Fig. 4(b)] and 5.31 Å in the high-In region [Fig. 4(d)]. Thus, In compositions were found to be ∼14.5 and ∼8% for the high-In region and low-In region, respectively, when the c-lattice parameters of in Fig. 4 were matched against Fig. 2. The results show that HRTEM can be the useful method for the compositional analysis of InGaN/GaN MQWs in the complex structure.
(a) TEM image of InGaN/GaN MQWs in LED device. (b–d) Enlarged HRTEM micrographs of the low-In region, GaN barrier, and high-In region MQWs. c-lattice parameters are 5.26, 5.186, and 5.31 Å, respectively.

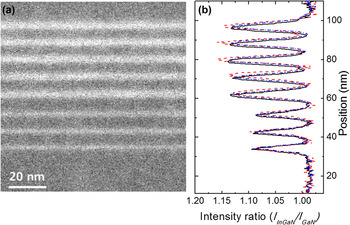
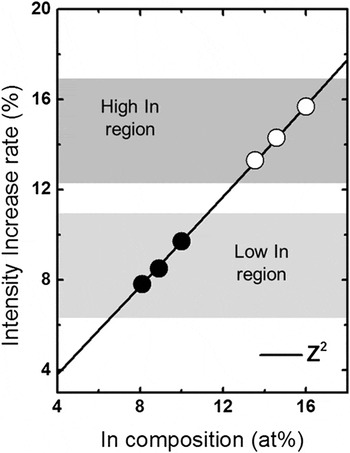
We also conducted HAADF-STEM technique, which allows for the collection of electrons scattered at high angles by specimen nuclei, to form an incoherent image. According to Rutherford scattering, an atom contributes to image intensity in proportion to its atomic number Z raised to the power γ. Reference Pennycook, Berger and Culbertson15 As a first approximation, since the image intensities are proportional to the integral of Z γ (1.6 ≤ γ ≤ 2) along the beam direction, it is possible to discriminate between the intensity levels in the reconstruction between the different elements. Reference Jesson and Pennycook27 For InGaN, the gallium atom positions are occupied by In atoms with large atomic number. Therefore, higher In compositions in the InGaN layers show a brighter contrast in the HAADF-STEM images compared with the lower In compositions. Figures 5(a) and 5(b) show HAADF-STEM micrographs of InGaN/GaN MQWs and HAADF-STEM intensity ratio profiles of InGaN and GaN, respectively. The HAADF-STEM intensity profiles were measured on three times in the same specimen. The contrasts of high- and low-In regions show much difference, and it shows dependence of ADF image contrast on ∼Z 2. However large differences exist in the intensity ratio at each measured images on the same condition. Figure 6 shows the In compositions in the high- and low-In regions from the rate of increase in intensity that was calculated using Z γ, where γ = 2. Reference Pennycook, Berger and Culbertson15 Differences of ∼3% exist when the same exponent is used in Fig. 6.
(a) HAADF-STEM image of InGaN/GaN MQWs and (b) HAADF-STEM intensity ratios of IInGaN/IGaN measured on InGaN/GaN MQWs.

In compositions as determined from the rate of increase in HAADF-STEM intensity with exponent equal to 2 for the low-In region (filled circles) and high-In region (open circles).

The HAADF-STEM intensity can be influenced by various causes, such as electron beam damage, diffusion of In out of the sample during STEM observations, ion beam damage during specimen preparation, etc. Reference Egerton, Li and Malac28 The electron beam current was reduced below the maximum attainable from the microscope and was 35 Acm−2. Reference Smeeton, Kappers, Barnard, Vickers and Humphreys29 This led to In clustering after 220 s, corresponding to a dose per area of 0.08 nC/nm2, but the dose of our experimental was lower than this value. Thus, it is expected that influence of beam damage, such as In clustering, is not substantial in HAADF intensity. However, the background intensity can be increased caused by carbon contamination. This leads to a decrease of the intensity contrast between GaN and InGaN. Reference Rosenauer, Mehrtens, Müller, Gries, Schowalter, Satyam, Bley, Tessarek, Hommel, Sebald, Seyfried, Gutowski, Avramescu, Engl and Lutgen30 Also contrast variation can correspond to surface damage caused by ion-milling in the FIB preparation. Reference Baloch, Johnston-Peck, Kisslinger, Stach and Gradečak31 These results suggest that a quantitative evaluation of In composition is difficult, whereas a relative comparison is possible using the HAADF-STEM intensity.
IV. CONCLUSION
We determined the quantitative composition of In in InGaN/GaN MQWs by using HRTEM and HAADF-STEM techniques. The In compositions of the InGaN layers in the test samples (T-A and T-B) were found to be ∼8.0 and ∼14.0%, respectively, from HRXRD; the results were confirmed by RBS. The quantitative In compositions in T-A and T-B were determined from TEM, and the results are similar to those from HRXRD and RBS. Quantitative In compositions can, therefore, be determined reliably using HRTEM technique. The In composition in InGaN/GaN MQWs of a real LED device was determined using HRTEM and were found to be ∼14.5 and ∼8.0% for the high-In and low-In regions, respectively. The HAADF-STEM study showed relative composition differences because the quantitative In composition could not be determined because of problems, such as differences in specimen thickness, carbon contamination, and ion beam damage during specimen preparation.
ACKNOWLEDGMENTS
This research was supported by the Technology Innovation Program, 10048393, Core Technology Development of the Measurement and Analysis Techniques for the Promotion of Nanotechnology Commercialization funded by the Ministry of Trade, Industry & Energy (MOTIE, Korea).