CVD represent the leading cause of death worldwide and one-third of global mortality(1). Since the risk factors for these diseases are multifactorial, improving their prevention is a challenge for public health. Diet, in turn, is an important modifiable risk factor and one of the key elements that can and should be adjusted, making it a fundamental aspect of managing CVD(Reference Trébuchet, Julia and Fézeu2).
Several dietary patterns that reduce CVD risks and improve overall health have been studied in recent decades and all emphasise high diet quality. Currently, this term has been used to quantify the overall healthiness of a dietary pattern based on its constituents and is in line with the understanding that totality has a greater effect on health outcomes than individual dietary components(Reference Trébuchet, Julia and Fézeu2–4). Although different diet patterns have their advantages and limitations, the main objective of nutritional indices is to combine a large amount of information into a single indicator that is useful and capable of evaluating the relationship between the main protective or risk factors related to the development of diseases(Reference Alkerwi, Vernier and Crichton5).
CVD is closely associated with unhealthy eating habits, which can influence inflammation, oxidative stress and redox signaling, all of which are fundamental components of atherosclerosis and vascular endothelial dysfunction(Reference Steven, Frenis, Oelze and Kalinovic6,Reference Ginckels and Holvoet7) . It is widely accepted that diet plays a crucial role in modulating systemic inflammation and oxidative stress, either through the pro- or anti-inflammatory and oxidative properties of specific dietary patterns(Reference Zhang, Jia and Lai8–Reference El Hadri, Smith and Duplus10). Therefore, measuring the levels of these components is likely to be valuable for predicting, preventing and managing CVD.
In this context, dietary scores were developed to evaluate adherence to different recommendations in the population, such as the Dietary Inflammatory Index (DII)(Reference Shivappa, Steck and Hurley11), whose objective is to classify diets as more anti-inflammatory or pro-inflammatory based on food consumption data and the dietary total antioxidant capacity (dTAC)(Reference Carlsen, Halvorsen and Holte12). Furthermore, other essential recommendations include increased consumption of plant-based foods with fibre-rich complex carbohydrates collectively defined as ‘healthy’ or ‘healthier’ with respect to CVD prevention(Reference Nestel and Mori13). In this sense, the overall plant-based diet index (PDI), the healthy plant-based diet index (hPDI) and the unhealthy plant-based diet index (uPDI) were developed to understand how gradual reductions in animal food intake with concomitant increases in consumption of plant foods improved health outcomes(Reference Satija, Bhupathiraju and Spiegelman14,Reference Satija, Bhupathiraju and Rimm15) . Finally, the Alternative Healthy Eating Index (AHEI) was proposed to better explain the association between nutrition and chronic diseases, especially CVD(Reference McCullough, Feskanich and Stampfer16).
Until now, only one study(Reference Dehghan, Mente and Teo17) has evaluated the incidence and mortality of CVD in individuals receiving secondary cardiology care using a specific dietary quality index. Dehghan et al. (2012)(Reference Dehghan, Mente and Teo17) demonstrated that patients in the healthier quintiles of the modified AHEI (mAHEI) scores had a significantly lower risk of CVD compared to those in the lowest quintile.
Furthermore, it remains unclear to what extent consuming a high-quality diet can prevent new cardiovascular (CV) events in individuals with a prior history of CVD. Since multiple factors contribute to the management of CVD, evaluating various dietary indices each with its own specific focus, may help clarify the role of diet in managing this disease. To our knowledge, no studies have compared six different indices, and most have relied on a single measurement of diet, which limits their ability to evaluate changes in diet quality (whether for better or worse) and its subsequent relationship with the incidence of CV events.
Therefore, we conducted this study to explore the association between changes in diet quality, as measured by the DII, dTAC, PDI, hPDI, uPDI and mAHEI, and the incidence of CV events over 4 years of follow-up in participants of the Brazilian Cardioprotective Nutritional Program Trial (BALANCE Program Trial), all of whom were receiving secondary cardiology care.
Methods
BALANCE program trial
The ‘Brazilian Cardioprotective Nutritional Program Trial (BALANCE Program Trial)’ is a multicentre prospective and randomised controlled trial conducted in Brazil with a 4-year follow-up and registered with ClinicalTrials.gov (number: NCT01620398). The design, methods and objectives of the BALANCE Program Trial have been reported previously(Reference Weber, Bersch-Ferreira and Torreglosa18).
The BALANCE Program Trial was developed to increase the consumption of foods with potential cardioprotective properties available and accessible in Brazil and to be a nutritional education tool accessible to the population. The key point of the program is to achieve a balance among foods in the diet to ensure the correct proportions of all nutrients recommended for the dietary management of CVD(Reference Weber, Bersch-Ferreira and Torreglosa18).
The inclusion criteria were patients in secondary prevention of CVD ages 45 years or older who experienced one or more of the following indicators of established CVD in the previous 10 years:
1) Coronary artery disease (CAD)
-
– Asymptomatic: stable or unstable angina (clinical diagnosis including diagnosis without complementary tests or history of positive stress test).
-
– Symptomatic: angiography or computed tomography coronary angiography, showing atherosclerotic stenosis ≥ 70 % of the diameter of any coronary artery.
-
– Treated: the presence of angioplasty, stent or revascularisation.
-
– Heart attack: history of myocardial infarction or acute coronary syndrome; history of abnormality in the segmental movement of the cardiac wall on echocardiography or a fixed segmental defect on scintigraphy.
2) Peripheral artery disease (PAD)
-
– Asymptomatic: ankle-to-arm ratio < 0·9 to systolic blood pressure in any resting leg; angiographic or Doppler study showing > 70 % stenosis in a non-cardia artery.
-
– Symptomatic: intermittent claudication.
-
– Treated: vascular surgery for atherosclerotic disease.
-
– Abdominal aortic aneurysm.
-
– Amputation due to arterial disease.
3) Stroke: Presence of a clinical stroke diagnosis or evidence of the previous stroke on computed tomography or MRI
The BALANCE Program Trial also does not include individuals who had neurocognitive or psychiatric conditions that may hinder the collection of reliable clinical data (defined at the investigator’s discretion), life expectancy of fewer than 6 months (e.g. metastatic malignancy or other factors defined at the investigators’ discretion), pregnancy or lactation, liver failure with a history of encephalopathy or anasarca, renal failure with an indication for dialysis, congestive heart failure, previous organ transplantation, wheelchair use or any restrictions to receiving an oral diet. More details about the eligibility criteria are described in the study protocol(Reference Weber, Bersch-Ferreira and Torreglosa18).
Briefly, eligible participants were randomly (allocation ratio 1:1) assigned to one of two diet groups: BALANCE Program (experimental group) or control group. The nutritional counseling for both groups followed guidelines for the treatment of CVD, which, in turn, are guided by the nutritional composition of diets such as the Mediterranean (MedDiet) and Dietary Approaches to Stop Hypertension diets. Participants allocated to the experimental group received a quantitative approach with greater intensity of implementation, while individuals in the control group were encouraged to follow standard advice elaborated by dieticians, i.e. dietary prescriptions were only qualitative(Reference Weber, Bersch-Ferreira and Torreglosa18).
This study was conducted according to the guidelines laid down in the Declaration of Helsinki, and all procedures involving human subjects/patients were approved by the HCor Ethics Committee (document number: 1.171.748) and by the Research Ethics Committee of each participating centre. The study was also carried out in accordance with the ethical principles according to the resolution CSN 466/2012(19), and all participants signed an informed consent form.
Study design and participants
This study was a secondary longitudinal analysis of the BALANCE Program Trial, in which the intervention and control groups were combined.
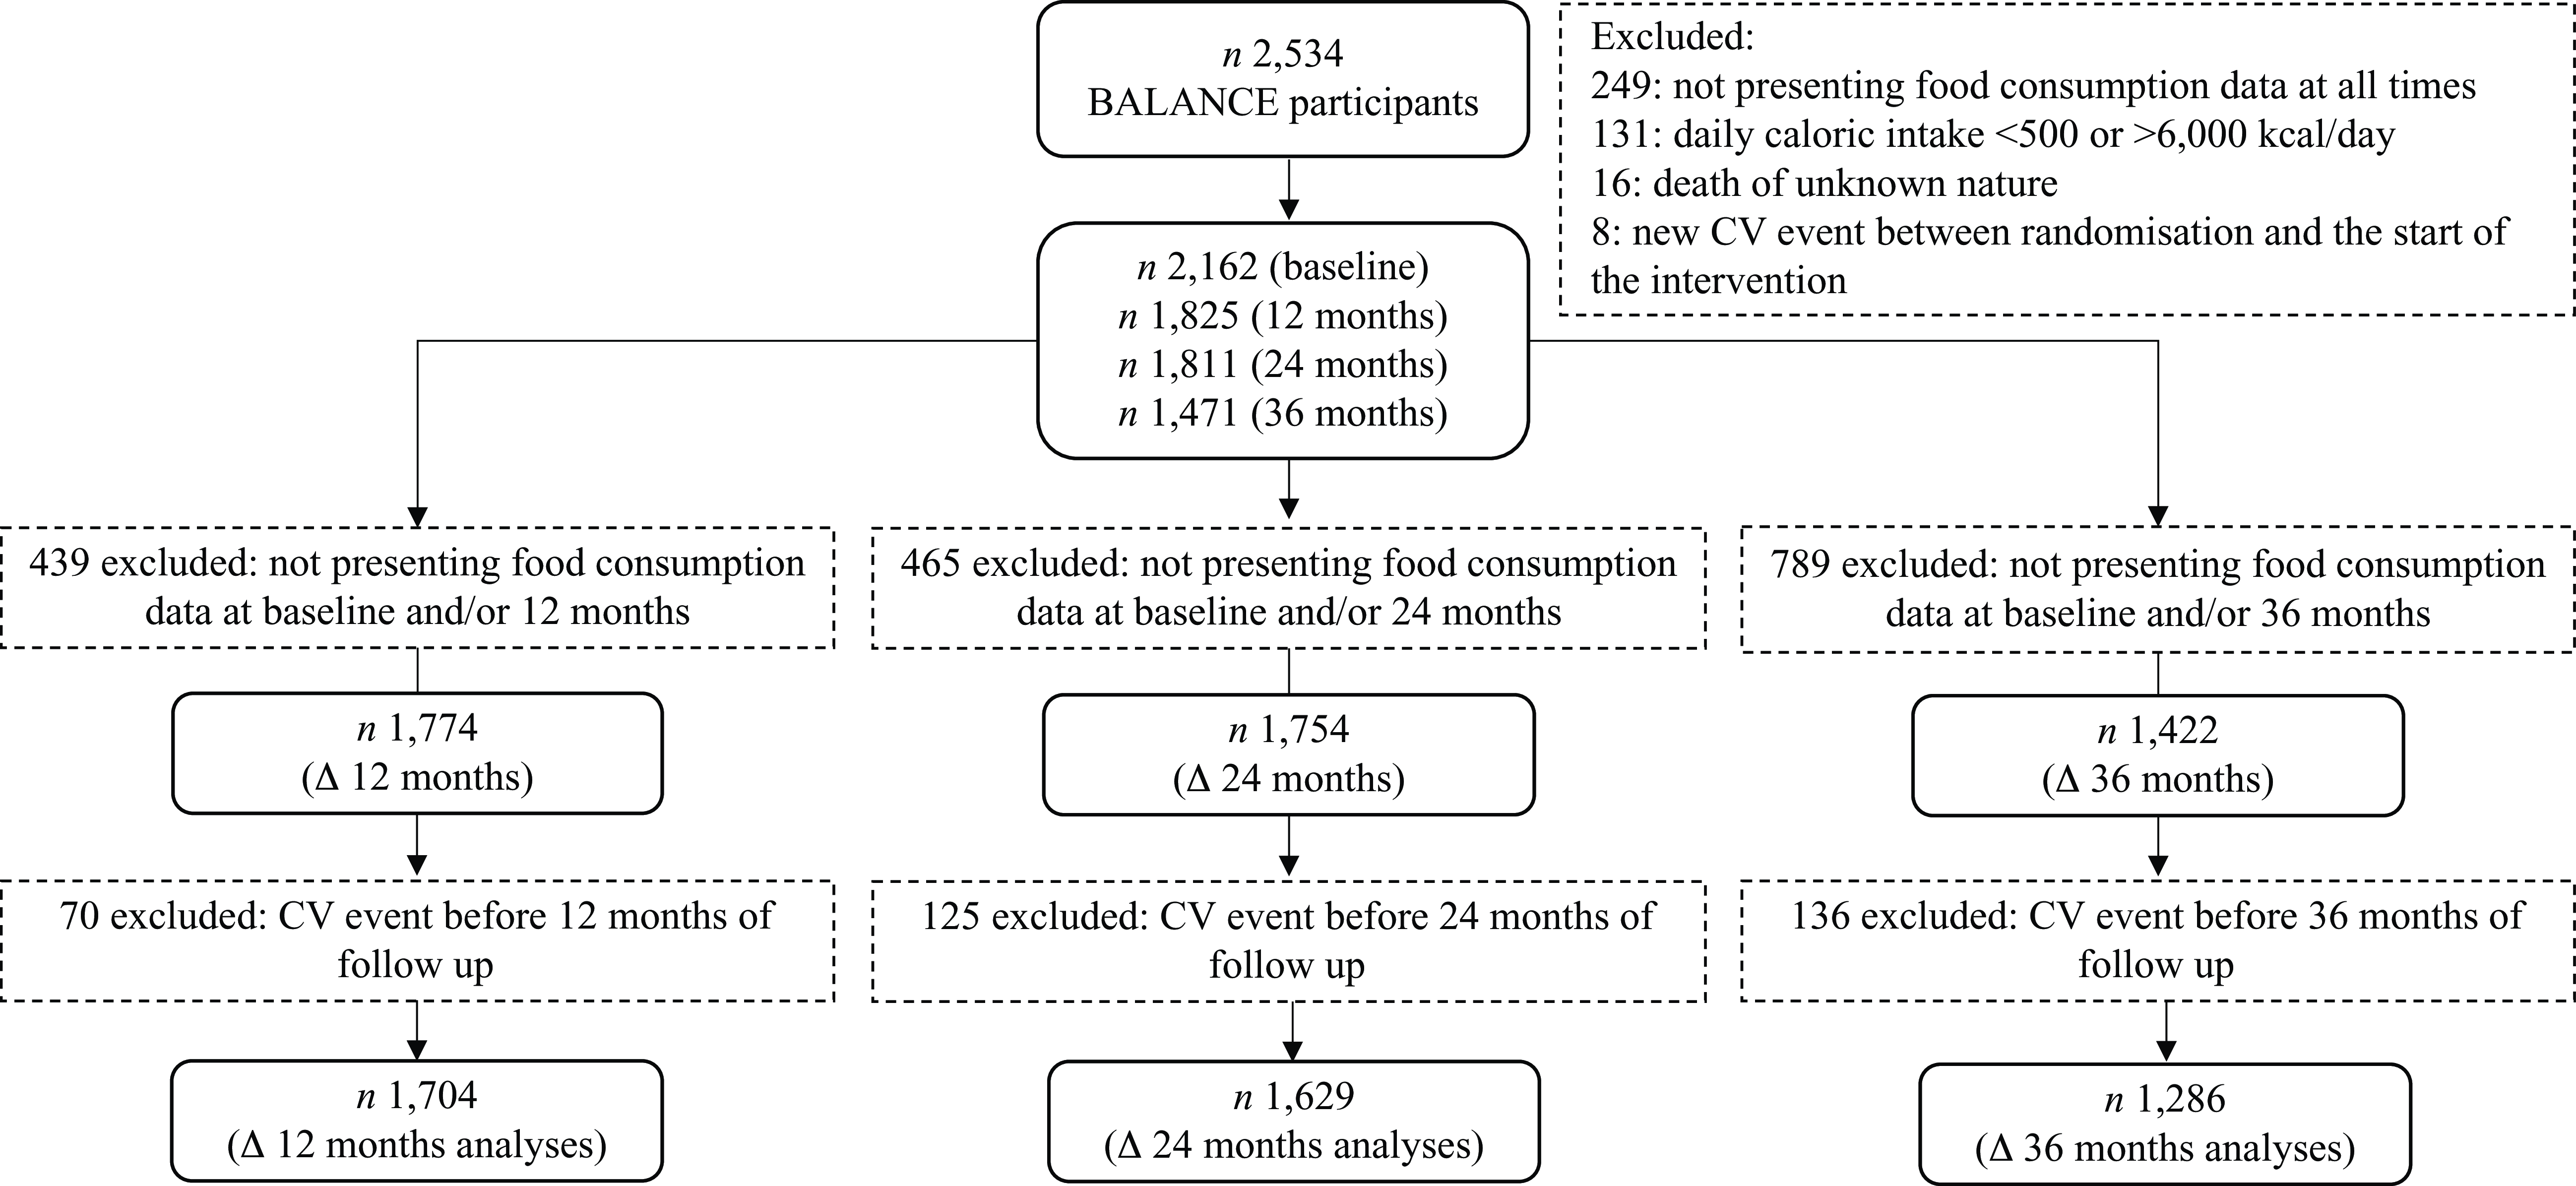
The participants consisted of 1704, 1629 and 1286 (∆12 m, ∆24 m and ∆36 m analyses, respectively) individuals, who presented complete food consumption data at the respective time analysed. Those individuals with an implausible daily caloric intake (< 500 or > 6000 kcal/d)(Reference Andrade, Pereira and Sichieri20), who presented death of unknown nature and/or who presented a new CV event before the start of the intervention (i.e. between the date of recruitment and the start of the intervention), were excluded. Additionally, to ensure the temporality of the associations (i.e. the change in diet preceding the occurrence of the outcome), we excluded participants who had CV events between the start of the intervention until 12, 24 and 36 months of follow-up for ∆12 m, ∆24 and ∆36 analyses, respectively (Figure 1).
Eligibility criteria.

Dietary assessment and calculation of diet quality scores
Food intake was estimated using 24-h dietary recalls (R24h) conducted on any day of the week. The multiple-pass method was employed to standardise the collection of food consumption data and ensure the capture of comprehensive information about the foods consumed(Reference Moshfegh, Rhodes and Baer21).
In the present study, the basal food consumption (initial and/or clinical visit of 15 d) and that of 12 (clinical visit of 12 and/or 15 months), 24 (clinical visit of 21 and/or 24 and/or 27 months) and 36 (clinical visit of 34 and/or 36 and/or 39 months) months were evaluated. If more than one R24h was available during each moment, the mean of two or more was calculated for the analyses. The difference (delta) between the basal food consumption and that after 12, 24 and 36 months of study (exposure variables) was used to assess the changes during the follow-up period.
Diet quality was assessed based on its inflammatory profile using the DII, antioxidant capacity using the dTAC and food consumption associated with CVD risk reduction using the PDI, uPDI, hPDI and mAHEI. The details of score calculations have been reported previously(Reference da Conceição, da Silva and Juvanhol22). Briefly, the DII was calculated by the method proposed by Shivappa et al. (2014)(Reference Shivappa, Steck and Hurley11), and the dTAC was determined by the sum of the ferric reducing antioxidant power values of each food and preparation consumed(Reference Carlsen, Halvorsen and Holte12). For the calculation of the PDI, hPDI, uPDI and mAHEI, the foods were categorised into groups associated with the risk of CVD(Reference Satija, Bhupathiraju and Spiegelman14–Reference McCullough, Feskanich and Stampfer16).
Outcome assessment
The outcome in this study was the occurrence of any of the following CV events for 4 years (48 months) of follow-up: cardiac arrest, acute myocardial infarction, stroke, myocardial revascularisation, amputation for peripheral arterial disease, hospitalisation for unstable angina or CV death.
To ensure accurate reporting of all clinical events, investigators at all trial sites were trained on how to identify primary outcomes. The Clinical Endpoints Committee tracking database was responsible for adjudicating these primary endpoints. All suspected events were independently reviewed by two Clinical Endpoints Committee physicians, and in case of disagreement, a third independent adjudicator made the final decision. Only endpoints confirmed by the Clinical Endpoints Committee were included in the analyses. Detailed definitions of the endpoints and the adjudication process have been published previously(Reference Weber, Bersch-Ferreira and Torreglosa18).
Assessment of other covariates
During a face-to-face interview, participants reported sex, age, smoking, physical activity, use of medications and family and personal history of diseases. The participants were classified in the following categories: men or women; adults or older adults (≥ 60 years); smokers + former smokers, or never smokers; sedentary or not sedentary; lipid-lowering medications, antihypertensives, anticoagulants, or hypoglycemic agents use or non-use; family history of CAD or no history and presence or absence of each CV event as already described.
Participants were considered smokers if they consumed tobacco products on a daily basis. Conversely, participants were classified as former smokers if they had used at least one of the following tobacco products (cigarettes, cigars, pipe, or other smoking products) either occasionally for 3 months or more, or daily for 1 month or more. The physical activity was measured by the International Physical Activity Questionnaire(Reference Matsudo, Araújo and Matsudo23). Participants who reported doing only light-to-moderate housework, walking involved in everyday activities and sitting for several hours were classified as sedentary. Participants were classified as non-sedentary when they were not included in this category.
Additionally, anthropometry data were measured. Body weight was measured twice with calibrated scales (100 g precision) with the participant’s barefoot and wearing light clothes. Height was measured twice with wall-mounted stadiometers (0·5 mm precision), with the participants barefoot in the standing position. The waist circumference was measured twice at the midpoint between the lower border of the costal arch and the iliac crest at the mid-axillary line. The average of these measurements was used. BMI was calculated using the following formula: weight (kg)/(height (m))2, and the waist-to-height ratio (WHtR) was calculated by the ratio between the waist circumference (cm) and the height (cm). Participants were classified as overweight (BMI > 25·00 kg/m2 for adults(24) and BMI > 27·00 kg/m2 for older adults(25) or not; high waist circumference (≥ 94 cm for men and ≥ 80 cm for women(26)) or not and high WHtR (ratio ≥ 0·5(Reference Ashwell and Gibson27)) or not.
Blood samples were collected to analyse biochemical markers after 12–14 h of fasting. Traditional biochemical markers were analysed in the blood samples: low-density lipoprotein cholesterol (LDL-cholesterol) levels were determined using the Friedewald formula; triglycerides (TAG), total cholesterol, high-density lipoprotein cholesterol (HDL-cholesterol) and glucose levels were measured using the enzymatic colorimetric method (VITROS 5600; Johnsons & Johnsons, Raritan, USA). The LDL-cholesterol/HDL-cholesterol ratio was calculated. Subjects were classified as having hypertriglyceridaemia (≥ 150 mg/dl) or not, high total cholesterol (≥ 190 mg/dl) or not, high LDL-cholesterol (≥ 130 mg/dl) or not, low HDL-cholesterol (values < 50 mg/dl for women and < 40 mg/dl for men) or not, high LDL-cholesterol/HDL-cholesterol (ratio ≥ 3·3) or not(Reference Faludi, Izar and Saraiva28) and impaired fasting glucose (≥ 100 mg/dl) or not(29).
Blood pressure was measured according to the recommendations of the American Heart Association(30). Participants with high systolic and diastolic blood pressure (≥ 130 and 85 mmHg, respectively) and/or the use of antihypertensive medication were classified as having systemic arterial hypertension or not(30), and dyslipidaemias (yes or not) were diagnosed when LDL-cholesterol ≥ 130 mg/dl and/or TAG ≥ 150 mg/dl and/or HDL-cholesterol < 40 mg/dl in men and < 50 mg/dl in women and/or use of medication to control dyslipidaemias (statins)(Reference Faludi, Izar and Saraiva28). All covariates were assessed at baseline.
Statistical analysis
The analyses were performed using SPSS® 22.0 and STATA® 13.0 software. The significance level of α = 0·05 was used in all analyses. A χ2 test was used to compare the incidence of CV events between categories of covariates.
The changes in the diet quality through the DII, dTAC, PDI, hPDI, uPDI and mAHEI (∆12 m = value at 12 months – baseline value; ∆24 m = value at 24 months – baseline value; ∆36 m = value at 36 months – baseline value) were used as exposure variables to determine association with the incidence of CV events (outcome variable) during the 4 years (48 months) of follow-up. The variable time until the occurrence of a CV event was defined as the time, in years, between the initial date (first baseline interview) and the date of the event of interest or end of the follow-up, that is, the date of the last contact (censorship).
The Kaplan–Meier curve was used to estimate the survival function during follow-up. The independent association between the changes (∆12, ∆24 and ∆36 m) in the DII, dTAC, PDI, hPDI, uPDI and mAHEI and the incidence of CV events was based on the hazard ratio (HR) estimates and its 95 % CI using Cox’s proportional hazards models. After a crude analysis, we fitted a model adjusted for sex, age, group (intervention v. control), smoking, Δ energy intake (except for analyses related to the DII, as this index is already adjusted during its calculation), Δ physical activity (stopped being sedentary or not) and Δ medication (stopped using at least 1 type of medication such as statins, antihypertensive, anticoagulant and lowering glucose drugs or not). For each time analySed (∆12, ∆24 and ∆36 m), the specific delta of the confounding variables was calculated. In a subsequent model, we additionally adjusted for values of the diet quality indices at baseline. The adjustments were selected based on the literature: age(Reference Costantino, Paneni and Cosentino31), sex(Reference Shufelt, Pacheco and Tweet32), physical activity(Reference Lavie, Ozemek and Carbone33), smoking status(Reference Kondo, Nakano and Adachi34) and medication use(Reference Nicolau, Feitosa Filho and Petriz35).
Using the fully adjusted models, we also tested for multiplicative interaction between the diet quality indices and group (intervention v. control) to evaluate for statistically significant group differences in the associations. The assessment of the proportionality of risk over time was based on the Schoenfeld residuals plot, and in the hypothesis test, the non-rejection of the null hypothesis (P > 0·05) indicates the proportionality of risk over time.
Results
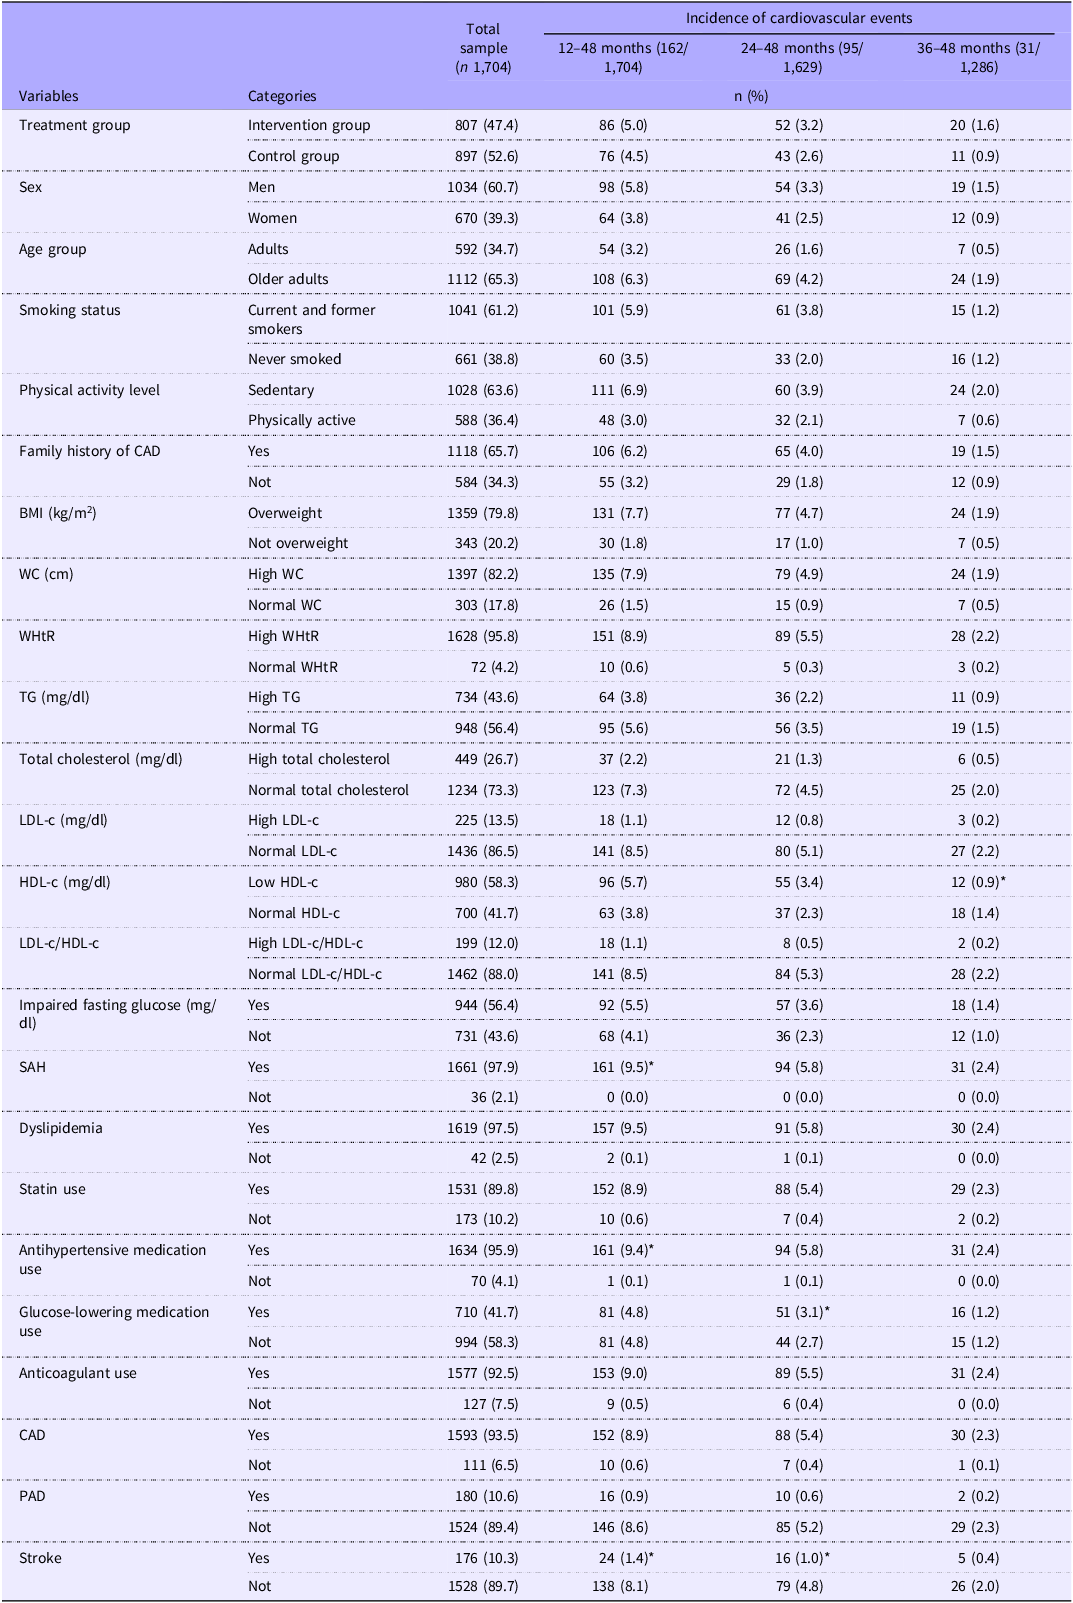
At baseline (n 1704), 60·7 % of the participants were male and 65·3 % were older adults with a mean age of 63·25 ± 8·95 years. Furthermore, we observed that most of study participants had some of the main classic CV risk factors, such as smoking (61·2 %), physical inactivity (63·6 %), overweight (79·8 %), high WC (82·2 %) and WHtR (95·8 %), low HDL-cholestrol (58·3 %), impaired fasting glucose (56·4 %), systemic arterial hypertension (97·9 %) and dyslipidaemia (97·5 %). More than 65 % reported having a CAD family history, consistent with the observed prevalence of CAD (93·5 %) (Table 1).
Incidence of cardiovascular events according to the baseline characteristics of study participants, BALANCE Program Trial (2013-2017)

Abbreviations: CAD, coronary arterial disease; BMI, body mass index; WC, waist circumference; WHtR, waist-to-height ratio; TG, triglycerides; LDL-c, low-density lipoprotein cholesterol; HDL-c, high-density lipoprotein cholesterol; SAH, systemic arterial hypertension; PAD, peripheral arterial disease. Values are numbers (percentages). Asterisks indicate statistically significant differences according to χ2 test (P < 0·05).
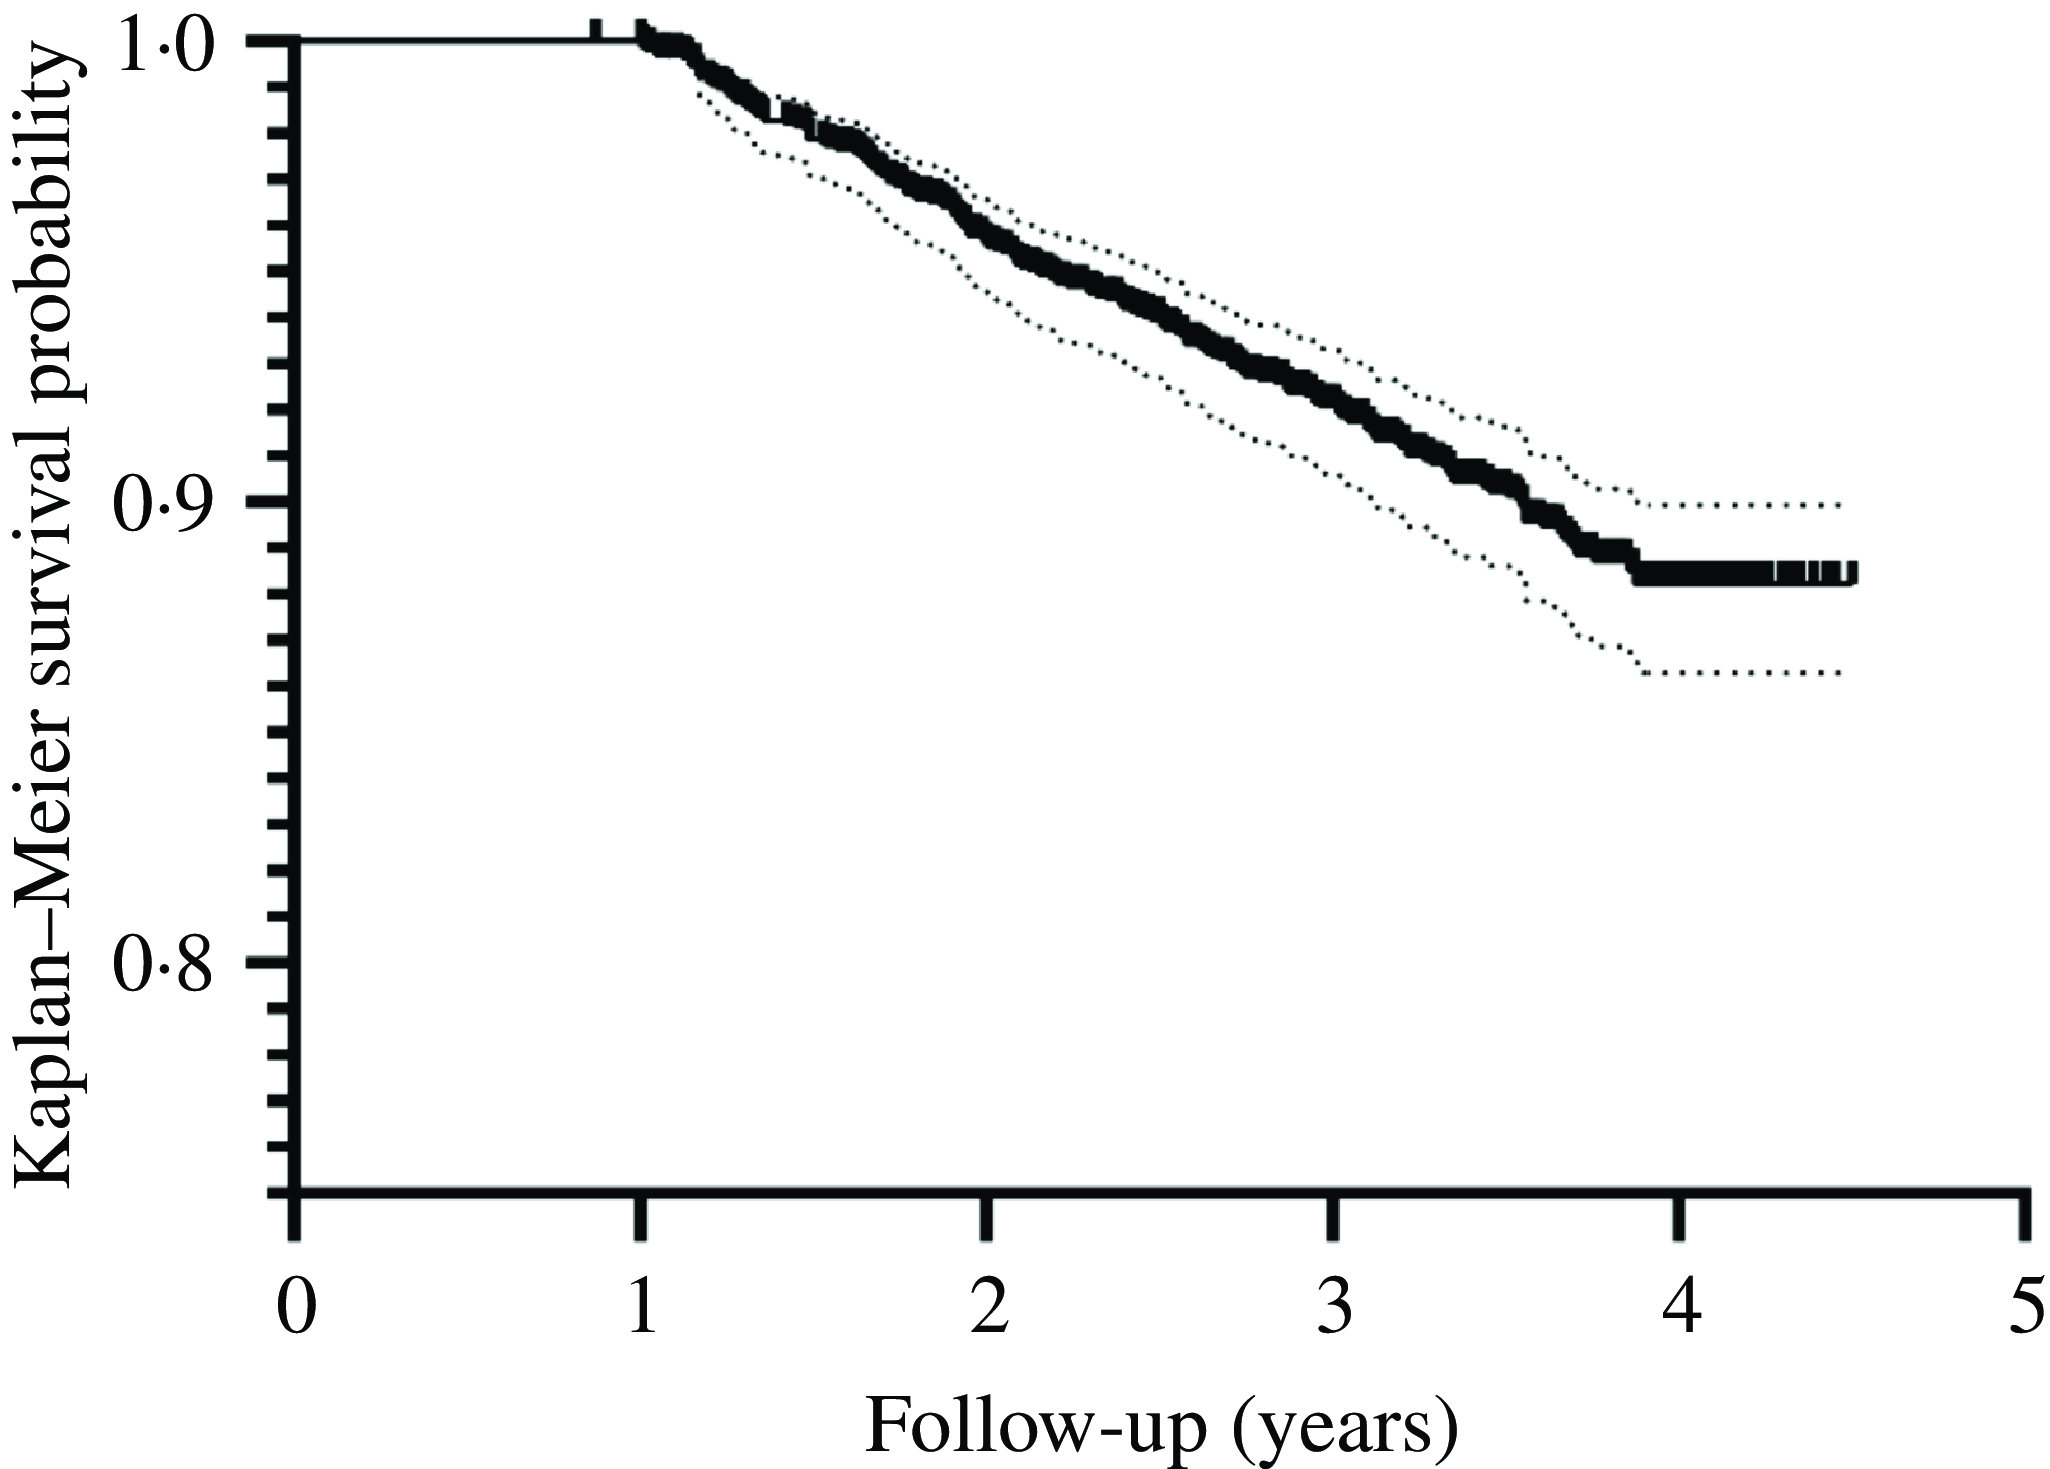
After a median of 3·25 years of follow-up (minimum 0·86 years and maximum 4·50 years), the incidence of CV events in Δ 0–12 m analyses was 9·5 % (n 162; 55·48 per 100 person-years), Δ 0–24 m was 5·8 % (n 95; 54·89 per 100 person-years) and Δ 0–36 m was 2·4 % (n 31; 45·71 per 100 person-years). The overall survival curve shows that with increasing years of follow-up, CV event-free survival showed a constant reduction (Figure 2).
Overall survival curve of study participants in 12–48 m interval (n 1704). BALANCE Program Trial (2013–2017). Endpoints were cardiovascular events.

The incidence of CV events according to the baseline characteristics of the study participants is also summarised in Table 1. We observed that the incidence of CV events was significantly higher in people with systemic arterial hypertension (9·5 % v. 0·0 %; 12–48 m interval) and users of antihypertensive drugs (9·4 % v. 0·1 %; 12–48 m interval) and lowering glucose drugs (3·1 % v. 2·7 %; 24–48 m interval). On the other hand, the incidence was lower in individuals who have low HDL-cholesterol (0·9 % v. 1·4 %; 36–48 m interval) and who had previous diagnosis of stroke (1·4 % v. 8·1 %; 12–48 m interval and 1·0 % v. 4·8 %; 24–48 m interval) (Table 1).
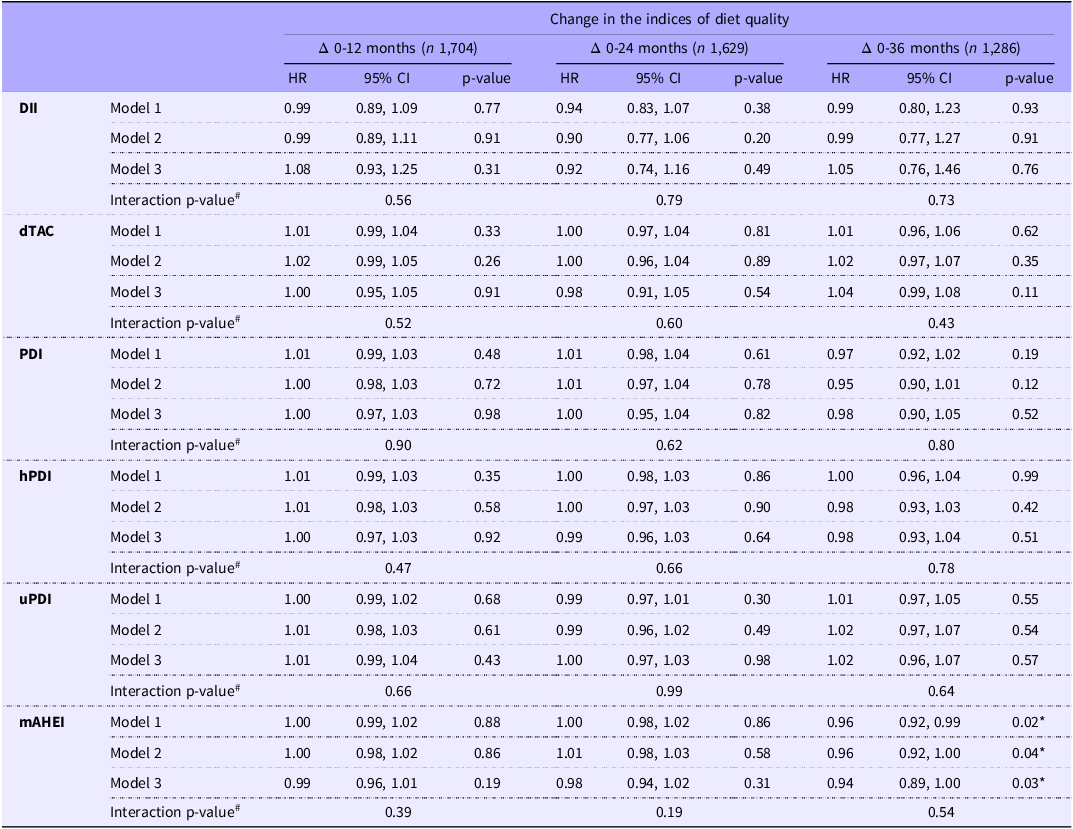
Finally, the results of the Cox’s proportional hazards models for the association between diet quality indices and incidence of CV events are shown in Table 2. We observed that after 3 years of follow-up (Δ 0–36 m analyses), changes in mAHEI were negatively associated with incidence of CV events in the crude model (HR: 0·96, 95 % CI: 0·92, 0·99, P = 0·02), and even after adjustment for sex, age, group, smoking, energy intake, physical activity and medication (model 2 – HR: 0·96, 95 % CI: 0·92, 1·00, P = 0·04). A significant negative association was also observed in model 3 with adjustment from model 2 + values of the mAHEI at baseline (model 3 – HR: 0·94, 95 % CI: 0·89, 1·00, P = 0·03), indicating that the incidence of CV events is reduced when there is an increase at mAHEI scores. Interaction tests did not show significant differences in associations between diet quality indices and incidence of CV events by group (intervention v. control). Thus, the results are presented for the total sample, with the intervention and control groups combined. The assessment of the Schoenfeld residuals plot indicated proportionality of risk over time (data not shown).
Hazard ratios (95% confidence interval) for the association between diet quality indices and incidence of cardiovascular events in participants of the BALANCE Program Trial, 2013-2017

DII, Dietary Inflammatory Index; dTAC, Dietary Total Antioxidant Capacity; PDI, overall Plant-Based Diet Index; hPDI, Healthy Plant-Based Diet Index; uPDI, Unhealthy Plant-Based Diet Index; mAHEI, modified Alternative Healthy Eating Index; HR, hazard ratio; 95% CI, 95% confidence interval.
Asterisks indicate statistical differences according to Cox’s proportional hazards models (p < 0.05).
Model 1: Crude model.
Model 2: Adjusted for sex, age, study group, smoking status, changes in energy intake (except for DII analyses, as the index is energy-adjusted by design), changes in physical activity (became physically active vs. remained sedentary), and changes in medication use (discontinued at least one medication, including statins, antihypertensives, anticoagulants, or glucose-lowering drugs).
Model 3: Model 2 + baseline values of the diet quality indices.
# Interaction p-value refers to the multiplicative interaction between diet quality indices and study group (intervention vs. control).
Discussion
The current study reports a secondary analysis of a multicentre and randomised controlled trial conducted in Brazil for 4 years with secondary care cardiology patients. We investigated the associations between the changes in the BALANCE Program Trial diet quality through six a priori diet quality indices (DII, dTAC, PDI, hPDI, uPDI and mAHEI) and the incidence of CV events during all follow-ups.
The main finding of this study was that improved mAHEI scores were associated with a lower CVD incidence after 3 years (Δ 0–36 m analysis) in the crude and adjusted models. This result suggests that dietary changes may need to be sustained for a longer period in order to observe their effects on CV health. This has significant implications for public health, as future nutritional policies and public health initiatives aimed at reducing CVD morbidity and mortality should take diet quality into account.
Unexpectedly, no associations were observed with the other dietary scores across all groups and time points analysed. Prospective cohort studies and systematic reviews with meta-analysis have also shown that higher diet quality, assessed by DII(Reference O’Neil, Shivappa and Jacka36–Reference Brlek and Gregorič39), dTAC(Reference Parohan, Anjom-Shoae and Nasiri40), PDI, hPDI and uPDI(Reference Jarvis, Tinajero and Khan41–Reference Jafari, Hezaveh and Jalilpiran44) and mAHEI(Reference Brlek and Gregorič39,Reference Schwingshackl, Bogensberger and Hoffmann45,Reference Morze, Danielewicz and Hoffmann46) , is associated with lower CVD incidence or mortality. According to Brlek and Gregorič (2022)(Reference Brlek and Gregorič39), the DII and AHEI can be used as valid tools for assessing diet quality in the adult population and/or as predictors of the revised health outcomes. However, these studies were conducted in individuals without CVD at baseline, and although adherence to multiple diet quality scores was associated with lower CVD incidence and mortality, most studies relied on a single dietary measurement and were therefore unable to assess changes in diet quality and their subsequent impact on CVD risk.
BADEN et al. (2019)(Reference Baden, Liu and Satija47) demonstrated that improving the quality of a plant-based diet over a 12-year period was associated with a subsequent lower risk of death. A 10-point increase in the hPDI over this period was linked to a 10 % lower risk of total mortality and a 9 % lower risk of CVD mortality, while a 10-point increase in the uPDI was associated with a 9 % higher risk of total mortality and an 8 % higher risk of CVD mortality(Reference Baden, Liu and Satija47). The discrepancies observed between studies may be due to differences in the quality of plant foods.
Possibly, only the results found in relation to the mAHEI were significant since this index was designed primarily to target dietary choices associated with reducing the risk of chronic diseases and includes additional protective factors related to the development of CVD, such as items that reduce homocysteine concentrations, LDL-cholesterol oxidation and platelet aggregation, and improve the proportion of total cholesterol to HDL-cholesterol. The mAHEI was developed in an attempt to improve the original Healthy Eating Index (HEI), which is used worldwide(Reference McCullough, Feskanich and Stampfer16).
In general, the mAHEI assigns higher scores to higher intakes of fruits, vegetables, nuts and soya protein, whole grains and polyunsaturated fat including long-chain fatty acids (n-3)(Reference Chiuve, Fung and Rimm48). Furthermore, moderate alcohol intake and abstaining or reducing intake of sugar-sweetened beverages and fruit juices, red and processed meats, trans fats and Na contribute to the fact that, together, a healthy diet is associated with lower mortality(Reference Chiuve, Fung and Rimm48). Therefore, all components of AHEI are expected to have protective roles against CVD(Reference McCullough, Feskanich and Stampfer16).
Our results were consistent with a study that reported inverse associations between a higher-quality diet with a lower risk of recurrent CV events among people ≥ 55 years of age with CVD or diabetes mellitus(Reference Dehghan, Mente and Teo17). Dehghan et al. (2012)(Reference Dehghan, Mente and Teo17) demonstrated in a prospective cohort study with 31 546 individuals over 56 months that patients in the healthier quintiles of mAHEI scores had a significantly lower risk of CVD (HR: 0·78; CI 95 %: 0·71, 0·87) v. lowest quintile. The reductions in risk for CV death, myocardial infarction and stroke were 35 %, 14 % and 19 %, respectively. The protective association was consistent regardless of whether patients received proven drugs(Reference Dehghan, Mente and Teo17).
Despite the lack of a significant association between change in diet quality assessed by the other indices (DII, dTAC, hPDI and uPDI) and CVD incidence in the present study, possibly due to the follow-up time, recommending improvement in overall diet quality is still important. Furthermore, we previously demonstrated that the BALANCE Program Trial was able to modulate some of the main dietary quality indices, with the intervention group showing better results than the control group(Reference da Conceição, da Silva and Juvanhol22). Also, the changes in diet quality through the lower DII and uPDI and higher dTAC, PDI, hPDI and mAHEI impact the improvement of cardiometabolic risk factors in patients with established CVD during 48 months of follow-up. This result reinforces that other lifestyle modification strategies such as regular exercise, smoking cessation, weight control and management of mental disorders must be incorporated, preferably through multidisciplinary teams, to improve CV outcomes.
We also observed that CV event-free survival showed a constant reduction according to the overall survival curve. Although advances in medical care, pharmacological treatments and CVD prevention measures improve survival after the initial event, people with established CAD have an elevated risk of subsequent CV events, such as myocardial infarction and stroke(Reference Gupta, Joseph, Rosengren, Fuster, Vaishnava, Leon, Callans, Rumsfeld and Poppas49). Furthermore, each of these individual events is associated with a three- to fourfold increase in the subsequent risk of death, including sudden cardiac death in patients with heart failure with reduced ejection fraction(Reference Kristensen, Jhund and Køber50).
Previously, Weber et al. (2019)(Reference Weber, Bersch-Ferreira and Torreglosa51) failed to demonstrate the implementation of the BALANCE Program effect on CV events and death after a median of 3·5 years of follow-up between intervention and control groups. In this study, we evaluated whether different dietary patterns, as measured by various diet quality indices, could impact the incidence of CV events differently, regardless of group, since interaction tests did not show significant differences in the associations between diet quality indices and CV event incidence across the intervention and control groups.
Cross-sectional studies conducted by our research group demonstrated that, at baseline, patients with established CDV events in the third tertile of DII (DII > 0·91) were more likely to have 2 (odds ratio 1·27, 95 % CI: 1·01–1·61) and ≥ 3 (odds ratio 1·39, 95 % CI: 1·07, 1·79) CV events, with poor cardiometabolic profile(Reference da Silva, Felício and Caldas52). Regarding dTAC, the mean dTAC was equal to 5·6 (interquartile range, 3·9–7·8) mmol/1000 kcal, and participants in the third dTAC tertile (9·2 mmol/1000 kcal) had 59% and 69% lower odd, respectively, of having abdominal aortic aneurysm and amputation due to arterial disease in comparison to the first tertile (3·4 mmol/1000 kcal)(Reference da Silva, Caldas and Pinto53).
Finally, our study has some major strengths. First, the sample profile as they are less studied individuals, despite it being well recognised that patients with previous CVD are at high risk of recurrence of CV events. Also, the length, the design and the number of patients in the study were challenging, and even more so in a high-intensity dietary intervention. Therefore, our results provide a direction that a healthy diet is one of the pillars that can help reduce the high CV recurrence of these patients, especially in the long term. Also, we evaluated the change in food consumption over the years, not just the initial consumption associated with the outcomes.
Furthermore, we adjusted the analysis not only for initial and changes in covariates but also for initial diet scores since a central issue in examining changes in diet quality and subsequent incidence of a disease is to adequately control for simultaneous changes in other behaviors (such as changes in physical activity and smoking) and initial diet quality. Finally, the BALANCE Program Trial is a multicentre study carried out in all Brazilian regions.
Nevertheless, the study also has its limitations. Alcohol consumption was not included in the analyses, as a form to collect alcohol consumption data was introduced only after the study had already begun. Consequently, we cannot rule out the possibility of residual confounding. Dietary intake was assessed exclusively through validated R24h, which, while considered reliable(Reference Willett54), reflects current intake over time rather than habitual intake. Furthermore, the R24h method is susceptible to recall bias, particularly among older individuals, as well as day-to-day variability in dietary intake. Additionally, the study focused on individuals with established coronary disease, so the generalisability of our findings to other patient groups should be approached with caution. However, these patients represent a population in which dietary changes have been shown to have a significant impact on health outcomes.
Conclusion
In summary, our data demonstrated that improving mAHEI scores was associated with a lower CVD incidence after 3 years in a prospective cohort of Brazilians in secondary cardiology care. That is, dietary changes may need to be maintained for a longer period before their benefits on CV health become evident. This study provides additional, essential and unprecedented data on the analysis of diet quality. To date, no longitudinal study has evaluated the association between various quality assessment indices and the incidence of CV events in individuals undergoing secondary prevention for CVD. More studies are needed, especially in this specific population, over a long period of follow-up, to guide public health strategies aimed at this population.
Acknowledgements
We thank all the patients for participating in this project and all participating centres: Cristiane Kovacs – Instituto Dante Pazzanese de Cardiologia, São Paulo-SP. Annie S B Moreira – Hospital Universitário Pedro Ernesto, Rio de Janeiro-RJ e Instituto Nacional de Cardiologia, Rio de Janeiro-RJ. Rosileide S Torres – Hospital das Clínicas Gaspar Vianna, Belém-PA. Helyde A Marinho – Instituto Nacional de Pesquisas da Amazônia, Manaus-AM. Cristina H de Matos – Universidade Vale do Itajaí, Itajaí-SC. Renata T A Bertacco – Universidade Federal de Pelotas, Pelotas-RS. Gabriela C Souza – Hospital de Clínicas de Porto Alegre, Porto Alegre-RS. Gabriela S Shirmann – Universidade da Região da Campanha, Bagé-RS. Francisca E Z Nagano – Hospital de Clínicas da Universidade Federal do Paraná, Curitiba-PR. Maria E M Ramos – Hospital Universitário Associação Educadora São Carlos, Canoas-RS. Soraia Poloni – Instituto de Cardiologia do Rio Grande do Sul, Porto Alegre-RS. Raquel M El Kik – Hospital São Lucas da Pontifícia Universidade Católica do Rio Grande do Sul, Porto Alegre-RS. Naoel H Feres – Universidade Federal do Mato Grosso, Cuiabá-MT. Eliane S Dutra – Hospital Universitário de Brasília, Brasília-DF. Ana P P F Carvalho – Hospital das Clínicas de Goiânia, Goiânia-GO. Marta M David – Hospital Universitário Maria Aparecida Pedrossian, Campo Grande-MS. Isa G Rodrigues – Pronto Socorro Cardiológico Universitário de Pernambuco, Recife-PE. Antonio C S Sousa – Hospital São Lucas, Aracaju-se. Amanda G L Coura – Hospital Universitário Alcides Carneiro, Campina Grande-PB. Josilene M F Pinheiro – Hospital Universitário Ana Bezerra, Santa Cruz-RN. Sandra M L Vasconcelos – Universidade Federal de Alagoas, Maceió-AL. Andreza M Penafort – Universidade de Fortaleza, Fortaleza-CE. Daniele M O Carlos – Hospital de Messejana, Fortaleza-CE. Viviane Sahade – Hospital Universitário Professor Edgard Santos, Salvador-BA. Adriana B Luna – Hospital Universitário da Universidade Federal de Sergipe, Aracaju-SE. José A F Neto – Hospital Universitário da Universidade Federal do Maranhão, São Luís-MA. Emilio H Moriguchi – Associação Veranense de Assistência em Saúde, Veranópolis-RS. Maria C O Izar – Universidade Federal de São Paulo, São Paulo-SP. Sônia L Pinto – Universidade Federal de Tocantins, Palmas-TO. Hospital São Vicente de Paulo, Luciano M Backes – Passo Fundo-RS. Simone R Souza – Instituto Estadual de Cardiologia Aloysio de Castro, Rio de Janeiro-RJ. Magali C C – COTENUT, Porto Alegre – RS.
This work was supported by Hospital do Coração (HCor) as part of the ‘Hospitais de Excelência a Serviço do SUS (PROADI-SUS)’ Program, in partnership with the Brazilian Ministry of Health. JB and AM are CNPq Researchers Fellows. ARC received a scholarship from Coordenação de Aperfeiçoamento de Pessoal de Nível Superior (CAPES, Code 001).
The authors declare that they have no conflict of interest.
A. R. d C.: conceptualisation; data curation; formal analysis; investigation; methodology; software; visualisation; roles/writing – original draft and writing – review and editing. L. L. J.: conceptualisation; data curation; formal analysis; methodology and software and writing – review and editing. A. M., Â. C. B-F. and B. W.: conceptualisation; funding acquisition; methodology; resources; validation and writing – review and editing. J. B.: conceptualisation; funding acquisition; methodology; project administration; resources; supervision; validation and writing – review and editing.