Implications
Beef is characterized by a high variability of its palatability, which is one reason for consumer dissatisfaction. In France, there is still no reliable technique to predict beef quality to deliver a consistent eating experience for the consumer. Australia has developed the Meat Standards Australia (MSA) grading scheme to predict beef quality for each individual ‘muscle × specific cooking method’ combination using various information on the corresponding animals and meats. The MSA system has been shown to predict beef quality not only in Australia, but also in many other countries (Hwang et al., Reference Hwang, Polkinghorne, Lee and Thompson2008; Thompson et al., Reference Thompson, Polkinghorne, Gee, Motiang, Strydom, Mashau, Ng'ambi, de Kock and Burrow2010). The results of this study indicate that it would be possible to manage a grading system in France similar to the MSA system. In conclusion, an MSA-like meat grading system may be set up in France.
Introduction
Australia has developed the Meat Standards Australia (MSA) grading scheme to predict beef quality for consumers (Ferguson et al., Reference Ferguson, Thompson and Polkinghorne1999; Polkinghorne et al., Reference Polkinghorne, Watson, Porter, Gee, Scott and Thompson1999; Thompson et al., Reference Thompson, Polkinghorne, Hearnshaw and Ferguson1999a and 1999Reference Thompson, Polkinghorne, Watson, Gee and Murisonb; Thompson, Reference Thompson2002). This system is based on the development and the use of a research database with a large amount of data, including the use of a large-scale consumer testing system with cuts cooked in different ways, as well as information on the corresponding animals, carcasses and meats. The system is also based on statistical analyses carried out on this database to identify the critical control points of beef palatability, which is indicated for individual muscles and for a specific cooking method and ageing time (Watson et al., Reference Watson, Polkinghorne and Thompson2008b).
France is the country in the European Union (EU) with the largest cattle herd. France is therefore the largest beef meat producer and consumer in Europe, even though the consumption of beef has declined to reach 25 kg/person per year in 2010 (Hocquette and Chatellier, Reference Hocquette and Chatellier2011).
French beef meat operators have been informed about the MSA programme (Moëvi et al., Reference Moëvi, Hocquette, Jurie and Micol2008a and Reference Moëvi, Hocquette, Jurie and Micol2008b), which was (and is still) promoted at the international level. The French Livestock Institute (‘Institut de l'Elevage’, a non-profit national and technical institute dealing with applied research and development and specialized in livestock farming and products – cattle, sheep, goats, horses, forage resources and rural land use) and ‘INRA de Theix’ (public basic research institute for agriculture in France) were tasked to assess the MSA system with perspectives for the French beef industry. This work was also undertaken as part of the current European research programme ProSafeBeef (a programme focused on beef quality and safety, 2007 to 2011). The study was supported by the French Meat and Livestock Association (Interbev) and the National Office for Meat and Dairy Products (now FranceAgriMer). This work was carried out in 2007/2008, leading to a comprehensive report (Moëvi et al., Reference Moëvi, Hocquette, Jurie and Micol2008a) and a viewpoint publication (Hocquette et al., Reference Hocquette, Legrand, Jurie, Pethick and Micol2011a). As a result of this work, experts involved in the French meat industry recognized many qualities of the MSA system. It was judged comprehensive, consistent and scientifically supported and finally very interesting to be described and debated in France.
On the basis of these observations, an experiment described in this paper was set up to test the accuracy for predicting palatability scores of French consumers when using the MSA sensory protocol and prediction model. This paper reports the results of this experiment, which allowed the following comparisons to be made: (i) between French and Australian consumer preferences for beef using linked samples from Australian carcasses, (ii) between the actual scores of French and Australian beef given by French consumers (including medium and rare cooking) compared with those predicted using the MSA model.
Material and methods
Source of beef
Eighteen Australian cattle, all steers, were slaughtered at the Northern Co-operative Meat Company abattoir at Casino in New South Wales (Australia). A part of this meat was dedicated to Australian consumer testing, another part to French consumer testing and a third part to beef testing in South Africa under another project (Thompson et al., Reference Thompson, Polkinghorne, Gee, Motiang, Strydom, Mashau, Ng'ambi, de Kock and Burrow2010).
Eighteen French cattle were slaughtered under EU requirements following French industry practice, in a private abattoir in the western part of France.
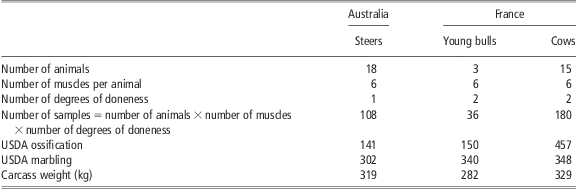
The type of cattle was chosen to reflect common commercial production offered to French consumers, which is very different from the Australian one. Three young bulls, three young dairy cows, six cull dairy cows and six cull beef cows were used to provide the French beef samples in the French experiment, none of them were steers (Table 1). The carcasses were weighed and graded according to the EU classification including conformation and fatness. In addition, pH/temperature declines on all the carcasses were recorded according to Perry et al. (Reference Perry, Shorthose, Ferguson and Thompson2001). Moreover, the carcasses were graded by a qualified MSA grader for ossification, marbling score, meat colour, rib fat, ultimate pH and muscle temperature (Thompson, Reference Thompson2002).
Some characteristics of the animal groups
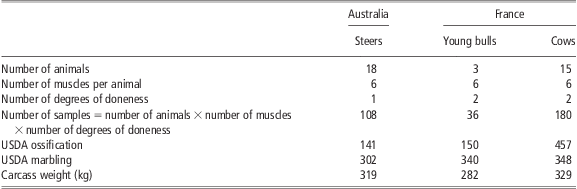
USDA = United States Department of Agriculture.
Muscles
Six muscles were tested as paired samples in France and Australia. They were chosen to give a wide range of eating qualities: outside (m. biceps femoris), topside (m. semimembranosus), striploin (m. longissimus dorsi), rump (m. gluteus medius), oyster blade (m. infraspinatus) and tenderloin (m. psoas major).
For Australia, each muscle was collected from 18 animals with 9 of each muscle aged 5 days and 9 aged 21 days, whereas there was a single ageing time of 10 days for the French samples.
Meat preparation and French consumer panels
Consumer assessment of eating quality was done according to protocols for MSA testing described by Watson et al. (Reference Watson, Gee, Polkinghorne and Porter2008a).
Grilled steaks were cooked on a Silex clamshell grill (Silex, Hamburg, Germany) set to 220°C for 4.75 min for ‘medium’ and to 200°C for 3.25 min for ‘rare’ (Watson et al., Reference Watson, Gee, Polkinghorne and Porter2008a, Accessory publication).
Each consumer (Australian or French) received seven samples: the first sample was a link sample derived from either the striploin or rump eye muscles. Following this first link sample, every consumer received a further six steaks, one from each of six different muscle types. The order of product presentation to consumers was controlled by a 6 × 6 Latin square, which ensured that each product was served an equal number of times in each presentational order position (two to seven) and an equal number of times before and after each other product to balance out any potential order, lag or halo effects. Within each of the products, there were six source samples (one muscle from one animal) comprising three from France and three from Australia. Ten consumers tasted each. This involved five steaks from each sample, which were halved after cooking. The five steaks from each sample were cooked in different rounds, so every sample was always spread across five of the six possible order positions from two to seven and in addition controlled so that one steak was served within five separate subgroups of 12 consumers within the base 60 consumers used in any one session.
Thus, in total, 360 French consumers took part in the ‘medium’ cooking test, with each consumer eating three Australian beef samples and three French beef samples. In addition to that, 180 French consumers tested the ‘rare’ beef, only from French origin and prepared as paired samples from the same cuts used for the ‘medium’ cooking. In Australia, 180 consumers were used to test the Australian beef steaks, which were all cooked to medium.
Consumers scored portions for tenderness (tn), juiciness (ju), flavour liking (fl) and overall liking (ov), and for this purpose they made a mark on a 100 mm line scale. In addition, they were asked to assign a quality rating to each sample: ‘unsatisfactory’, ‘good everyday’ (equivalent to 3*), ‘better than everyday quality’ (equivalent to 4*) or ‘premium quality’ (equivalent to 5*). Before the taste panel, data were obtained on the demographic profile of the consumers and their families, the families’ meat purchase habits and their frequency and habits of beef consumption. After completion of the beef tasting, consumers were asked to quantify their willingness to pay for the different grades (unsatisfactory, good everyday, better than everyday and premium) of meat.
Data analysis
The relationship of the satisfaction grade to the four sensory scores was determined using discriminant analysis (Watson et al., Reference Watson, Gee, Polkinghorne and Porter2008a). The problem addressed here was to combine consumer scores for tn, ju, fl and ov into a single score (called MQ4) that could be used to predict the four satisfaction grades (namely ‘unsatisfactory’, ‘good everyday’, ‘better than everyday quality’ or ‘premium quality’). A linear discriminant analysis was used with the satisfaction grade as the criterion to be predicted by tn, ju, fl and ov.
Results and discussion
Consumer characteristics
In total, 540 French consumers were involved, including 306 women (57%) and 234 men (43%). Overall, there was an even distribution between the six age classes, except for the oldest people (>65 years) who were very few (3.3% only). Women were most represented in the young classes (<35 years) and men in the oldest one (>65 years). All the Australian consumers were aged between 20 and 50 years, with 54% in the 40- to 50-year age category. The gender ratio was 47% and 53% males and females, respectively.
Quality and meat price
The actual values for the willingness to pay were 5.0€ for unsatisfactory, 11.6€ for 3*, 16.2€ for 4* and 21.7€ for 5* (which means a 1.87-fold difference between 3* and 5* products). Differences in France were smaller than those observed in other countries such as Japan or the United States of America (with 2.94- and 2.42-fold differences between 3* and 5* products) but very similar to those from Ireland where a 1.64-fold difference was observed between 3* and 5* beef (Lyford et al., Reference Lyford, Thompson, Polkinghorne, Miller, Nishimura, Neath, Allen and Belasco2010).
MQ4 as a measure of eating quality for French consumers
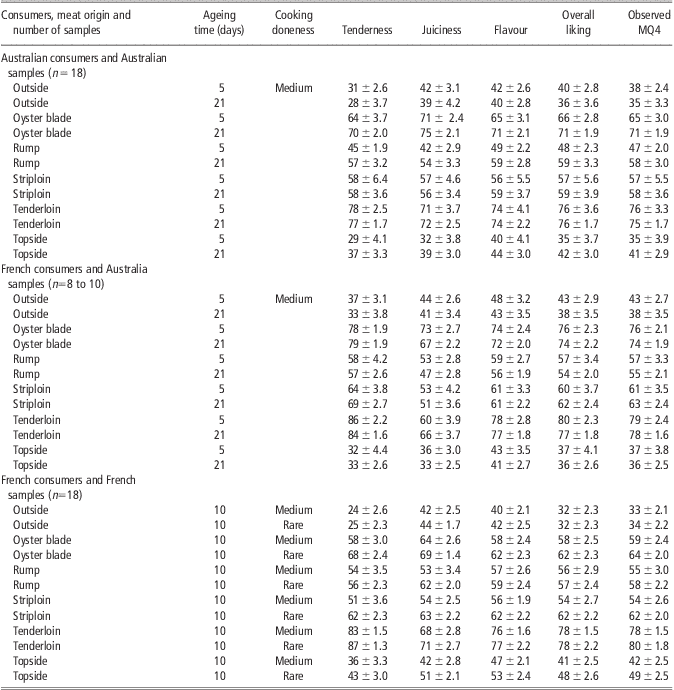
Values of consumer scores for tn, ju, fl and ov are shown in Table 2 for each group of French and Australian consumers. There was generally a good agreement between the palatability scores for French and Australian consumers eating the same samples at the same degree of doneness with an R 2 for tn, ju, fl and ov of 0.96, 0.79, 0.94 and 0.94, respectively. There was also a high correlation between medium and rare cooking for the French consumer palatability scores (R 2 > 0.9).
Means (±s.e.) for sensory scores given by Australian and French consumers according to the country origin of samples, and according to ageing time or cooking method depending on the groups of samples
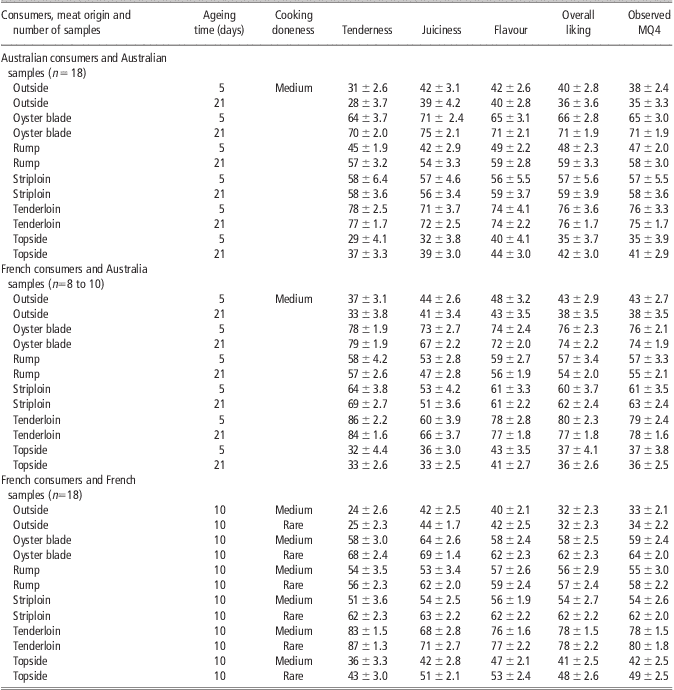
Each sample was tested by 10 consumers. Each sample score was the mean of the assessment by these 10 consumers. The table indicates means ± s.e. of sample scores for nine Australian samples at each ageing time, and for 18 French samples for each cooking method.
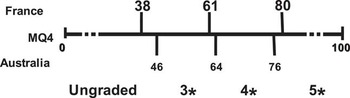
The optimal weightings of the four sensory parameters (tn, ju, fl and ov) to predict the final rating (‘unsatisfactory’, 3*, 4* and 5*) from the MQ4 score (equal to 0.31 tn + 0.04 ju + 0.30 fl + 0.36 ov and indicated in Table 2) were similar to those in Australia, as the weighting for tn, ju, fl and ov scores currently used for MSA in Australia are 0.3, 0.1, 0.3 and 0.3 (Thompson et al., Reference Thompson, Polkinghorne, Gee, Motiang, Strydom, Mashau, Ng'ambi, de Kock and Burrow2010). Moreover, these weightings predicted the actual rating given by consumers for over 70% of the total number of samples, indicating that a high level of prediction is possible for French consumers. The MSA boundaries for French consumers between ‘unsatisfactory’, 3*, 4* and 5* were found to be ca. 38, 61 and 80, respectively. The differences between extreme classes are therefore slightly more important in France than in Australia (Figure 1).
Meat Standards Australia boundaries between ‘unsatisfactory’, 3*, 4* and 5* in France and in Australia.

Prediction of beef quality
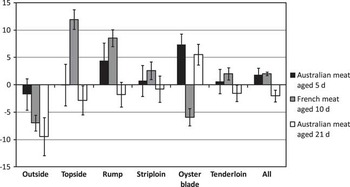
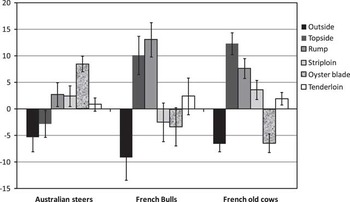
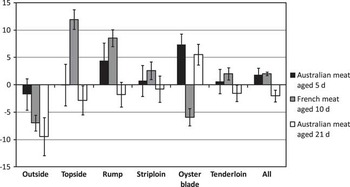
The Australian MSA model provides a predicted MQ4 score (MQ4pred) for each cut from the factors recorded for each carcass. One important area of interest was the differences between (i) the observed MQ4 score (MQ4obs) based on real consumer scores and calculated from the above equation (MQ4 = 0.31 tn + 0.04 ju + 0.30 fl + 0.36 ov) and (ii) the MQ4pred from the Australian model. The mean differences (or residuals between observed and predicted values) are presented for each cut eaten by French consumers in Figures 2 and 3.
Mean differences (+/− standard errors) between MQobs and MQpred for muscles tested by French consumers at different ageing times and also global average across all steaks (all).
Mean differences (+/− standard errors) between MQobs and MQpred for meats tested by French consumers, by animal types and muscles.

These results showed that, on average across all muscles consumed in France, the MSA model predicted the MQ4 score, with global predictive scores per country origin ×ageing time never deviating by more than 5 on a 0 to 100 scale (Figure 2). The quality score was rather underestimated or overestimated about 2 points for all samples. However, there were three main discrepancies, regarding the results for each individual muscle. The oyster blade was undervalued by at least 5 points for the Australian samples regardless of ageing time, but overvalued by almost 6 points for the French samples. French topside and rump were also underevaluated by 8 to 12 points, but not the Australian ones. Only the outside was clearly overvalued by 7 to 10 points for the samples aged more than 5 days (French 10 days and Australian 21 days): the ageing effectiveness was obviously overestimated for this rather tough muscle (Figure 3).
It is also interesting to consider the results by muscle and animal type, given that there were different confounding effects (Figure 3). Muscle samples from steers were aged either 5 or 21 days, and young bull and cow samples were aged 10 days. Meanwhile, muscles from steers were only tested at a ‘medium’ doneness, whereas for young bulls and cows half were consumed ‘medium’ and half were consumed ‘rare’. The main discrepancy with Australian steers was that the oyster blade was slightly underevaluated. There were also small discrepancies with the outside, the topside and the rump muscles from young French bulls. Apart from that, French meat from young French bulls was well predicted by the steer prediction from the Australian MSA system, which at this stage does not have a prediction for meat from bulls. On the other hand, quality of French cow beef seemed to be mainly underevaluated by the MSA prediction model except for the outside and the oyster blade (Figure 3).
Future perspectives
This study indicated that the French beef quality can be predicted using the current MSA system as for the Australian beef. This conclusion was also found in previous studies in Japan (Polkinghorne RJ, personal communication), Korea (Thompson et al., Reference Thompson, Polkinghorne, Hwang, Gee, Cho, Park and Lee2008) and the United States of America (Smith et al., Reference Smith, Tatum and Belk2008).
One of the goals of the current European research programme called ProSafeBeef (2007 to 2011), in which France, Ireland, Germany, Belgium, Greece, the United Kingdom (among the major partners) are participating, is to try to establish a European prediction model for beef. This could draw on the Australian MSA system for inspiration and expertise. Another goal of the ProSafeBeef programme is to include in this meat quality prediction model biochemical characteristics of muscles related to meat quality (Hocquette et al., Reference Hocquette, Meurice, Brun, Jurie, Denoyelle, Bauchart, Renand, Nute and Picard2011b) and the genomic markers that have been discovered in various countries (Hocquette et al., Reference Hocquette, Lehnert, Barendse, Cassar-Malek and Picard2007; Hocquette et al., Reference Hocquette, Gondret, Baéza, Médale, Jurie and Pethick2010). The MSA system is indeed currently considering the incorporation of gene markers for tenderness into the model.
Another important question in France would be to test beef from different pure breeds to those commonly used in Australia. Thus, common French cattle breeds such as Limousine and Charolais are typically used for cross-breeding in Australia, and given the typically lower levels of intramuscular fat and different muscle structure (Jurie et al., Reference Jurie, Cassar-Malek, Bonnet, Leroux, Bauchart, Boulesteix, Pethick and Hocquette2007) further work is required to predict the eating quality for these cattle as pure breeds. This is important from a French perspective in order to support existing official quality signs. In fact, the MSA system is a meticulous approach capable of supporting the pre-existing quality signs without aiming to enter into competition with them.
Comparison of consumer data across countries with the same beef samples would also be essential to start the development of a European system to predict quality. Indeed, recent work undertaken within the European research programme ProSafeBeef showed that the concept of a beef eating-quality guarantee system is well accepted by European beef consumers (Verbeke et al., Reference Verbeke, Wezemael, de Barcellos, Kügler, Hocquette, Ueland and Grunert2010).
Conclusion
The MSA system has been proved to be able to predict beef quality in many countries throughout the world, suggesting common attitudes of consumers regardless of the country and despite culture differences across them (for instance, for cooking beef). Nevertheless, further studies are still necessary to report the effectiveness of the MSA model over a wider range of treatments.
The MSA system represents the first elaborate system to predict the sensorial guarantee of a cut of beef according to its length of ageing and the method of cooking. The system must be praised for having created a federation in Australia with a large number of beef industry personnel involved, including scientists, farmers, processors and retailers. This trans-chain approach aimed at satisfying consumer expectations immediately raises questions concerning traditional attitudes and the positioning of the different professionals in the beef chain, at least in France. The French beef industry still needs to be convinced and to express its wishes.
Acknowledgements
The authors thank the financial contributions of the ‘National Office for Meat and Dairy Products’ (now ‘FranceAgriMer’), of the French ‘Direction Générale de l'Alimentation’ and of a French well-known private Company, which also provided the meat of 3 of the 18 animals needed for the experiment. Another small private enterprise specialized in meat selection and boning used for gourmet restaurants (Jean Denaud) was also associated to this experiment. Two organizations dealing with the Charolais breed (‘Association Institut du Charolais’, ‘Syndicat de Défense et de promotion de la Viande de Boeuf de Charolles’) also funded this experiment. Apart from that, French and Australian journeys were supported for 2 years by ‘Egide/Fast’ funds from French and Australian governments, respectively.
The authors would like to acknowledge the assistance of Janine Lau and Alan Gee (Australia). The authors also thank John Thompson (Australia) and Paul Allen (Ireland) for their help.