) faces of ultrahigh vacuum cleaved hydrothermally grown ZnO single crystals. The cleaved polar surfaces showed a characteristic polarity effect in that the intensity of emission from the lowest binding energy O 2p related valence band states was significantly stronger on the Zn-polar face, even when the cleaved surfaces were imperfect with irregular nonatomically flat features. A residual submonolayer hydroxyl termination of approximately 0.5 ML was observed on both the Zn-polar and O-polar surfaces immediately after cleaving. The near-surface downward band bending on the O-polar face was removed by the cleaving process leaving almost flat bands, while on the cleaved Zn-polar face, emission from states above the valence band edge was observed.
I. INTRODUCTION
ZnO is a wide band gap metal oxide semiconductor with a direct gap of 3.35 eV at 300 K that is of particular interest for applications in ultraviolet optoelectronics, transparent electronics, environmental sensing, and catalysis. However, many of its electrical and optical properties such as near-band-edge photoluminescence, work function, photoconductivity, and Schottky contact barrier height vary significantly with crystallographic polarity.Reference Allen, Miller, Reeves and Durbin1–Reference Allen, Mendelsberg, Reeves and Durbin4 These variations have been linked to the wurtzite crystal structure and the high ionicity of the Zn–O bond (0.616 on the Phillips ionicity scale).Reference Klingshirn5
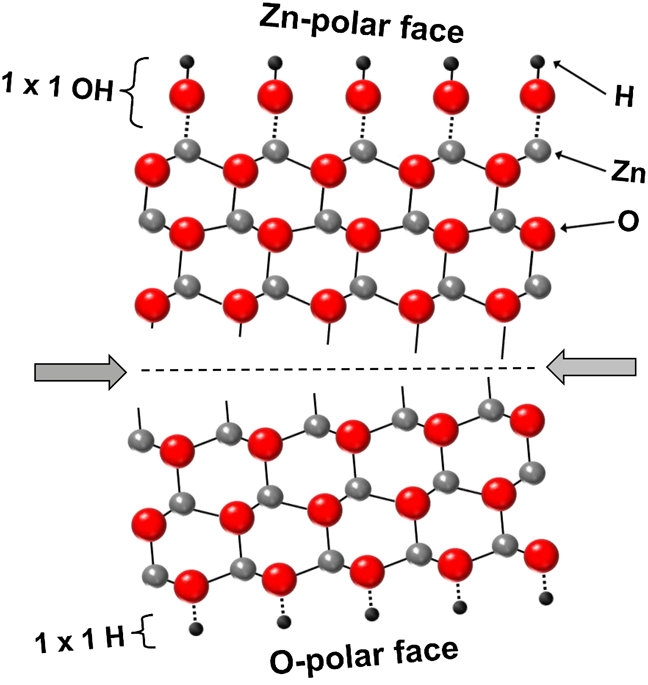
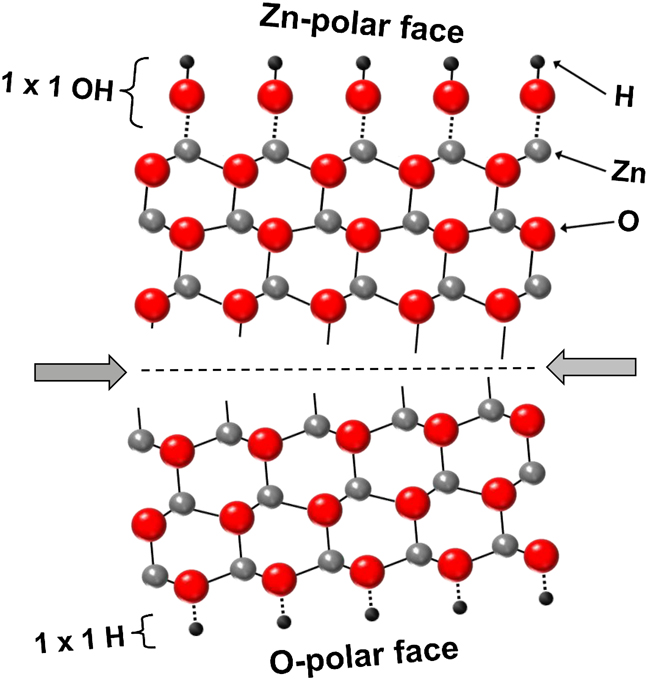
When viewed along the c-axis, ZnO consists of alternating planes of Zn and O atoms, arranged in 3-fold coordinated “double layers” separated by a single Zn–O bond as shown in Fig. 1. Any termination (during growth or cleavage) of the crystal perpendicular to the c-axis results in one of two structurally and electrically different polar surfaces: the Zn-polar (0001) face, which consists of an outer plane of Zn atoms, or the O-polar ( ) face, which consists of an outer plane of O atoms. X-ray photoemissionReference Allen, Zemlyanov, Waterhouse, Metson, Veal, McConville and Durbin6 and grazing angle surface x-ray diffraction studiesReference Schlepütz, Yang, Husseini, Heinhold, Kim, Allen, Durbin and Clarke7 have shown that these polar surfaces are most likely terminated by a persistent (1 × 1) coverage of hydroxyl groups. These hydroxyl groups are thought to play an important role in stabilizing the Zn-polar and O-polar surfaces, which otherwise are electrostatically unstable.Reference Kresse, Dulub and Diebold8, Reference Dulub, Diebold and Kresse9 Other stabilization mechanisms have also been proposed, such as (i) a fractional charge transfer of 0.5 e− from the O-polar to the Zn-polar face and (ii) surface reconstructions involving the removal of 25% of the surface Zn/O atoms.Reference Kresse, Dulub and Diebold8–Reference Valtiner, Borodin and Grundmeier11
Cleavage of the ZnO wurtzite crystal structure perpendicular to the c-axis showing the hydroxyl termination of the as-received Zn-polar and O-polar faces.
The high ionicity of the Zn–O bond within the wurtzite crystal structure also results in a large spontaneous polarization (−5.7 × 10⁻⁶ C/cm2) along the c-axis.Reference Bernardini, Fiorentini and Vanderbilt12 This in turn gives rise to equal and opposite bound spontaneous polarization charges on the Zn-polar (−5.7 × 10⁻⁶ C/cm2) and O-polar (+5.7 × 10⁻⁶ C/cm2) faces that are present at zero strain. The associated internal electric field is expected to influence the distribution of free carriers and also affect the near-surface band bending.Reference Allen, Miller, Reeves and Durbin1, Reference Harris, Lee, Webb, Tang, Harrison, Flannery, Cheng and Foxon13
II. EXPERIMENT
In this paper, we investigate the chemical and electronic properties of as-received and ultrahigh vacuum cleaved Zn-polar (0001) and O-polar ( ) surfaces of bulk-grown ZnO single crystals using x-ray photoelectron spectroscopy (XPS). In situ cleaving allows bare polar surfaces, free of atmospheric adsorbates and contaminants, to be investigated. The ZnO single crystals (10 × 10 × 0.5 mm3 and 10 × 10 × 1 mm3) were prepared by Tokyo Denpa Co. Ltd. (Tokyo, Japan) using the hydrothermal method and epipolished on both the Zn-polar and O-polar faces to a surface roughness of <0.3 nm.Reference Ohshima, Ogino, Niikura, Maeda, Sato, Ito and Fukuda14 Low resistivity (0.15 Ωcm) wafers grown from seed crystals in the −c direction were chosen to ensure good electrical contact with the XPS spectrometer.Reference Ohshima, Ogino, Niikura, Maeda, Sato, Ito and Fukuda14
XPS measurements were performed at the soft x-ray beamline of the Australian synchrotron using photon energies from 100 to 1486.6 eV. The use of variable energy photons provides a useful means of identifying surface versus bulk effects. Unless otherwise stated, the spectra were collected with the detector axis normal to the sample surface (take-off angle θ = 90°) and calibrated with reference to the Au 4f doublet and the Fermi edge of a sputter-cleaned reference Au foil. All samples were carefully grounded to the spectrometer to avoid peak distortion and drift due to charging, the absence of which was confirmed by varying the incident photon flux. Provided samples are well grounded to the instrument, the zero of the binding energy scale of the spectrometer can be referenced to the Fermi level of the sample.
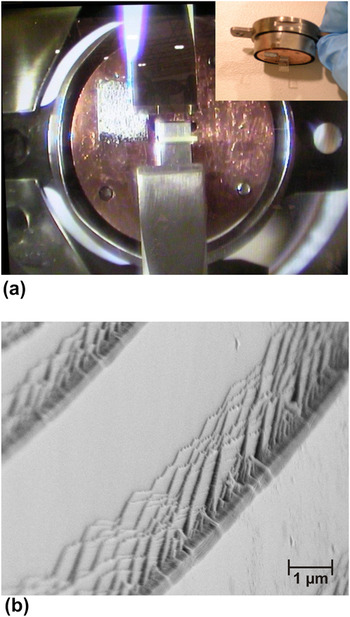
For the as-received surfaces, the samples were ultrasonically cleaned in acetone, methanol, and isopropyl alcohol and then dried in N2 gas. For the cleaving experiments, 3 × 10 × 1 mm3 rectangular prism-shaped samples were prepared with the c-axis parallel to the long edge. These samples were clamped in a brass sample holder as shown in Fig. 2(a) and cleaved perpendicularly across the c-axis using a pair of opposing knife edge shears in a side chamber at a base pressure of ∼10−9 Torr. Samples were cleaved with either the +c direction oriented vertically upwards to obtain a cleaved Zn-polar surface or vertically downwards to obtain a cleaved O-polar surface. Despite its large ionicity, ZnO is still likely to cleave normal to the c-axis as this breaks the fewest number of interatomic bonds (see Fig. 1). XPS measurements were performed in an analysis chamber at a base pressure of <2 × 10⁻¹⁰ Torr using a 1000 × 300 μm2 analyzed area, which was fully contained within the area of the cleaved surfaces (∼ 3 × 1 mm2). O 1s spectra were collected at photon energies of 680 and 1486.6 eV to quantify the OH coverage on each face, and valence band spectra were collected at photon energies of 150 and 680 eV to investigate the valence band density of states and the near-surface band bending on each face.
In situ cleaving shears at the soft x-ray beamline of the Australian Synchrotron and (b) scanning electron microscope image of the in-situ cleaved Zn-polar (0001) surface.

III. RESULTS AND DISCUSSION
A. As-received ZnO surfaces
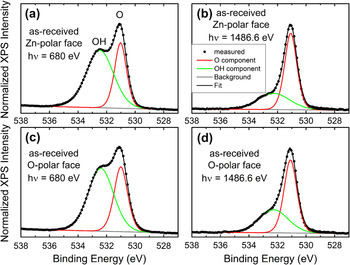
Figure 3 shows the O 1s core-level XPS spectra measured using photon energies (hν) of 680 and 1486.6 eV from the Zn-polar and O-polar faces of an as-received ZnO single crystal wafer. The dominant emission at 531.2 eV is due to bulk oxygen, while the high energy shoulder at 532.6 eV is due to oxygen associated with the surface hydroxyl (OH) groups. The intensity of the OH shoulder increases significantly with decreasing photon energy (increasing surface sensitivity) since the inelastic mean free path of the photoelectrons decreases with decreasing kinetic energy (down to ∼70 eV).
O 1s core-level XPS spectra taken from the Zn-polar (0001) and O-polar (000 ) faces of as-received single crystal ZnO at photon energies of 680 eV [(a) & (c)] and 1486.6 eV [(b) & (d)]. Also shown are Gaussian-Lorentzian fits to the contributions from bulk O and surface OH.

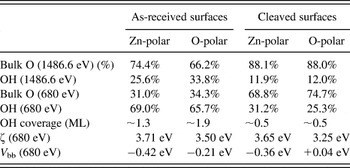
To obtain an analytical estimate for the relative atomic concentrations of bulk and OH oxygen, the O 1s core-level spectra were fitted using Gaussian–Lorentzian functions and a linear background to account for secondary electrons. These fits are also shown in Fig. 3 and the quantification results given in Table I. The atomic percentage of OH on the Zn-polar (O-polar) face was 25.6% (33.8%) for hν = 1486.6 eV, which increased to 69.0% (65.7%) for the more surface sensitive hν = 680 eV spectra. The OH coverage was estimated to be ∼1.3 (∼1.9) monolayers (ML) on the Zn-polar (O-polar) face. This coverage is consistent with the (1 × 1) overlayer reported by Schlepütz et al.Reference Schlepütz, Yang, Husseini, Heinhold, Kim, Allen, Durbin and Clarke7 using surface x-ray diffraction, with perhaps additional broadening of the OH shoulder from H2O hydrogen bonded to the terminating OH groups.
Quantification analysis of the hydroxyl coverage and downward band bending on as-received and in situ cleaved ZnO surfaces using photon energies of 1486.6 and 680 eV.

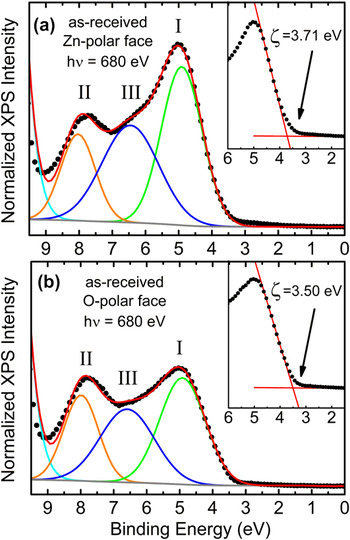
Figure 4 shows the valence band XPS spectra of the same as-received polar surfaces using a photon energy of 680 eV. The valence band spectra can be resolved into three separate peaks fitted with pure Gaussian functions. The two main features, peak I and peak II, are located at ∼5.0 and ∼8.0 eV, respectively, together with a less resolved third peak III at ∼6.5 eV. Peak I has been attributed to predominately O 2p derived states and peak II is thought to have a mainly hybridized O 2p, Zn 4s, and (possibly) Zn 3d character.Reference King, Veal, Schleife, Zúñiga-Pérez, Martel, Jefferson, Fuchs, Muñoz-Sanjosé, Bechstedt and McConville15, Reference Göpel, Pollmann, Ivanov and Reihl16 The valence band spectra show a characteristic polarity effect in that the photoemission from the lowest binding energy peak I is significantly more intense on the Zn-polar face compared to the O-polar face. This is a remarkably consistent phenomena that has been consistently observed in many other samples at photon energies between 600 and 1486.6 eV.Reference Allen, Zemlyanov, Waterhouse, Metson, Veal, McConville and Durbin6, Reference Allen, Swartz, Myers, Veal, McConville and Durbin17
Valence band XPS spectra taken from (a) the Zn-polar (0001) face and (b) the O-polar (000 ) face of as-received single crystal ZnO at a photon energy hν = 680 eV. Pure Gaussian fits to peaks I, II, and III are also shown. The inset shows the linear fit to the low binding energy edge of peak I and then extracted value of ζ.

The position of the low binding energy edge of the valence band spectra can be used to investigate the near-surface band bending in ZnO. The energy difference ζ = E V − E F between the valance band maximum (E V) and the surface Fermi level (E F) can be determined by extrapolating a linear fit of the low binding energy edge of the valance band spectra to the instrument background as shown in Fig. 4.Reference Chambers, Droubay, Kaspar and Gutowski18 The values of ζ for the as-received Zn-polar and O-polar faces (given in Table I) are larger than the room temperature band gap of ZnO (E g = 3.35 eV) indicating that the near-surface Fermi level lies in the conduction band. This indicates the presence of significant downward band bending and an associated accumulation layer of electrons at both polar faces.Reference Allen, Swartz, Myers, Veal, McConville and Durbin17 The magnitude of the near-surface downward band bending V bb can be obtained from V bb = E g − ζ − ξ where ξ = (kT/q)ln(N C/n) is the energy difference between the Fermi level and the conduction band minimum in the bulk of the sample (n is the bulk carrier concentration, N C is the conduction band effective density of states = 2.94 × 1018 cm−3 for ZnO). For the ZnO single crystals used in this study, n ≈ 3 × 1017 cm−3, which gives ξ = 0.06 eV. The values of V bb for each as-received polar face are given in Table I and show that the downward band bending is significantly larger on the Zn-polar face compared to the O-polar face.
B. In situ cleaved ZnO surfaces
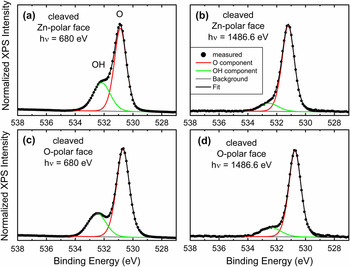
Figure 5 shows the O 1s core-level spectra from the Zn-polar and O-polar faces of a cleaved ZnO single crystal for photon energies hν = 680 eV and hν = 1486.6 eV. As illustrated in Fig. 2(b), the cleaving process did not result in a single atomically flat surface but rather a stepped surface containing both smooth and terraced regions. Surprisingly, the cleaved surfaces were not hydroxyl free. Compared to the as-received surfaces, the atomic concentration of OH on the Zn-polar (O-polar) face decreased from 25.6% (33.8%) to 11.9% (12.0%) for hν = 1486.6 eV and from 69.0% (65.7%) to 31.2% (25.3%) for hν = 680 eV, respectively. The OH coverage on the cleaved surfaces was estimated to be ∼0.5 ML on both the Zn-polar and O-polar face. Since the cleaved faces were not exposed to atmospheric conditions, no surface contamination was expected. It is therefore likely that either bulk hydrogen or hydrogen from sides of the wafer diffused toward the cleaved surface immediately after cleaving, perhaps driven by the electrostatic need to stabilize the polar faces.Reference Traeger, Kauer, Wöll, Rogalla and Becker19 Hydrogen is a common impurity in ZnO occurring in many forms including interstitial atomic and molecular hydrogen with low barriers to diffusion.Reference Lavrov, Herklotz and Weber20–Reference Bang and Chang22 In contrast, the vacuum in the cleaving chamber was ∼10−9 Torr, which makes hydroxylation from residual H, H2, and H2O gases unlikely. Furthermore, cleaved crystals kept in the analysis chamber for a further 12 h showed no further change in hydroxylation, while hydroxyl-free surfaces prepared by sample heating above 600 K showed no evidence of any rehydroxylation in the same vacuum system.
O 1s core-level XPS spectra taken from the Zn-polar (0001) and O-polar (000 ) faces of in situ cleaved single crystal ZnO at photon energies of (a) & (c) 680 eV and (b) & (d) 1486.6 eV. Also shown are Gaussian-Lorentzian fits to the contributions from bulk O and surface OH.

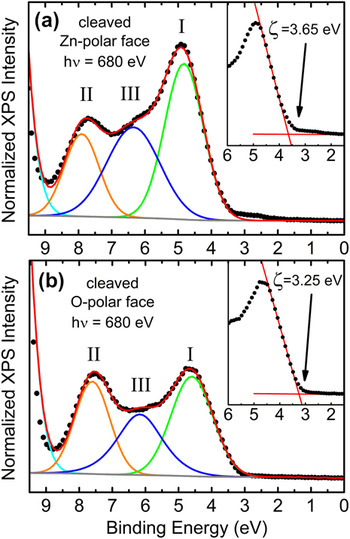
The valence band XPS spectra of the in situ cleaved polar surfaces at a photon energy of 680 eV are shown in Fig. 6. These show the same polarity-related effect in the intensity of peak I (i.e., significantly higher on the Zn-polar face compared to the O-polar face) as observed for the equivalent as-received surfaces. The occurrence of this polarity effect on several other imperfectly cleaved crystals with different surface defect densities suggests that the effect is not linked to surface morphology but is bulk like in nature. This is consistent with the observations of Allen et al.Reference Allen, Zemlyanov, Waterhouse, Metson, Veal, McConville and Durbin6 who reported that the polarity effect disappeared for a take-off angle of 60° to the c-axis direction. In addition, Williams et al.Reference Williams, Yoshikawa, Ueda, Yamashita, Kobayashi, Adachi, Haneda, Ohgaki, Miyazaki, Ishigaki and Ohashi23 observed a polarity effect for both polished and mechanically roughened (0001) and ( ) surfaces and also a significant increase in emission in peak I from the (
 ) surface when the take-off angle was parallel to the c-axis direction.
Valence band XPS spectra taken from (a) the Zn-polar (0001) face and (b) the O-polar (000 ) face of in situ cleaved single crystal ZnO at a photon energy hν = 680 eV. Pure Gaussian fits to peaks I, II, and III are also shown. The inset shows the linear fit to the low binding energy edge of the valence band spectra and the extracted value of ζ.

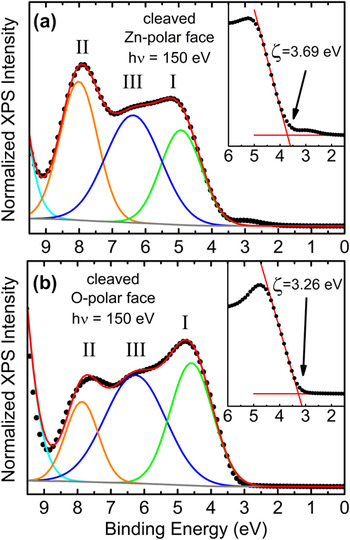
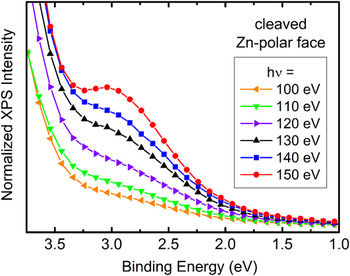
We further investigated the valance band spectra of the cleaved polar surfaces at a photon energy of 150 eV as shown in Fig. 7. As previously reported for as-received ZnO samples,Reference Allen, Zemlyanov, Waterhouse, Metson, Veal, McConville and Durbin6 the polarity effect involving peak I was not observed at low (i.e., more surface sensitive) photon energies. However, in the case of the cleaved Zn-polar face, a new relatively small peak, on the low binding energy side of peak I, can be resolved, indicating gap states above the valance band edge. This new emission is shown in greater detail in Fig. 8, using photon energies from 100 to 150 eV. It is possible that this new feature is linked to the formation of the submonolayer OH coverage on the cleaved Zn-polar face. Hydrogen diffusion from the bulk to the surface after cleaving may be capable of reducing lattice Zn to metallic Zn and OH groups, according to ZnO + H → OH + Zn.Reference Batyrev and van den Heuvel24 This metallic Zn could then be responsible for new low binding energy emission.
Interestingly, there is a significant change in the near-surface band bending (V bb) on the O-polar face after cleaving. The cleaved O-polar face has almost flat bands (V bb = +0.04 eV) compared to downward band bending of V bb = −0.21 eV on the equivalent as-received surface. This indicates that the surface electron accumulation layer on the O-polar face has been removed. This is in contrast to the cleaved Zn-polar face, which shows almost the same downward band bending (V bb = −0.36 eV) as on the as-received Zn-polar face (V bb = −0.42 eV).
Valence band XPS spectra taken from (a) the Zn-polar (0001) face and (b) the O-polar (000 ) face of in-situ cleaved single crystal ZnO at a photon energy hν = 150 eV. Pure Gaussian fits to peaks I, II, and III are also shown. The inset shows the linear fit to the low binding energy edge of the valence band spectra and the extracted value of ζ.

Valence band XPS spectra from the Zn-polar (0001) face of in situ cleaved single crystal ZnO at photon energies (hν) from 100 to 150 eV showing electron states with sub band gap binding energies.

IV. CONCLUSIONS
In conclusion, x-ray photoemission spectroscopy using synchrotron radiation (hν = 680 and 1486.6 eV) showed a residual (∼0.5 ML) hydroxyl termination on the Zn-polar (0001) and O-polar ( ) surfaces of hydrothermally grown ZnO single crystals after in situ cleaving. These in situ cleaved polar surfaces showed the same distinct polarity effect in the intensity of photoemission from the lowest binding energy valence band states (i.e., significantly higher emission from the Zn-polar face compared to the O-polar face) as observed in as-received ZnO. Interestingly, the polarity effect was still observed in the case of poorly cleaved surfaces with irregular features. This provides further evidence that the polarity effect is not due to surface states but is bulk like in nature. After cleaving, the surface Fermi level at the Zn-polar face remained in the conduction band, with little change in the amount of near-surface downward band bending, although new emission from states above the valence band edge was observed. In contrast, the downward bending on the O-polar face was removed after cleaving leaving almost flat bands.
ACKNOWLEDGMENTS
This work was supported by the New Zealand Marsden Fund (Grant No. UOC0909). We also acknowledge beamtime and the assistance Dr. L. Thomsen and Dr. A. Tadich at the Australian Synchrotron, Victoria, Australia. We are also grateful to Dr. D.Y. Zemlyanov of Purdue University and Dr. S.M. Durbin of the University at Buffalo.