1 Introduction
Large-scale coherent structures in the form of wavepackets play an important role in the dynamics and acoustics of turbulent jets. In particular, their spatial coherence makes wavepackets efficient sources of sound (Crighton & Huerre Reference Crighton and Huerre1990; Jordan & Colonius Reference Jordan and Colonius2013). They are most easily observed in forced experiments, where periodic exertion establishes a phase reference. The measurements of a periodically forced turbulent jet by Crow & Champagne (Reference Crow and Champagne1971) served as a reference case for wavepacket models. Early examples of such models include the studies by Michalke (Reference Michalke1971) and Crighton & Gaster (Reference Crighton and Gaster1976), who established the idea that the coherent structures can be interpreted as linear instability waves evolving around the turbulent mean flow.
Wavepackets in unforced jets exhibit intermittent behaviour (Cavalieri et al. Reference Cavalieri, Jordan, Agarwal and Gervais2011) and as a result are best understood as statistical objects that emerge from the stochastic turbulent flow. We use spectral proper orthogonal decomposition (SPOD) (Lumley Reference Lumley1970; Towne, Schmidt & Colonius Reference Towne, Schmidt and Colonius2018) to extract these structures from the turbulent flow. SPOD has been applied to a range of jets using data from both experimental (Glauser, Leib & George Reference Glauser, Leib, George and Durst1987; Arndt, Long & Glauser Reference Arndt, Long and Glauser1997; Citriniti & George Reference Citriniti and George2000; Suzuki & Colonius Reference Suzuki and Colonius2006; Gudmundsson & Colonius Reference Gudmundsson and Colonius2011) and numerical studies (Sinha et al. Reference Sinha, Rodríguez, Brès and Colonius2014; Towne et al. Reference Towne, Colonius, Jordan, Cavalieri and Brès2015; Schmidt et al. Reference Schmidt, Towne, Colonius, Cavalieri, Jordan and Brès2017).
Wavepackets have been extensively studied, mainly because of their prominent role in the production of jet noise, and models based on the parabolized stability equations (PSE) have proved to be successful at modelling them (Gudmundsson & Colonius Reference Gudmundsson and Colonius2011; Cavalieri et al. Reference Cavalieri, Rodríguez, Jordan, Colonius and Gervais2013; Sinha et al. Reference Sinha, Rodríguez, Brès and Colonius2014). This agreement between SPOD modes and PSE solution breaks down at low frequencies and for some azimuthal wavenumbers, and in general downstream of the potential core. In the present study, we show that the SPOD eigenspectra unveil low-rank dynamics, and we inspect the corresponding modes and compare them with predictions based on resolvent analysis. The results show that two different mechanisms are active in turbulent jets, and they explain the success and failure of linear and PSE models.
Resolvent analysis of the turbulent mean-flow field seeks sets of forcing and response modes that are optimal with respect to the energetic gain between them. When applied to the mean of a fully turbulent flow, the resolvent forcing modes can be associated with nonlinear modal interactions (McKeon & Sharma Reference McKeon and Sharma2010) as well as stochastic inputs to the flow, for example the turbulent boundary layer in the nozzle that feeds the jet. Garnaud et al. (Reference Garnaud, Lesshafft, Schmid and Huerre2013) interpreted the results of their resolvent analysis of a turbulent jet in the light of experimental studies of forced jets by Moore (Reference Moore1977) and Crow & Champagne (Reference Crow and Champagne1971). They found that the frequency of the largest gain approximately corresponds to what the experimentalists referred to as the preferred frequency, i.e. the frequency where external harmonic forcing in the experiments triggered the largest response. In the context of jet aeroacoustics, Jeun, Nichols & Jovanović (Reference Jeun, Nichols and Jovanović2016) restricted the optimal forcing to vortical perturbations close to the jet axis, and the optimal responses to the far-field pressure. Their results show that suboptimal modes have to be considered in resolvent-based jet noise models.
In this paper, we use resolvent analysis to model and explain the low-rank behaviour of turbulent jets revealed by SPOD. Recent theoretical connections between SPOD and resolvent analysis (Towne et al. Reference Towne, Colonius, Jordan, Cavalieri and Brès2015; Semeraro et al. Reference Semeraro, Jaunet, Jordan, Cavalieri and Lesshafft2016a ; Towne et al. Reference Towne, Schmidt and Colonius2018) make the latter a natural tool for this endeavour and provide a framework for interpreting our results.
The remainder of the paper is organized as follows. The three large-eddy simulation databases used to study different Mach number regimes are introduced in § 2. At first, the focus is on the lowest Mach number case in §§ 3–5. We start by analysing the data of this case using (mainly) SPOD in § 3, followed by the resolvent analysis in § 4. The results of the SPOD and the resolvent model are compared in § 5. Section 6 addresses Mach number effects observed in the remaining two cases representing the transonic and the supersonic regime. Finally, the results are discussed in § 7. For completeness, we report in the Appendix all results for the higher Mach number cases that were omitted in § 6 for brevity.
2 Large-eddy simulation
The unstructured flow solver ‘Charles’ (Brès et al.
Reference Brès, Ham, Nichols and Lele2017) is used to perform large-eddy simulations of three turbulent jets at Mach numbers
 $M_{j}=U_{j}/c_{j}$
of 0.4, 0.9 and 1.5. All jets are isothermal and the supersonic jet is ideally expanded. The nozzle geometry is included in the computational domain, and synthetic turbulence combined with a wall model is applied inside the nozzle to obtain a fully turbulent boundary layer inside the nozzle. The jets are further characterized by their Reynolds numbers
 $Re=\unicode[STIX]{x1D70C}_{j}U_{j}D/\unicode[STIX]{x1D707}_{j}$
, which correspond approximately to the laboratory values in a set of companion experiments, and a Prandtl number of
 $Pr=0.7$
. The reader is referred to Brès et al. (Reference Brès, Ham, Nichols and Lele2017) for further details on the numerical method, meshing strategy and subgrid-scale model. A detailed validation of the
 $M_{j}=0.9$
jet including the nozzle-interior turbulence modelling (i.e. synthetic turbulence, wall model) can be found in Brès et al. (Reference Brès, Jordan, Jaunet, Le Rallic, Cavalieri, Towne, Lele, Colonius and Schmidt2018). The subscripts
 $j$
, 0 and
 $\infty$
refer to jet, stagnation and free-stream conditions, respectively.
 $c$
is the speed of sound,
 $\unicode[STIX]{x1D70C}$
density,
 $D$
nozzle diameter,
 $\unicode[STIX]{x1D707}$
dynamic viscosity,
 $T$
temperature and
 $U_{j}$
the axial jet velocity on the centreline of the nozzle exit, respectively. Throughout this paper, the flow is non-dimensionalized by its nozzle exit values, pressure by
 $\unicode[STIX]{x1D70C}_{j}U_{j}^{2}$
, lengths by
 $D$
and time by
 $D/U_{j}$
. Frequencies are reported in terms of the Strouhal number
 $St=\unicode[STIX]{x1D714}/(2\unicode[STIX]{x03C0}M_{j})$
, where
 $\unicode[STIX]{x1D714}$
is the non-dimensional angular frequency. The parameters of the three simulations are listed in table 1:
 $p_{0}/p_{\infty }$
is the nozzle pressure ratio,
 $T_{0}/T_{\infty }$
the nozzle temperature ratio,
 $n_{cells}$
the number of control volumes,
 $\text{d}tc_{\infty }/D$
the computational time step and
 $t_{sim}/c_{\infty }D$
the total simulation time after the flow became stationary, i.e. without initial transients. The unstructured large-eddy simulation (LES) data are first interpolated onto a
 $n_{x}\times n_{r}\times n_{\unicode[STIX]{x1D703}}$
structured cylindrical grid spanning
 $x,r,\unicode[STIX]{x1D703}\in [0,30]\times [0,6]\times [0,2\unicode[STIX]{x03C0}]$
. Snapshots are saved with a temporal separation
 $\unicode[STIX]{x0394}tc_{\infty }/D$
(see table 2 below). For both the spectral analysis in § 3, and the resolvent model in § 4, we Reynolds-decompose a flow quantity
 $q$
into the long-time mean denoted by
 $\overline{(\cdot )}$
and the fluctuating part
 $(\cdot )^{\prime }$
as
 $$\begin{eqnarray}q(x,r,\unicode[STIX]{x1D703},t)=\overline{q}(x,r,\unicode[STIX]{x1D703})+q^{\prime }(x,r,\unicode[STIX]{x1D703},t).\end{eqnarray}$$
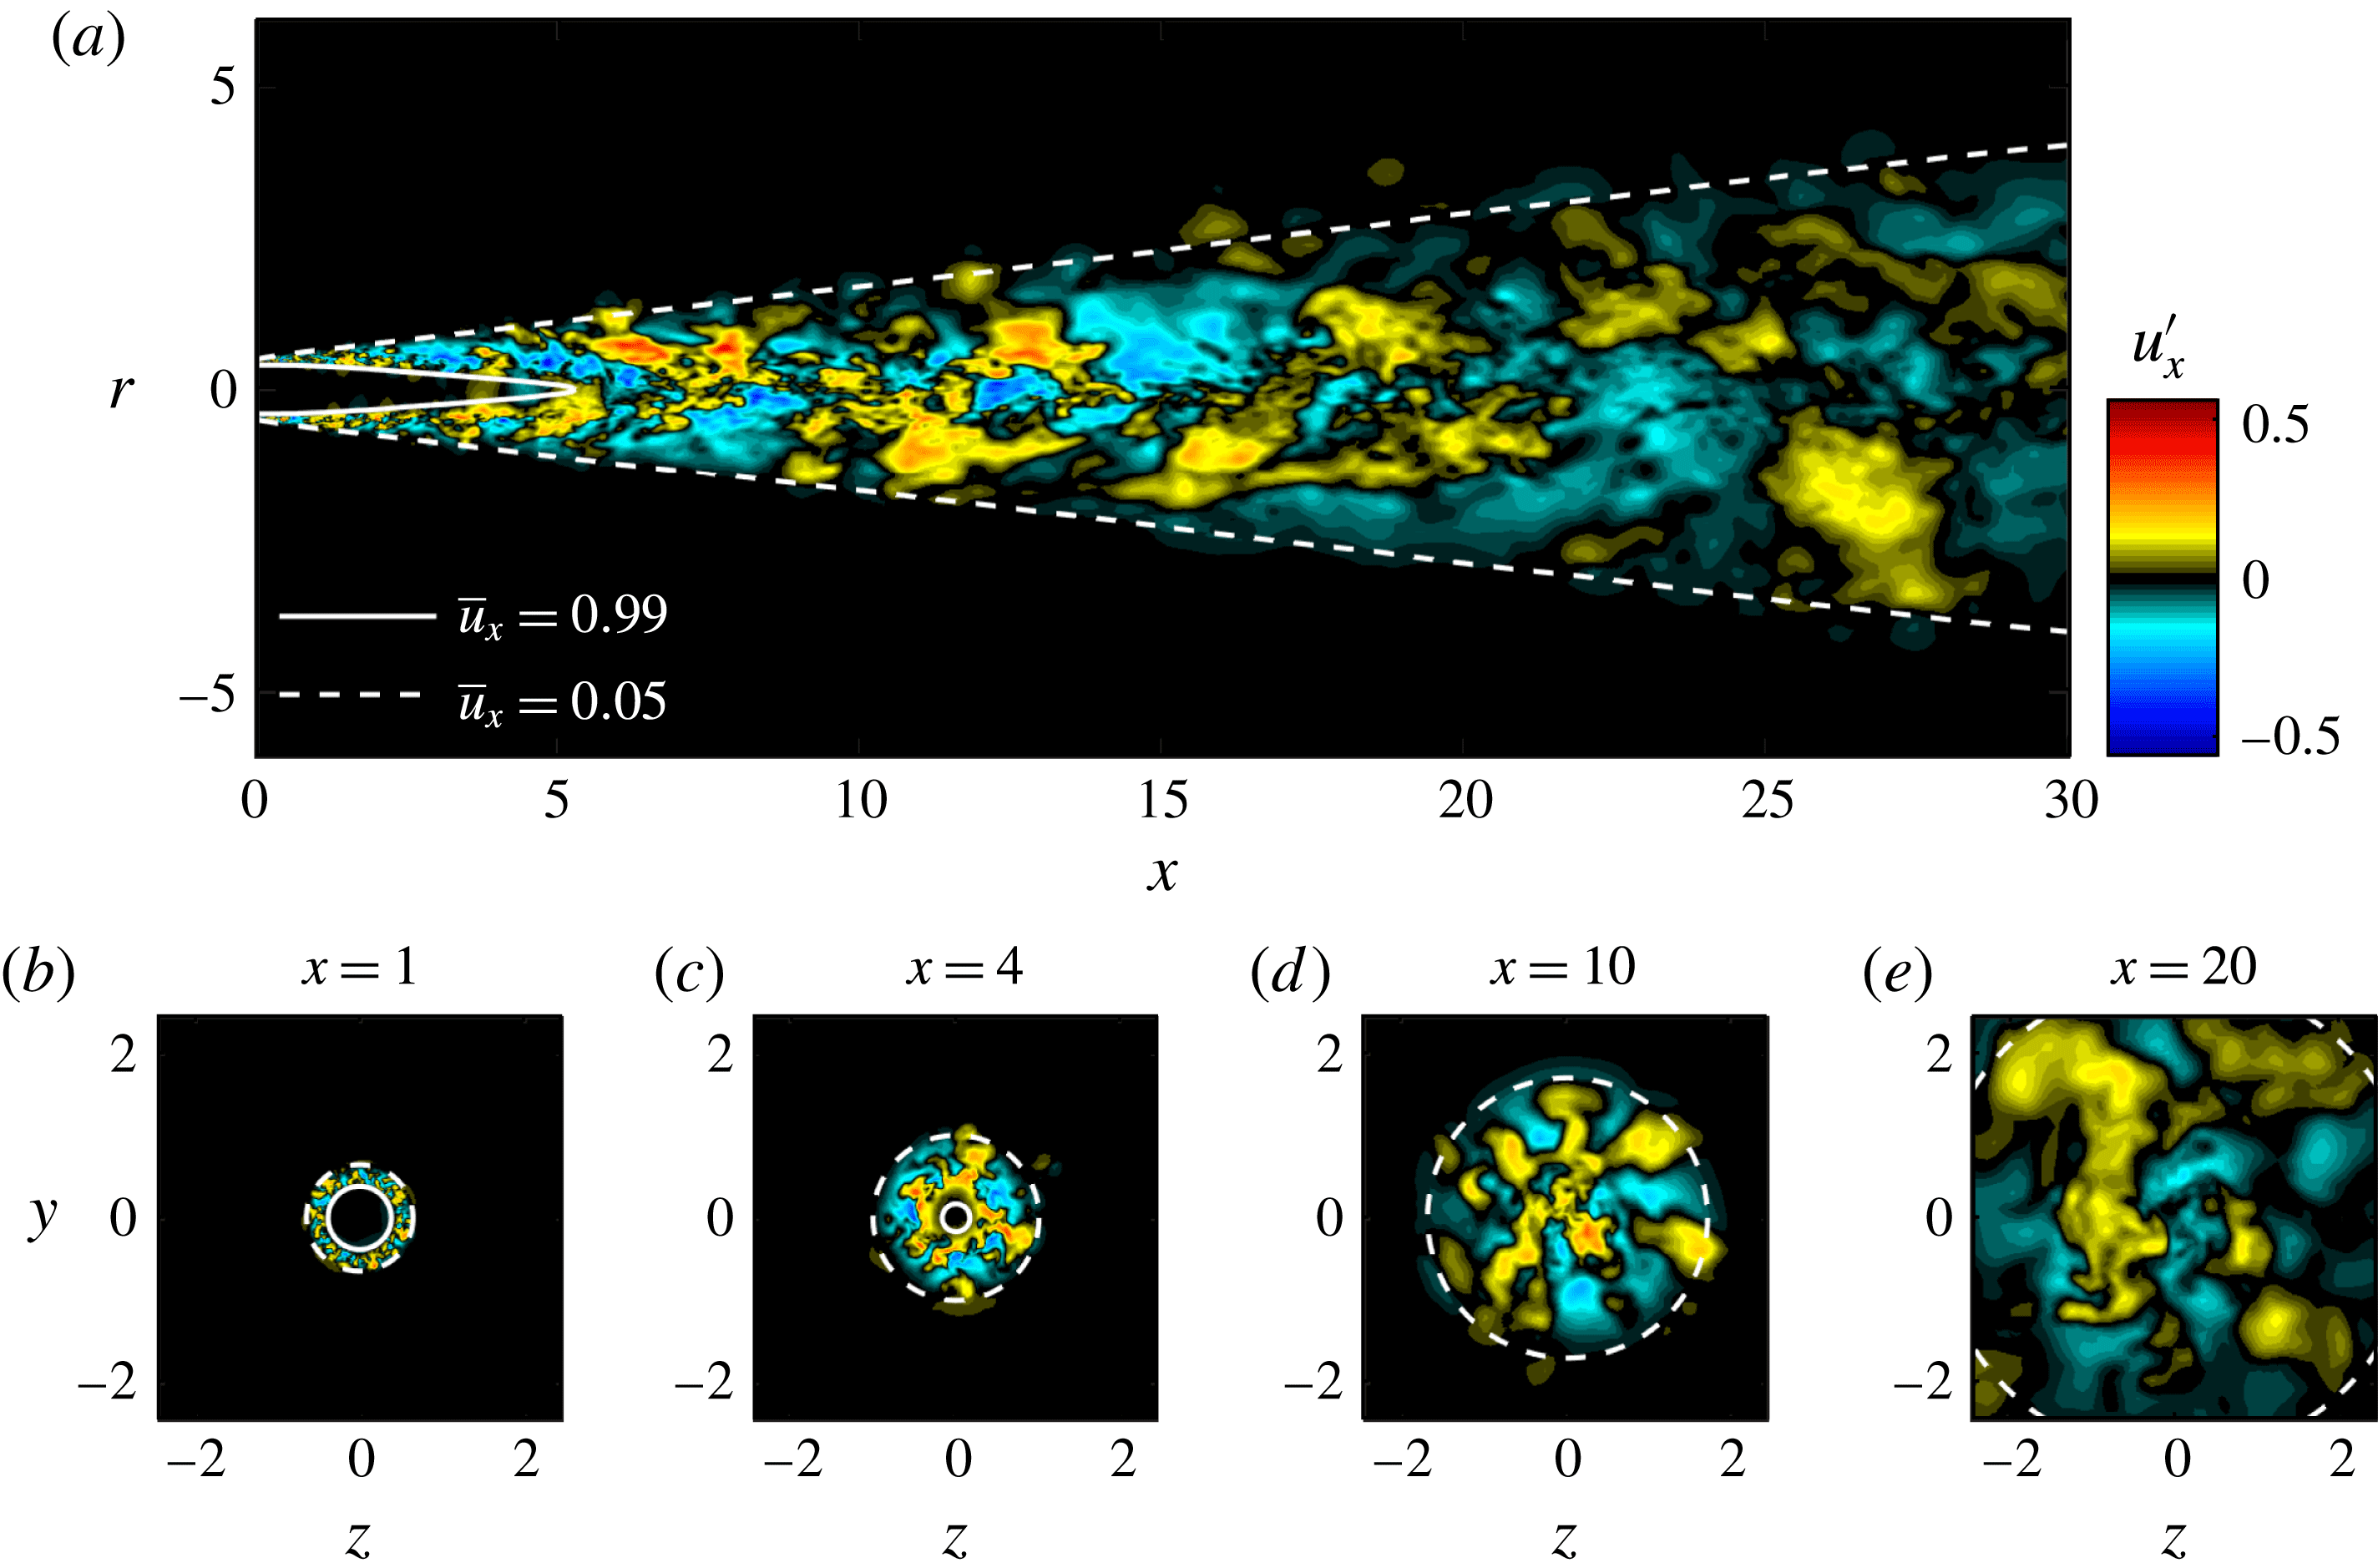
A visualization of the subsonic jet is shown in figure 1. Only the domain of interest for this study is shown (the full LES domain is much larger and includes flow within the nozzle as well as far-field sponge regions).
Instantaneous flow field of the subsonic jet: (a) streamwise cross-section along the jet axis; (b–e) transverse planes at different streamwise locations
 $x$
. The streamwise velocity fluctuation
 $u_{x}^{\prime }$
is shown. The potential core and the jet width are indicated as lines of constant
 $\bar{u}_{x}$
at 99 % and 5 % of the jet velocity
 $U_{j}$
, respectively.

Parameters of the large-eddy simulations.

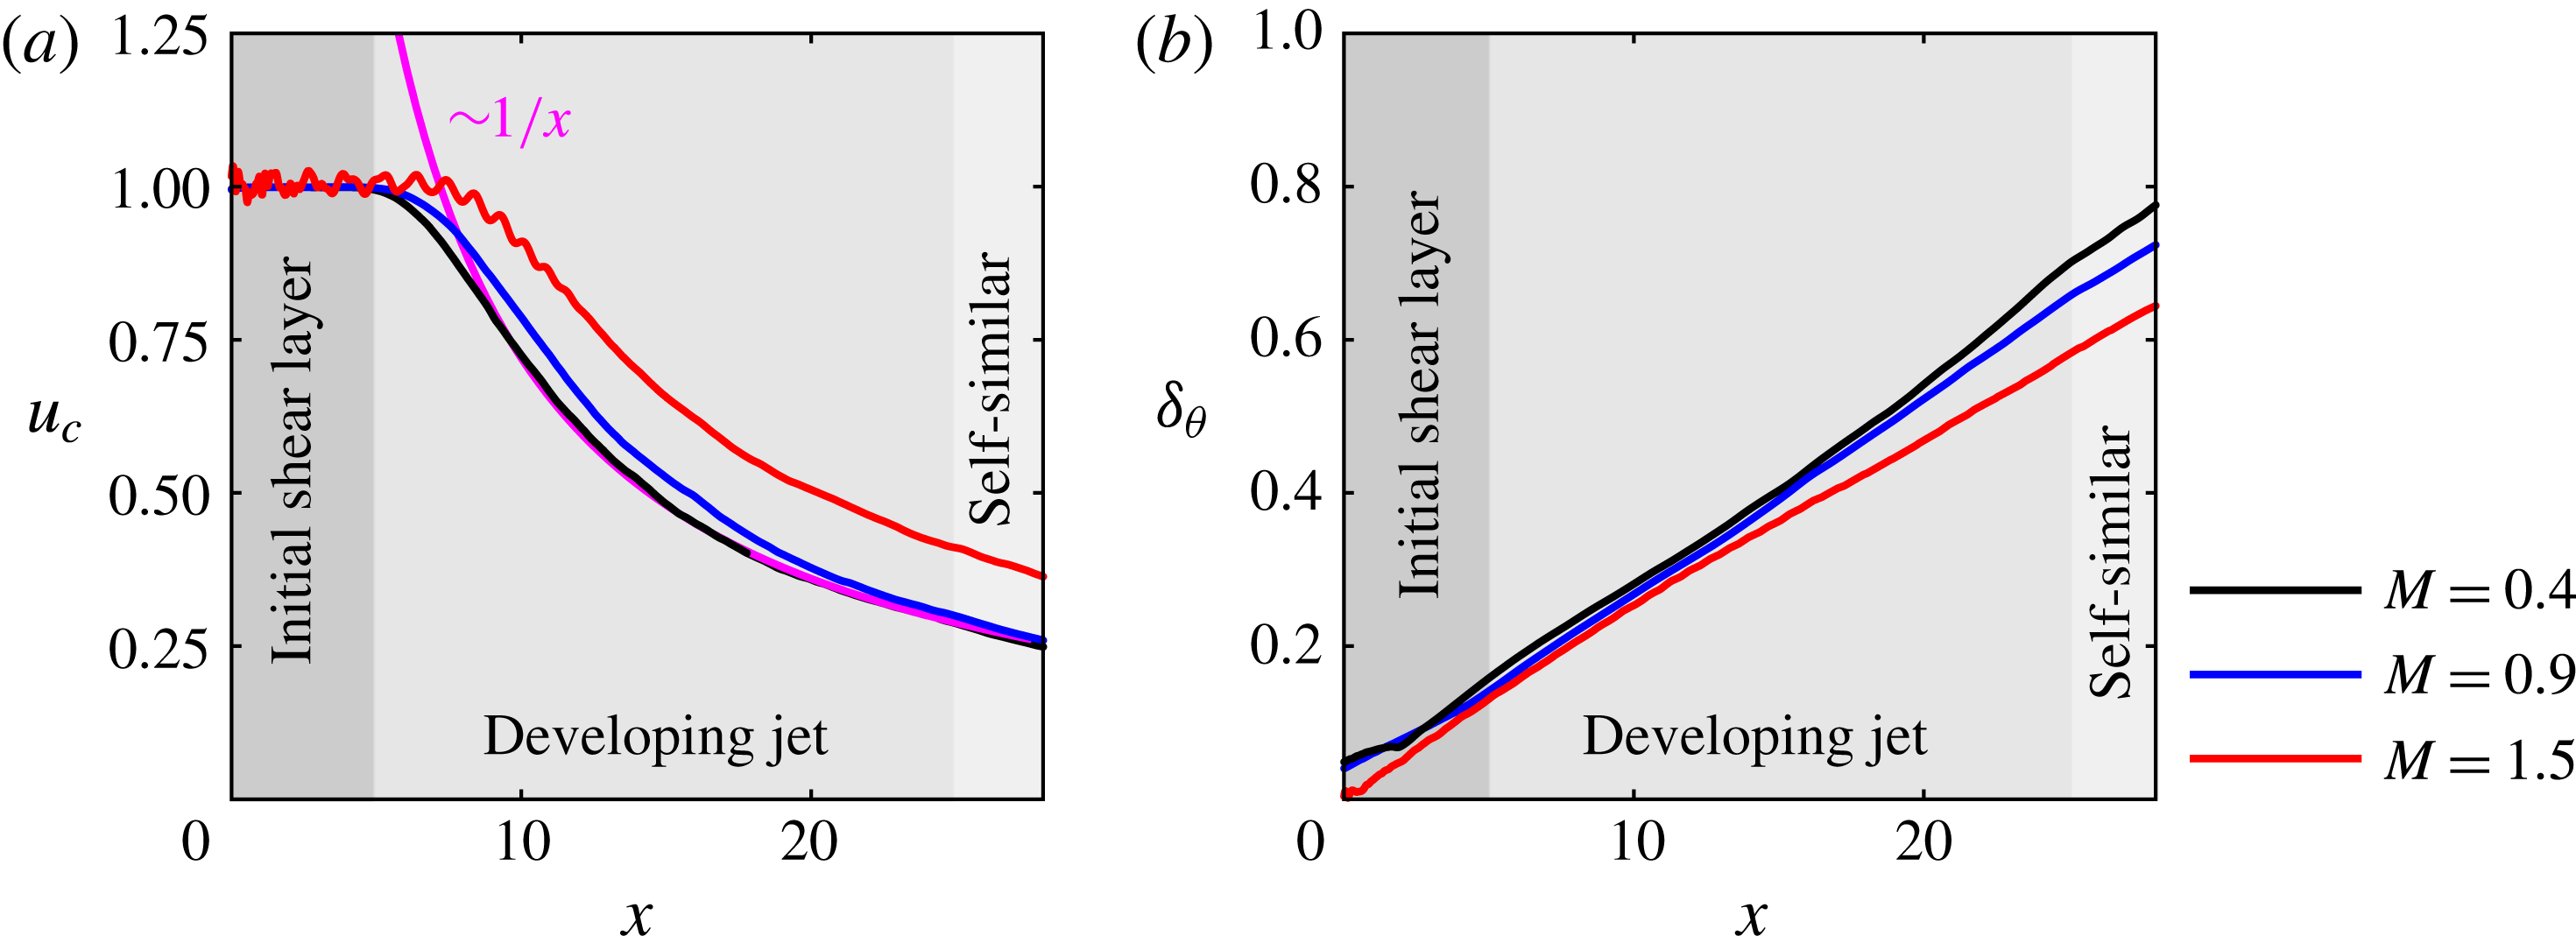
Mean-flow characteristics for the three jets: (a) centreline velocity
 $u_{c}=\overline{u}_{x}(x,r=0)$
; (b) momentum thickness
 $\unicode[STIX]{x1D6FF}_{\unicode[STIX]{x1D703}}=\int _{0}^{r_{1}}(\bar{\unicode[STIX]{x1D70C}}\bar{u}_{x}/\unicode[STIX]{x1D70C}_{c}u_{c})(1-\bar{u}_{x}/u_{c})\,\text{d}r$
, where the integral is taken from the centreline to
 $r_{1}$
defined as
 $\bar{u}_{x}(r_{1})=\bar{u}_{\infty }+0.01\bar{u}_{j}$
(the
 $\bar{u}_{\infty }$
term is included to account for a small coflow included in the simulations). The centreline velocity becomes inversely proportional to the axial distance shortly after the potential core, and the momentum thickness increases approximately linearly.
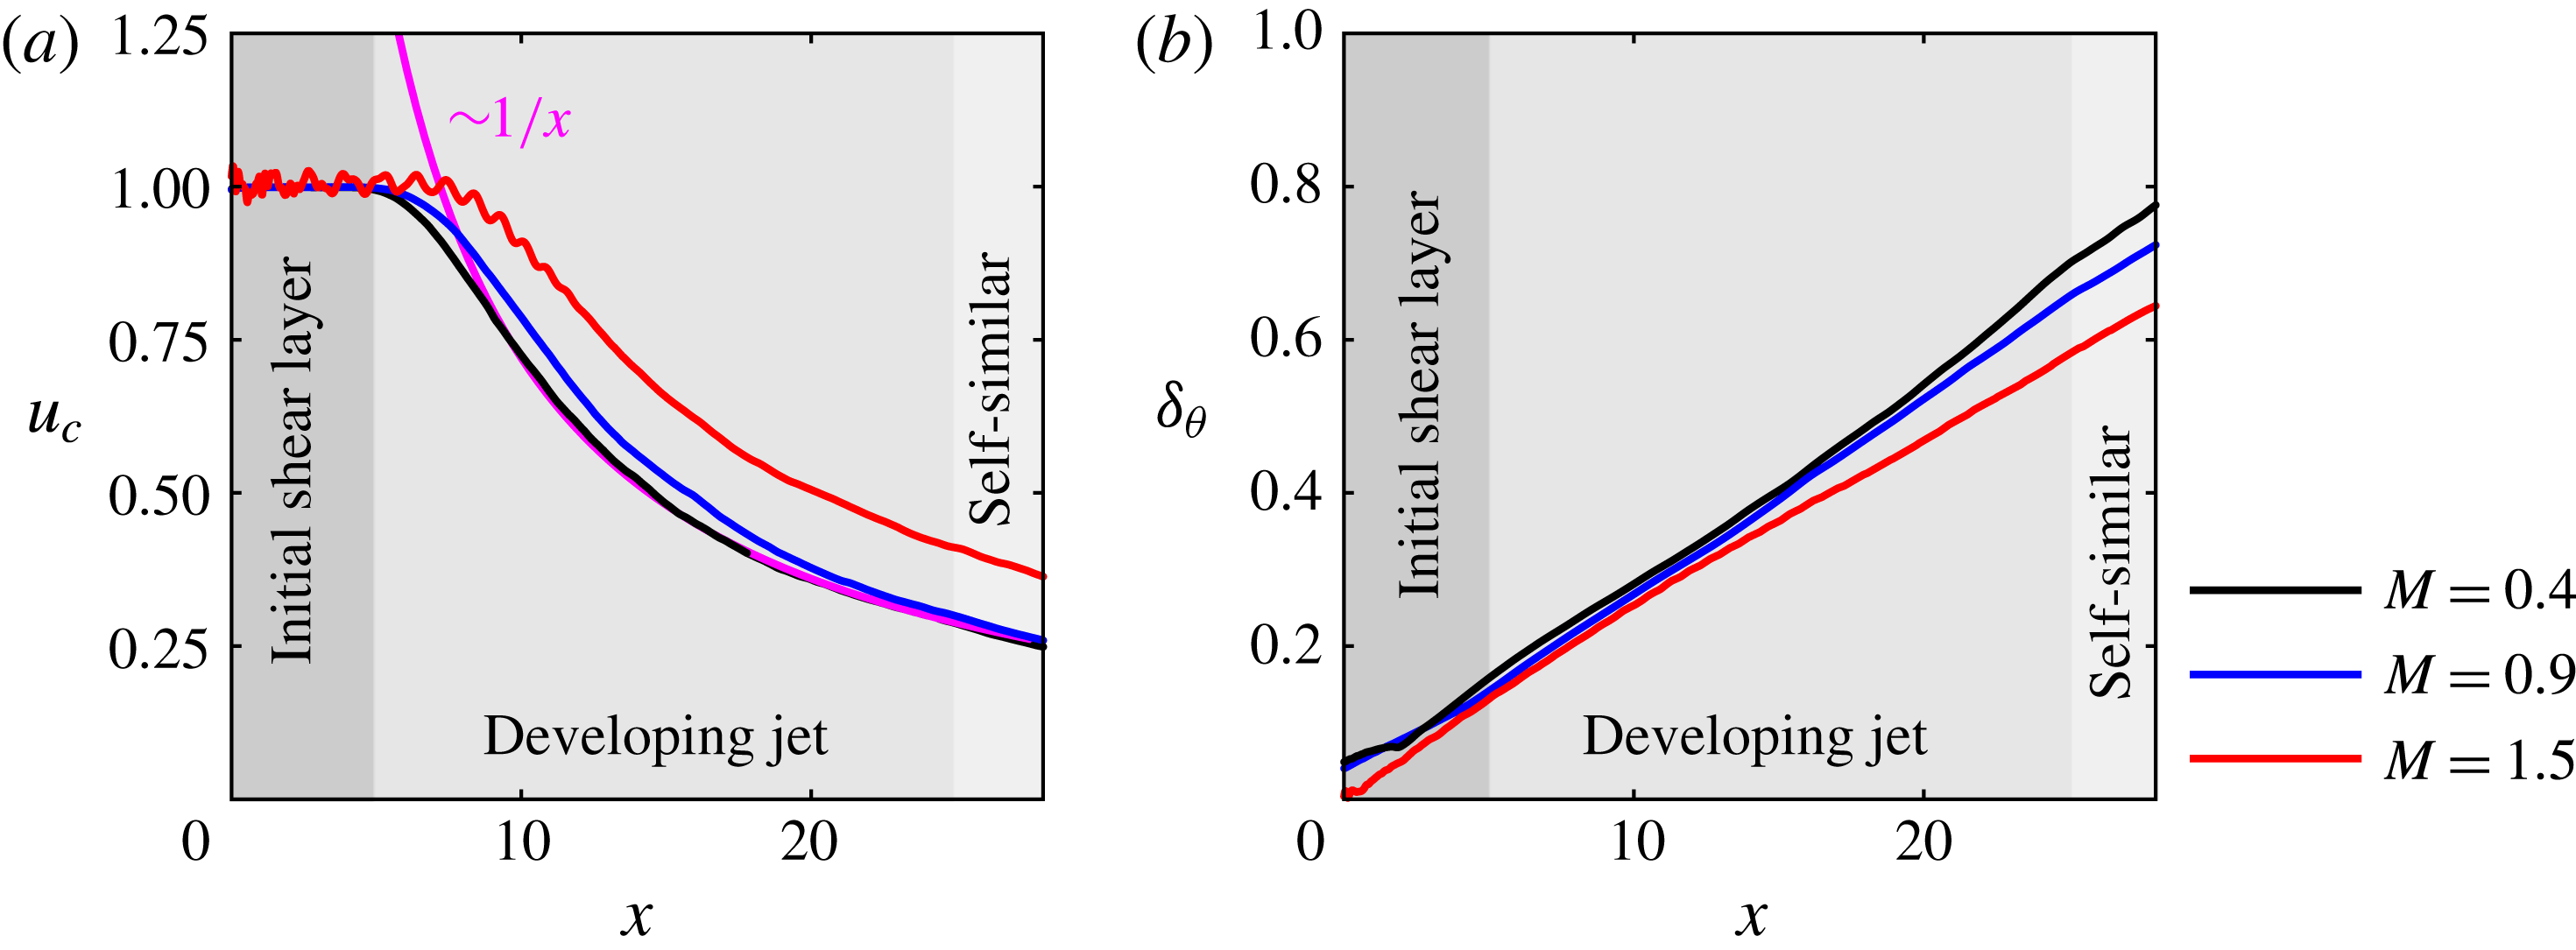
The mean centreline velocity of the three jets is compared in figure 2(a). The plateau close to the nozzle characterizes the potential core, whose length increases with Mach number. A weak residual shock pattern is observed for
 $x\lesssim 10$
in the supersonic case. The streamwise development of turbulent jets is usually described in terms of an initial development region (
 $0\lesssim x/D\lesssim 25$
), and a self-similar region (
 $x/D\gtrsim 25$
): see e.g. Pope (Reference Pope2000). In the latter, the jet is fully described by a self-similar velocity profile, and a constant spreading and velocity-decay rate. For a dynamical description of the flow, we further divide the initial development region into two parts. The initial shear-layer region extends up to the end of the potential core (
 $0\lesssim x/D\lesssim 5$
for
 $M=0.4$
) and is characterized by a constant velocity jump over the shear layer, and a linearly increasing shear-layer thickness. The developing jet region lies between the end of the potential core and the start of the self-similar region (
 $5\lesssim x/D\lesssim 25$
). In this region, the centreline velocity transitions rapidly to its asymptotic decaying behaviour. The mean radial velocity profile, on the other hand, has not yet converged to its self-similar downstream solution. The
 $1/x$
-scaling of the centreline velocity with streamwise distance (Pope Reference Pope2000) is indicated for the subsonic case. The momentum thickness shown in figure 2(b) increases approximately linearly in all three regions in all cases. These characteristic velocities and length scales in each region imply different frequency scalings that will become important later.
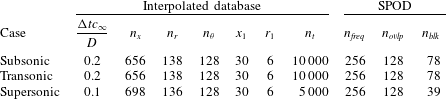
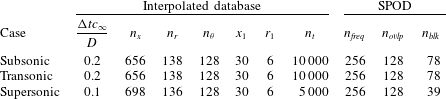
Parameters of the structured cylindrical grid of the interpolated database (left), and the SPOD parameters (right).
In §§ 3–5, we will focus on the
 $M=0.4$
jet as the main conclusions are similar for all three Mach number regimes, and we address Mach number effects in detail in § 6.
3 Spectral analysis of the LES data
In this section, we use spectral proper orthogonal decomposition (SPOD) to identify coherent structures within the three turbulent jets. This form of proper orthogonal decomposition (POD) identifies energy-ranked modes that each oscillate at a single frequency, are orthogonal to other modes at the same frequency and, as a set, optimally represent the space–time flow statistics. SPOD was introduced by Lumley (Reference Lumley, Yaglom and Tatarski1967, Reference Lumley1970) but has been used sparingly compared to the common spatial form of POD (Sirovich Reference Sirovich1987; Aubry Reference Aubry1991) and dynamic mode decomposition (Schmid Reference Schmid2010). However, recent work by Towne et al. (Reference Towne, Schmidt and Colonius2018) showed that SPOD combines the advantages of these other two methods – SPOD modes represent coherent structures that are dynamically significant and optimally account for the random nature of turbulent flows. This makes SPOD an ideal tool for identifying coherent structures within the turbulent jets considered in this paper.
We seek modes that are orthogonal in the inner product
 $$\begin{eqnarray}\langle \boldsymbol{q}_{1},\boldsymbol{q}_{2}\rangle _{E}=\iiint \boldsymbol{q}_{1}^{\ast }\text{diag}\left(\frac{\overline{T}}{\unicode[STIX]{x1D6FE}\overline{\unicode[STIX]{x1D70C}}M^{2}},\overline{\unicode[STIX]{x1D70C}},\overline{\unicode[STIX]{x1D70C}},\overline{\unicode[STIX]{x1D70C}},\frac{\overline{\unicode[STIX]{x1D70C}}}{\unicode[STIX]{x1D6FE}(\unicode[STIX]{x1D6FE}-1)\overline{T}M^{2}}\right)\boldsymbol{q}_{2}r\,\text{d}x\,\text{d}r\,\text{d}\unicode[STIX]{x1D703},\end{eqnarray}$$
which are optimal in an induced compressible energy norm
 $\langle \cdot ,\cdot \rangle _{E}$
(Chu Reference Chu1965). The energy weights are defined for the state vector
 $\boldsymbol{q}=[\unicode[STIX]{x1D70C},u_{x},u_{r},u_{\unicode[STIX]{x1D703}},T]^{\text{T}}(x,r,\unicode[STIX]{x1D703},t)$
of primitive variables, density
 $\unicode[STIX]{x1D70C}$
, cylindrical velocity components
 $u_{x}$
,
 $u_{r}$
and
 $u_{\unicode[STIX]{x1D703}}$
, and temperature
 $T$
. The notation
 $(\cdot )^{\ast }$
indicates the Hermitian transpose. We discretize the inner product defined by (3.1) as
 $$\begin{eqnarray}\langle \boldsymbol{q}_{1},\boldsymbol{q}_{2}\rangle _{E}=\boldsymbol{q}_{1}^{\ast }\unicode[STIX]{x1D652}\boldsymbol{q}_{2},\end{eqnarray}$$
where the weight matrix
 $\unicode[STIX]{x1D652}$
accounts for both numerical quadrature weights and the energy weights. Since the jet is stationary and symmetric with respect to rotation about the jet axis, it can be decomposed into azimuthal Fourier modes
 $\hat{(\cdot )}_{m}$
of azimuthal wavenumber
 $m$
, temporal Fourier modes
 $\hat{(\cdot )}_{\unicode[STIX]{x1D714}}$
of angular frequency
 $\unicode[STIX]{x1D714}$
or combined spatio-temporal Fourier modes Fourier modes
 $\hat{(\cdot )}_{m\unicode[STIX]{x1D714}}$
as
 $$\begin{eqnarray}\boldsymbol{q}(x,r,\unicode[STIX]{x1D703},t)=\mathop{\sum }_{m}\hat{\boldsymbol{q}}_{m}(x,r,t)\text{e}^{\text{i}m\unicode[STIX]{x1D703}}=\mathop{\sum }_{\unicode[STIX]{x1D714}}\hat{\boldsymbol{q}}_{\unicode[STIX]{x1D714}}(x,r,\unicode[STIX]{x1D703})\text{e}^{\text{i}\unicode[STIX]{x1D714}t}=\mathop{\sum }_{m}\mathop{\sum }_{\unicode[STIX]{x1D714}}\hat{\boldsymbol{q}}(x,r)\text{e}^{\text{i}m\unicode[STIX]{x1D703}}\text{e}^{\text{i}\unicode[STIX]{x1D714}t}.\end{eqnarray}$$
To calculate the SPOD, the data are first segmented into sequences
 $\unicode[STIX]{x1D64C}=$
 $[\boldsymbol{q}^{(1)}\boldsymbol{q}^{(2)}\cdots \boldsymbol{q}^{(n_{freq})}]$
each containing
 $n_{freq}$
instantaneous snapshots of
 $\boldsymbol{q}$
which are considered to be statistically independent realizations of the flow under the ergodic hypothesis. Details of the interpolated databases and spectral estimation parameters are listed in table 2.
The spatio-temporal Fourier transform of the
 $l$
th block is obtained by first computing the discrete Fourier transform (DFT) in the time direction, i.e. along the rows of
 $\unicode[STIX]{x1D64C}$
. This allows us to restrict the analysis to positive frequencies, as the LES data are real. Subsequently, the DFT of the complex temporally decomposed data is taken in the circumferential direction, yielding a spectrum of positive and negative
 $m$
, which is, however, approximately symmetric due to rotational symmetry. In practice, this procedure is most conveniently achieved by storing the raw data
 $\unicode[STIX]{x1D64C}$
as a three-dimensional array. The spatio-temporal Fourier transform yields the ensemble
 $\hat{\unicode[STIX]{x1D64C}}_{m\unicode[STIX]{x1D714}_{k}}^{(l)}=[\hat{\boldsymbol{q}}_{m\unicode[STIX]{x1D714}_{1}}^{(l)}\hat{\boldsymbol{q}}_{m\unicode[STIX]{x1D714}_{2}}^{(l)}\cdots \hat{\boldsymbol{q}}_{m\unicode[STIX]{x1D714}_{n_{freq}}}^{(l)}]$
of Fourier realizations, where
 $\hat{\boldsymbol{q}}_{m\unicode[STIX]{x1D714}_{k}}^{(l)}$
is the
 $l$
th realization of the Fourier transform at the
 $k$
th discrete frequency. A periodic Hann window is used to minimize spectral leakage. The ensemble of
 $n_{blk}$
Fourier realizations of the flow at a given frequency
 $\unicode[STIX]{x1D714}_{k}$
and azimuthal wavenumber
 $m$
are now collected into a data matrix
 $\hat{\unicode[STIX]{x1D64C}}_{m\unicode[STIX]{x1D714}_{k}}=[\hat{\boldsymbol{q}}_{m\unicode[STIX]{x1D714}_{k}}^{(1)}\hat{\boldsymbol{q}}_{m\unicode[STIX]{x1D714}_{k}}^{(2)}\cdots \hat{\boldsymbol{q}}_{m\unicode[STIX]{x1D714}_{k}}^{(n_{blk})}]$
. For a particular
 $m$
and
 $\unicode[STIX]{x1D714}_{k}$
, the SPOD modes are found as the eigenvectors
 $\unicode[STIX]{x1D733}_{m\unicode[STIX]{x1D714}_{k}}=[\unicode[STIX]{x1D74D}_{m\unicode[STIX]{x1D714}_{k}}^{(1)}\unicode[STIX]{x1D74D}_{m\unicode[STIX]{x1D714}_{k}}^{(2)}\cdots \unicode[STIX]{x1D74D}_{m\unicode[STIX]{x1D714}_{l}}^{(n_{blk})}]$
, and the modal energy as the corresponding eigenvalues
 $\unicode[STIX]{x1D726}_{m\unicode[STIX]{x1D714}_{k}}=\text{diag}(\unicode[STIX]{x1D706}_{m\unicode[STIX]{x1D714}_{k}}^{(1)},\unicode[STIX]{x1D706}_{m\unicode[STIX]{x1D714}_{k}}^{(2)},\ldots ,\unicode[STIX]{x1D706}_{m\unicode[STIX]{x1D714}_{k}}^{(n_{blk})})$
of the weighted cross-spectral density matrix
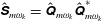 $\hat{\unicode[STIX]{x1D64E}}_{m\unicode[STIX]{x1D714}_{k}}=\hat{\unicode[STIX]{x1D64C}}_{m\unicode[STIX]{x1D714}_{k}}\hat{\unicode[STIX]{x1D64C}}_{m\unicode[STIX]{x1D714}_{k}}^{\ast }$
as
 $$\begin{eqnarray}\hat{\unicode[STIX]{x1D64E}}_{m\unicode[STIX]{x1D714}_{k}}\unicode[STIX]{x1D652}\unicode[STIX]{x1D733}_{m\unicode[STIX]{x1D714}_{k}}=\unicode[STIX]{x1D733}_{m\unicode[STIX]{x1D714}_{k}}\unicode[STIX]{x1D726}_{m\unicode[STIX]{x1D714}_{k}}.\end{eqnarray}$$
The modes are sorted by decreasing energy, i.e.
 $\unicode[STIX]{x1D706}_{m\unicode[STIX]{x1D714}_{k}}^{(1)}\geqslant \unicode[STIX]{x1D706}_{m\unicode[STIX]{x1D714}_{k}}^{(2)}\geqslant \cdots \geqslant \unicode[STIX]{x1D706}_{m\unicode[STIX]{x1D714}_{k}}^{(n_{blk})}$
. This formulation guarantees that the SPOD modes have the desired orthonormality property
 $\langle \unicode[STIX]{x1D74D}_{m\unicode[STIX]{x1D714}_{k}}^{(i)},\unicode[STIX]{x1D74D}_{m\unicode[STIX]{x1D714}_{k}}^{(j)}\rangle _{E}=\unicode[STIX]{x1D6FF}_{ij}$
, where
 $\unicode[STIX]{x1D6FF}_{ij}$
is the Kronecker delta function, and are optimal in terms of modal energy in the norm induced by (3.2). For brevity, we denote the
 $l$
th eigenvalue and the pressure component of the corresponding eigenmode as
 $\unicode[STIX]{x1D706}_{l}$
and
 $\unicode[STIX]{x1D713}_{p}^{(l)}$
, respectively. The dependence on a specific azimuthal wavenumber and frequency is implied and given in the description. Since the SPOD modes are optimal in terms of energy, we sometimes refer to the first SPOD mode as the leading or optimal mode and to the subsequent lower-energy modes as suboptimal modes.
Since we wish to express the data in terms of modes that oscillate at real and positive frequencies, we take the temporal Fourier transform in (3.3) first. Statistical homogeneity in
 $\unicode[STIX]{x1D703}$
implies that averaged quantities are the same for any
 $\pm m$
. After verifying statistical convergence, we add the contributions of positive and negative
 $m$
.
The distribution of power into the frequency components a signal is composed of is referred to as its power spectrum. Power spectra are commonly expressed in terms of the power spectral density (PSD), which we will introduce later in (3.5). In the context of SPOD, we are interested in finding a graphical representation that can be interpreted in a similar way. In each frequency bin, the discrete SPOD spectrum is represented by the decreasing energy levels of the corresponding set of eigenfunctions. There is no obvious continuity in the modal structure of the most energetic mode (or any other) from one frequency bin to the next. Nevertheless, it is instructive to examine how the modal energy changes as a function of frequency, so that in what follows we plot the SPOD eigenvalues for each mode
 $l$
as functions
 $\unicode[STIX]{x1D706}_{l}(St)$
of frequency and refer to the resulting curves as the SPOD eigenvalue spectra.
SPOD eigenvalue spectra (

 $\unicode[STIX]{x1D706}_{1}>\unicode[STIX]{x1D706}_{2}>\cdots >\unicode[STIX]{x1D706}_{N}$
) for the subsonic jet: (a)
 $m=0$
; (b)
 $m=1$
; (c)
 $m=2$
; (d)
 $m=3$
. For,
 $m>0$
, the positive and negative azimuthal wavenumber components are summed. Red shaded areas (▪ red) highlight the separation between the first and second modes.
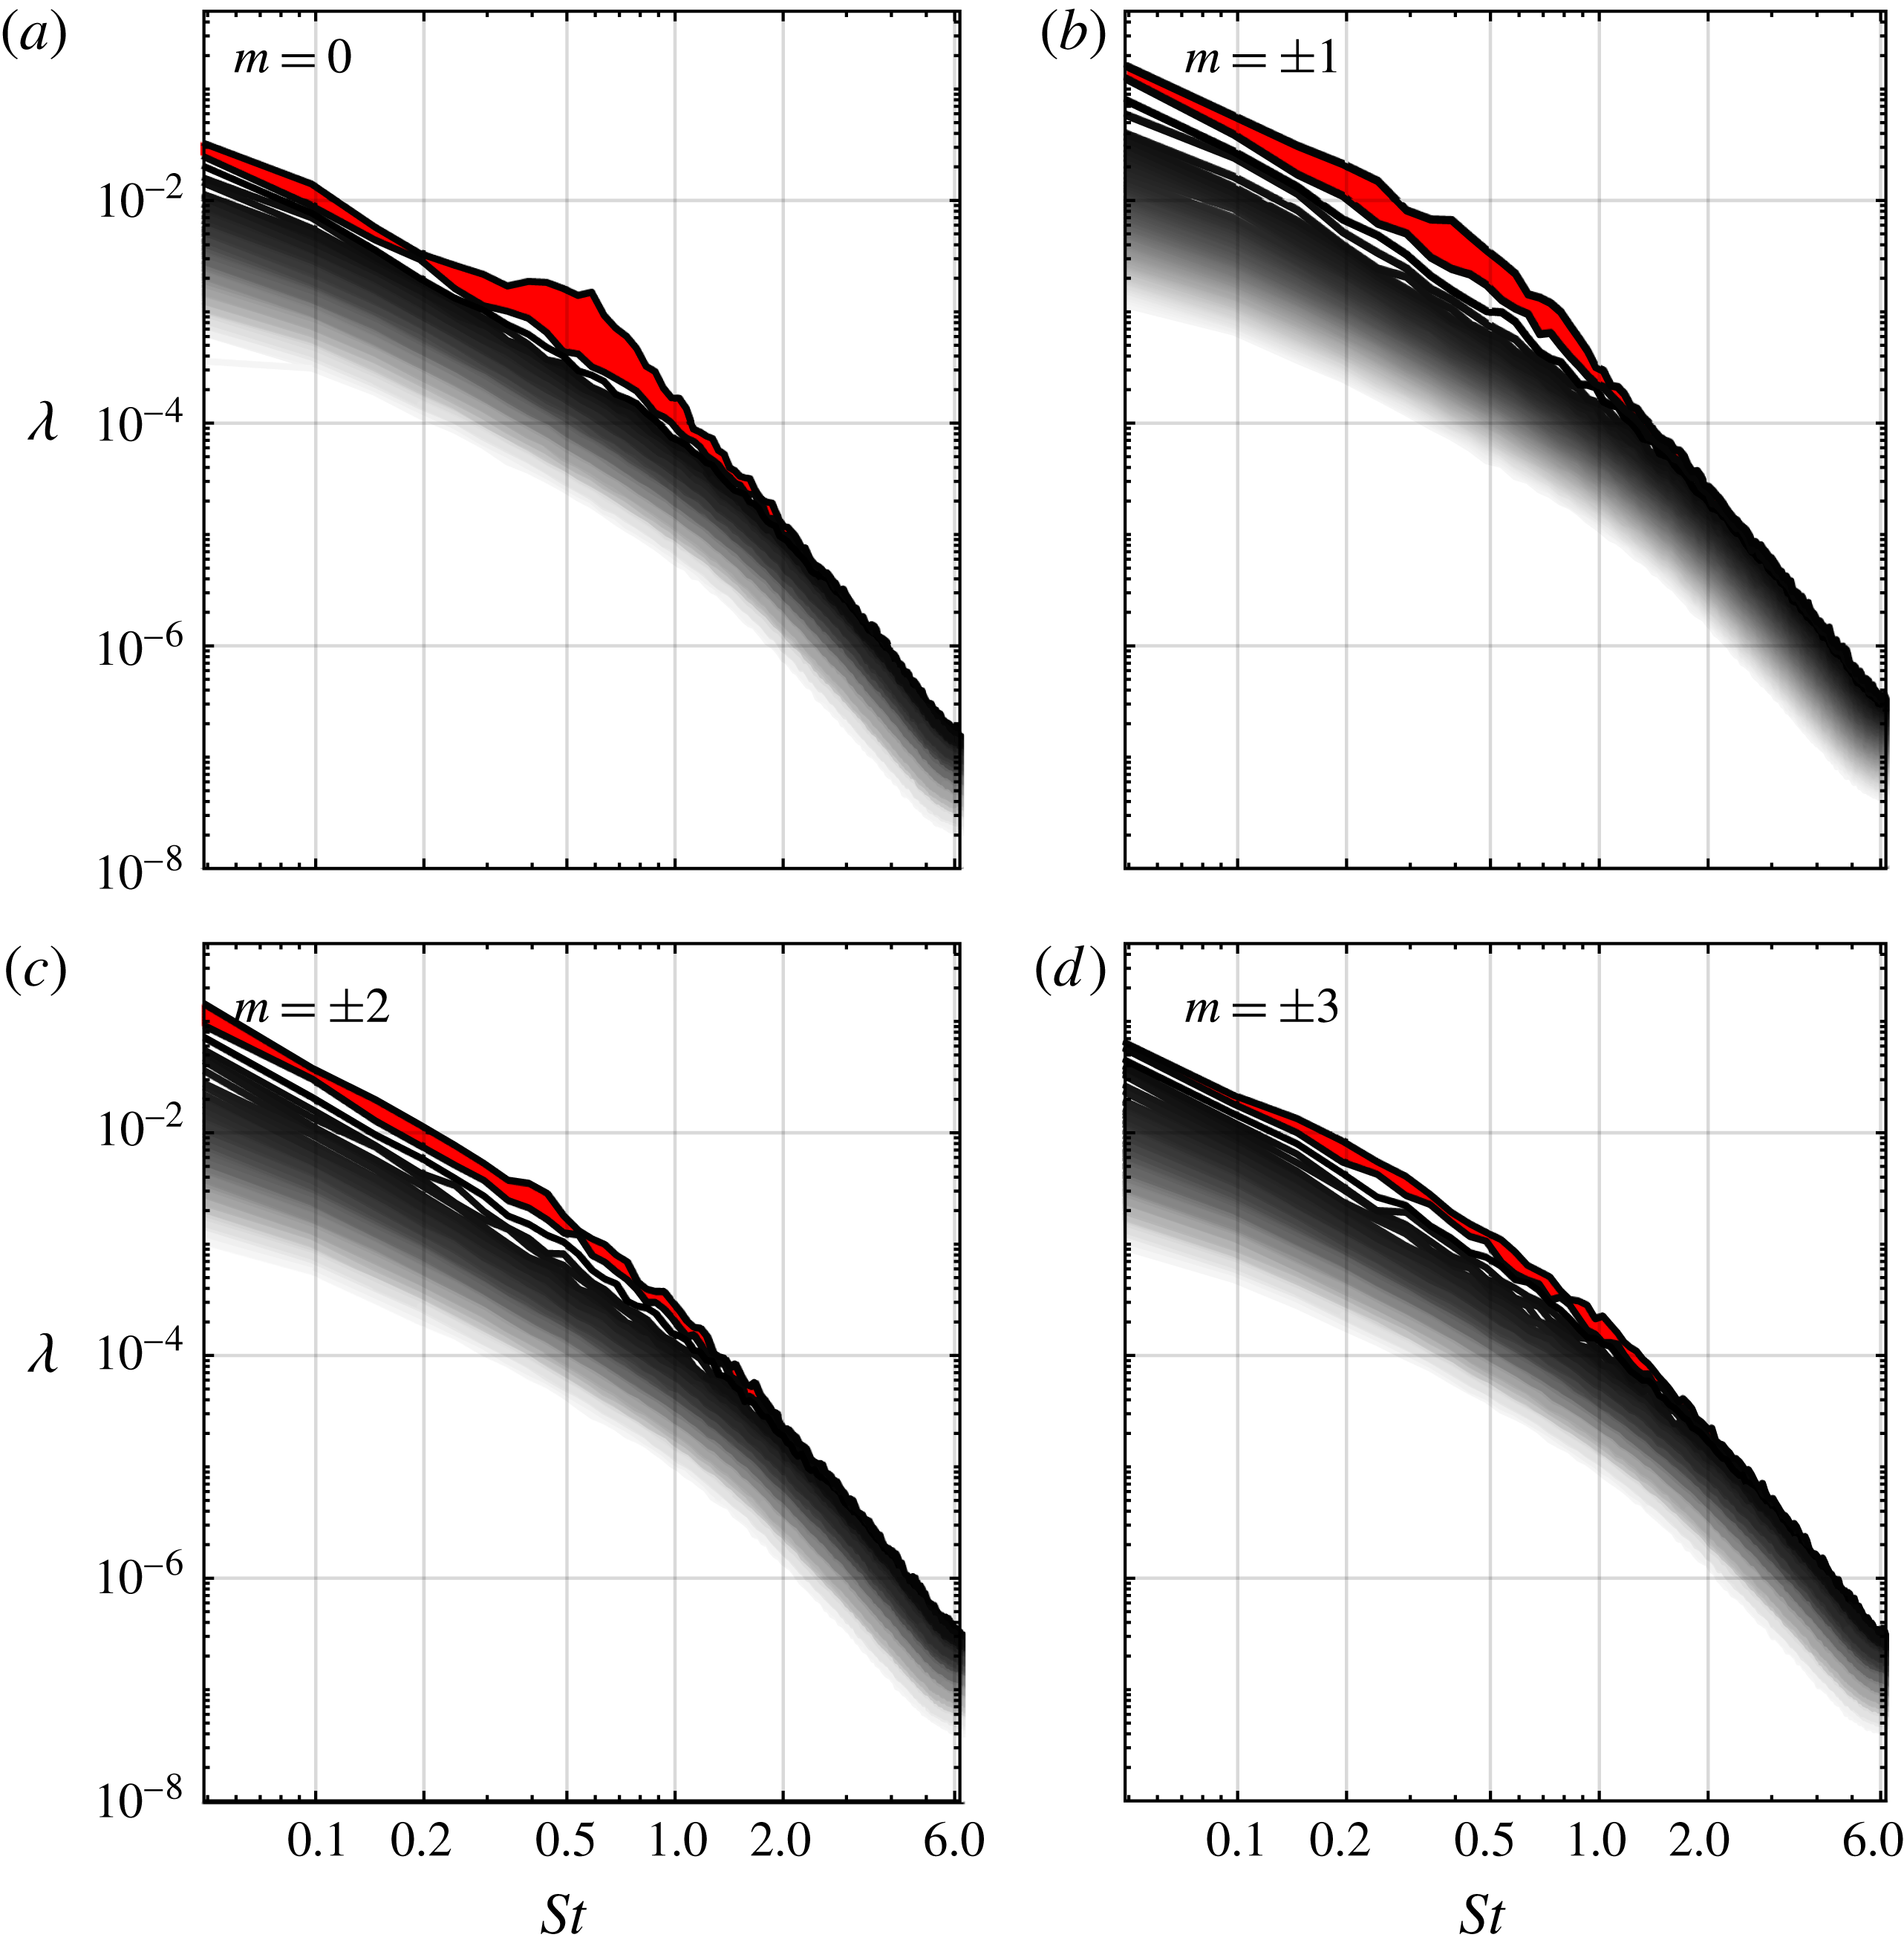
The SPOD eigenvalue spectrum of the axisymmetric component of the subsonic jet is shown in figure 3(a). The red shaded area highlights the separation between the first and second modes. A large separation indicates that the leading mode is significantly more energetic than the others. When this occurs, the physical mechanism associated with the first mode is prevalent, and we say that the flow exhibits low-rank behaviour.
The low-rank behaviour is apparent over the frequency band
 $0.2\lesssim St\lesssim 2$
, and peaks at
 $St\approx 0.6$
. It is most pronounced for
 $m=0$
and
 $m=1$
, shown in figures 3(a) and 3(b), respectively. With increasing azimuthal wavenumber, the low-rank behaviour becomes less and less pronounced. For
 $m=1$
, the dominance of the optimal gain persists to low frequencies, whereas it cuts off below
 $St\approx 0.2$
for
 $m=0$
. For
 $m=2$
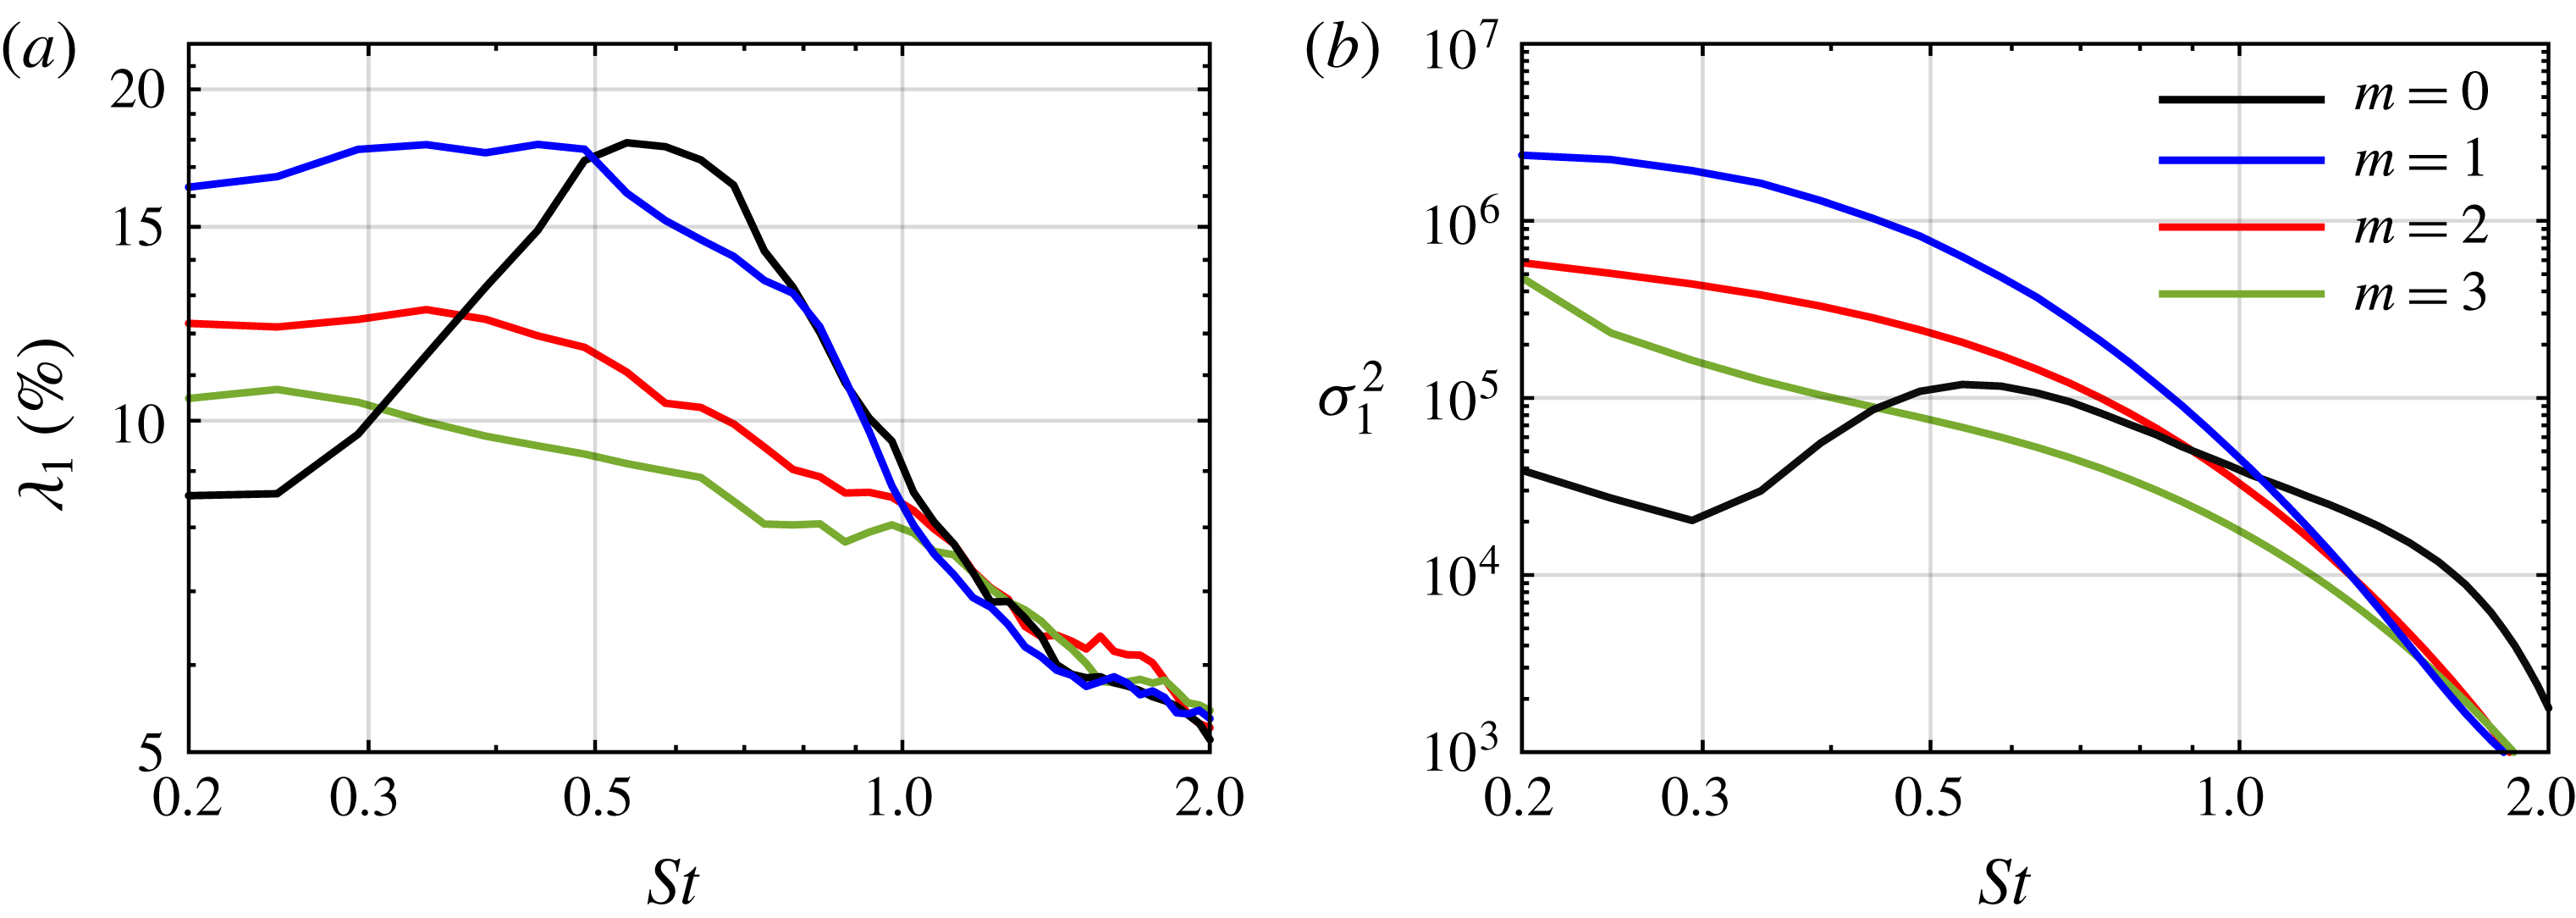
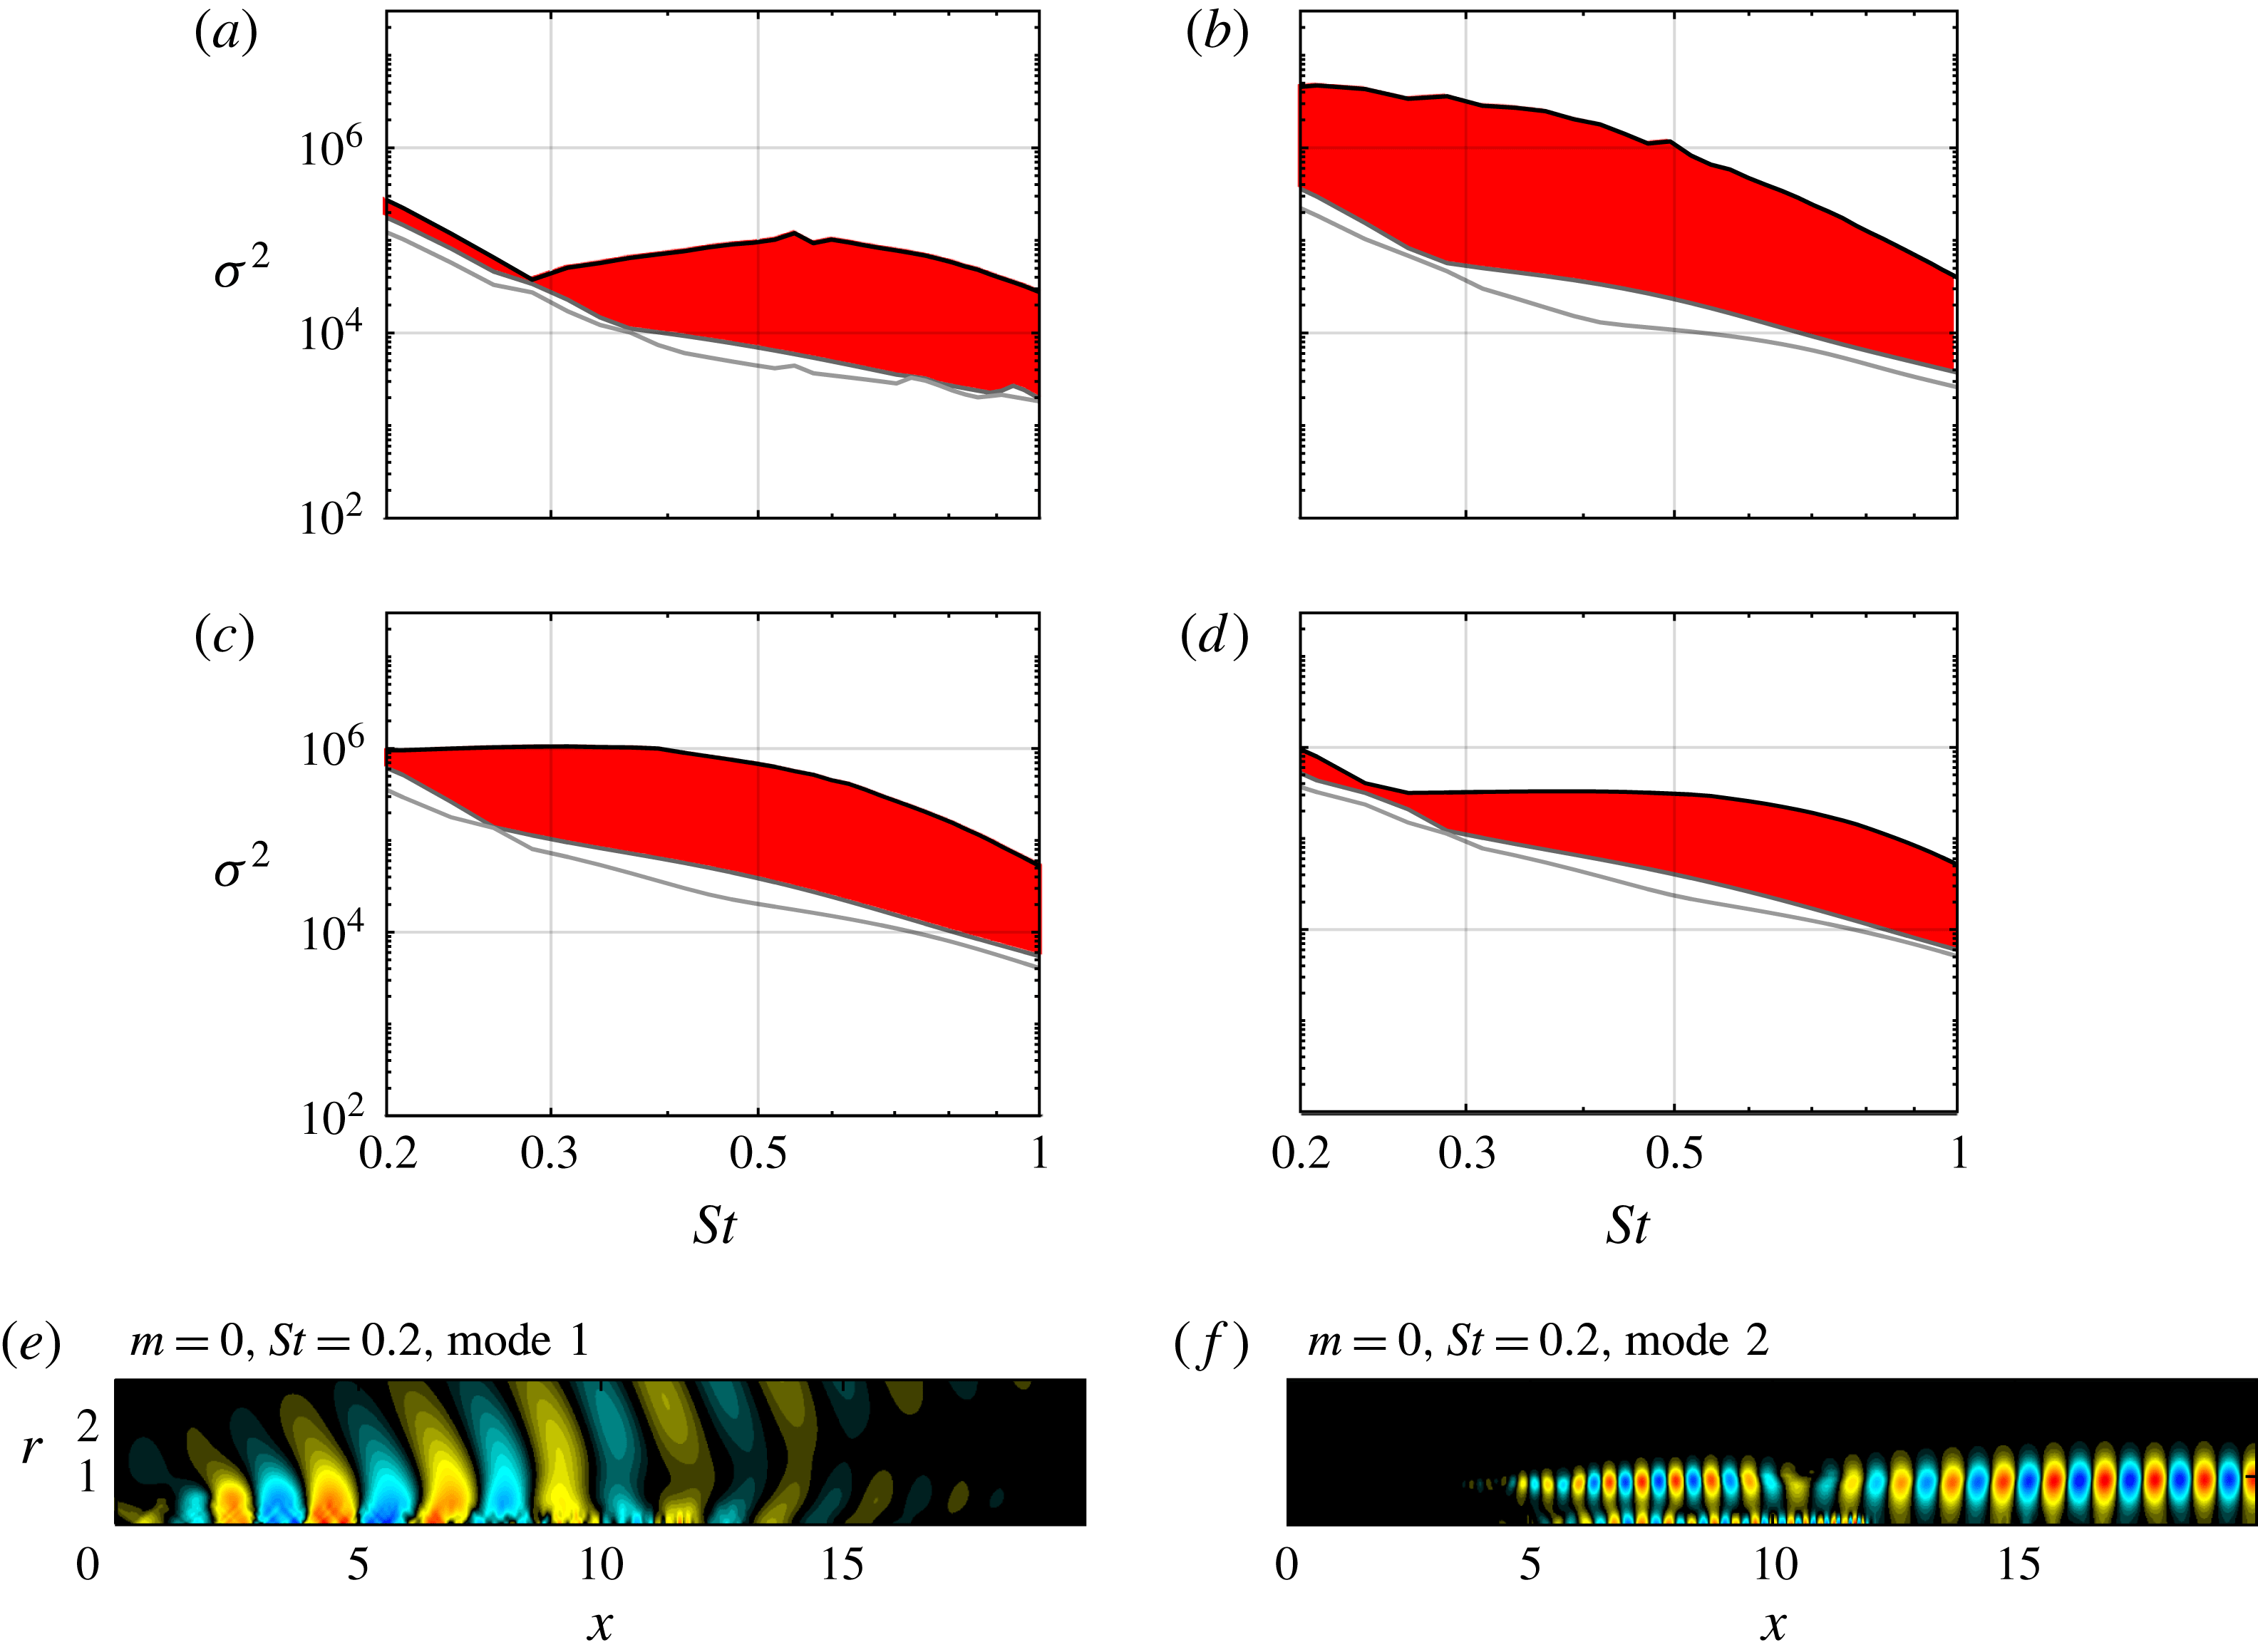
in figure 3(c), the eigenvalue separation is less distinct, but a visual inspection of modes confirmed that the leading mode is of the same physical nature for all frequencies. These results should be compared with the optimal gain spectra shown in figure 8. The corresponding spectra for the transonic and supersonic cases are reported in the Appendix (figures 18 and 20).
Comparison between SPOD mode 1 (a,c,e,g,i,k,m,o) and SPOD mode 2 (b,d,f,h,j,l,n,p) at two representative frequencies for the subsonic jet: (a–d)
 $m=0$
; (e–h)
 $m=1$
; (i–l)
 $m=2$
; (m–p)
 $m=3$
. The normalized pressure component (

 $-1<\unicode[STIX]{x1D713}_{p}/\Vert \unicode[STIX]{x1D713}_{p}\Vert _{\infty }<1$
) is shown in
 $x,r\in [0\;20]\times [0\;3]$
.
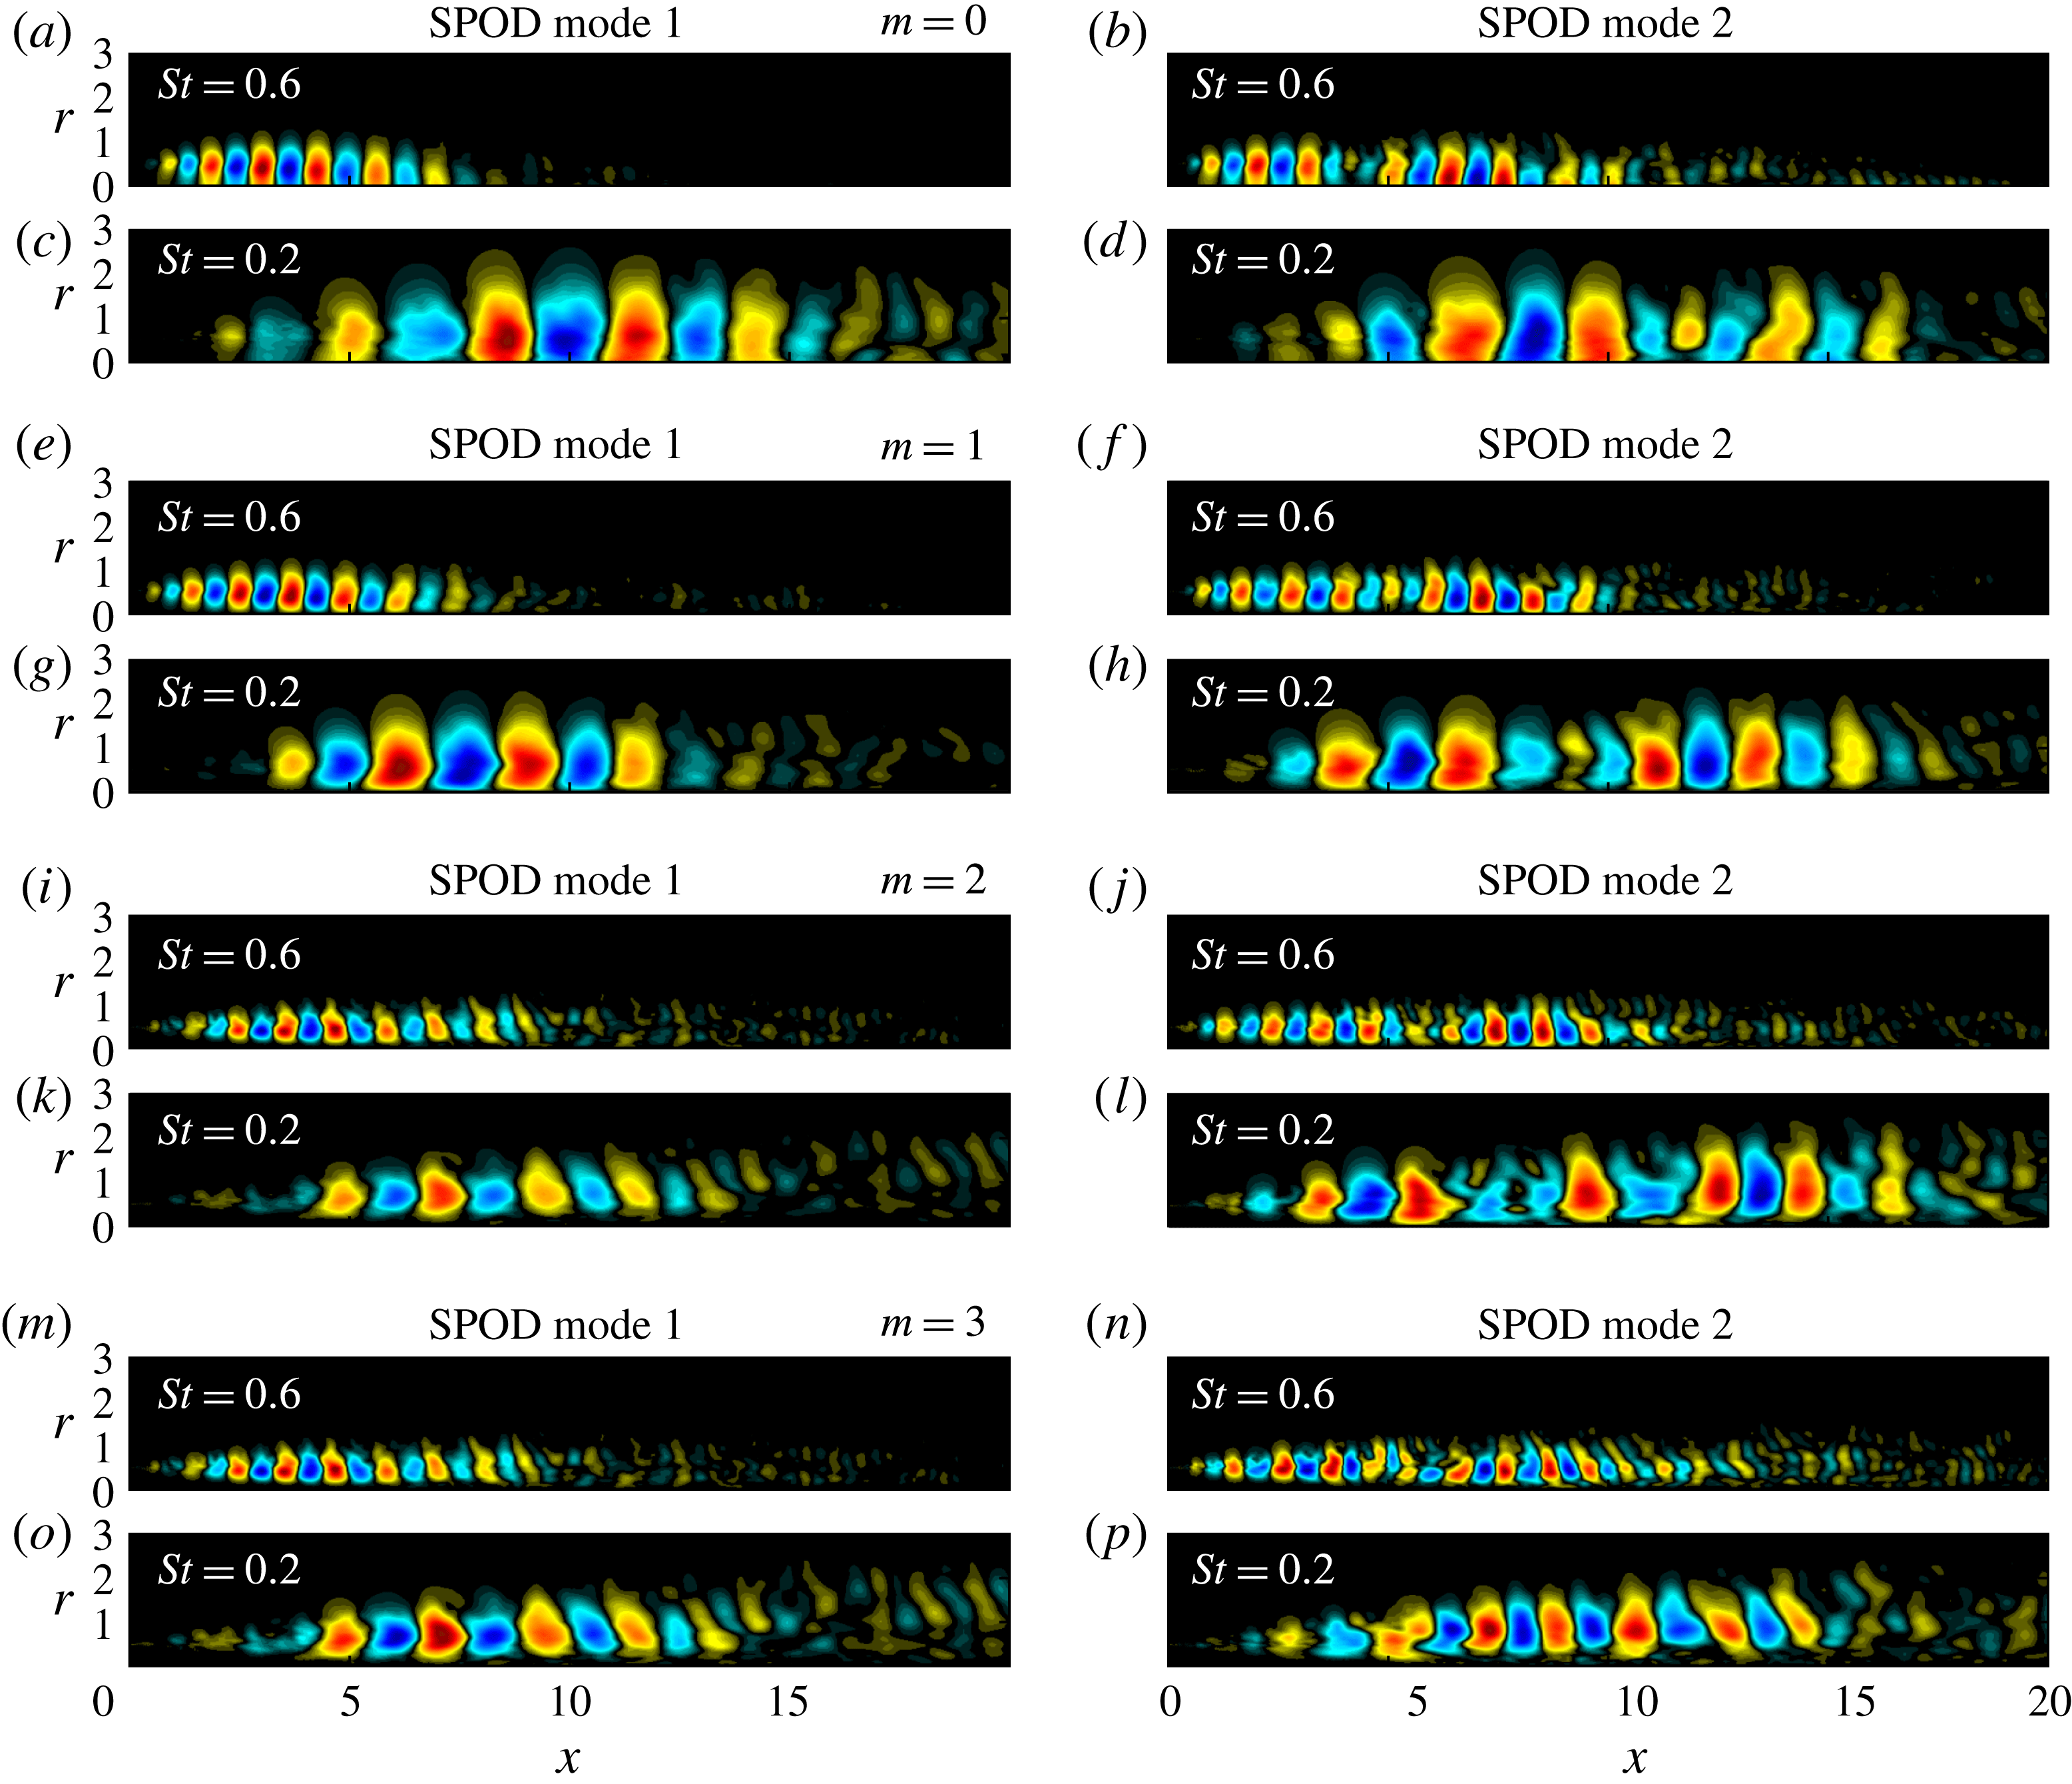
Figure 4 shows the first (a,c,e,g,i,k,m,o) and the second (b,d,f,h,j,l,n,p) SPOD modes at two representative frequencies and for
 $m=0,\ldots ,3$
. The most energetic mode at
 $m=0$
and
 $St=0.6$
is shown in figure 4(a). These parameters correspond approximately to the point of maximum separation between the first and second mode in figure 3(a). The pressure field takes the form of a compact wavepacket in the initial shear-layer region of the jet (see figure 2). Its structure is reminiscent of the Kelvin–Helmholtz shear-layer instability of the mean flow (Suzuki & Colonius Reference Suzuki and Colonius2006; Gudmundsson & Colonius Reference Gudmundsson and Colonius2011; Jordan & Colonius Reference Jordan and Colonius2013). Crighton & Gaster (Reference Crighton and Gaster1976) argued that the mean flow can be regarded as an equivalent laminar flow, and found that it is convectively unstable (in the local weakly non-parallel sense) in the initial shear-layer region. Following their interpretation of this structure as a modal spatial instability wave, we refer to it as a KH-type wavepacket. The suboptimal SPOD mode shown in 4(b) has a double-wavepacket structure with an upstream wavepacket similar to the KH type and a second wavepacket further downstream. This double-wavepacket structure is similarly observed at other frequencies and azimuthal wavenumbers, most prominently in figure 4(b,f,h,j,n). The turbulent mean flow in this region is convectively stable – it does not support spatial modal growth. Tissot et al. (Reference Tissot, Zhang, Lajús, Cavalieri and Jordan2017) argue that the presence of large-scale structures in this region can be explained in terms of non-modal growth through the Orr mechanism. Our resolvent model presented in § 4 supports this idea, and we therefore term these downstream or Orr-type wavepackets. Large parts of this paper are dedicated to establishing a clear separation and explanation of these two distinct mechanisms.
In order to further isolate mechanisms associated with different regions of the jet, we construct empirical frequency–wavenumber diagrams by taking the Fourier transform in the streamwise direction of the LES pressure along the lip line (
 $r=0.5$
). We compute the spatio-temporal PSD as
 $$\begin{eqnarray}\bar{P}_{qq}=\frac{1}{n_{blk}}\mathop{\sum }_{l=1}^{n_{blk}}|\hat{q}_{m\unicode[STIX]{x1D714}\unicode[STIX]{x1D6FC}}^{(l)}|^{2},\end{eqnarray}$$
where
 $\hat{(\cdot )}_{\unicode[STIX]{x1D6FC}}$
is the Fourier transform in the axial direction and
 $\unicode[STIX]{x1D6FC}$
the axial wavenumber. In figure 5, the PSD is plotted, and compared to the PSD computed with different window functions constraining the signal to specific regions along the streamwise axis, specifically
 $0\leqslant x\leqslant 5$
, representing the annular shear layer, and
 $10\leqslant x<30$
, the developing jet.
Qualitatively similar results are found for
 $m=0$
(a–c) and
 $m=1$
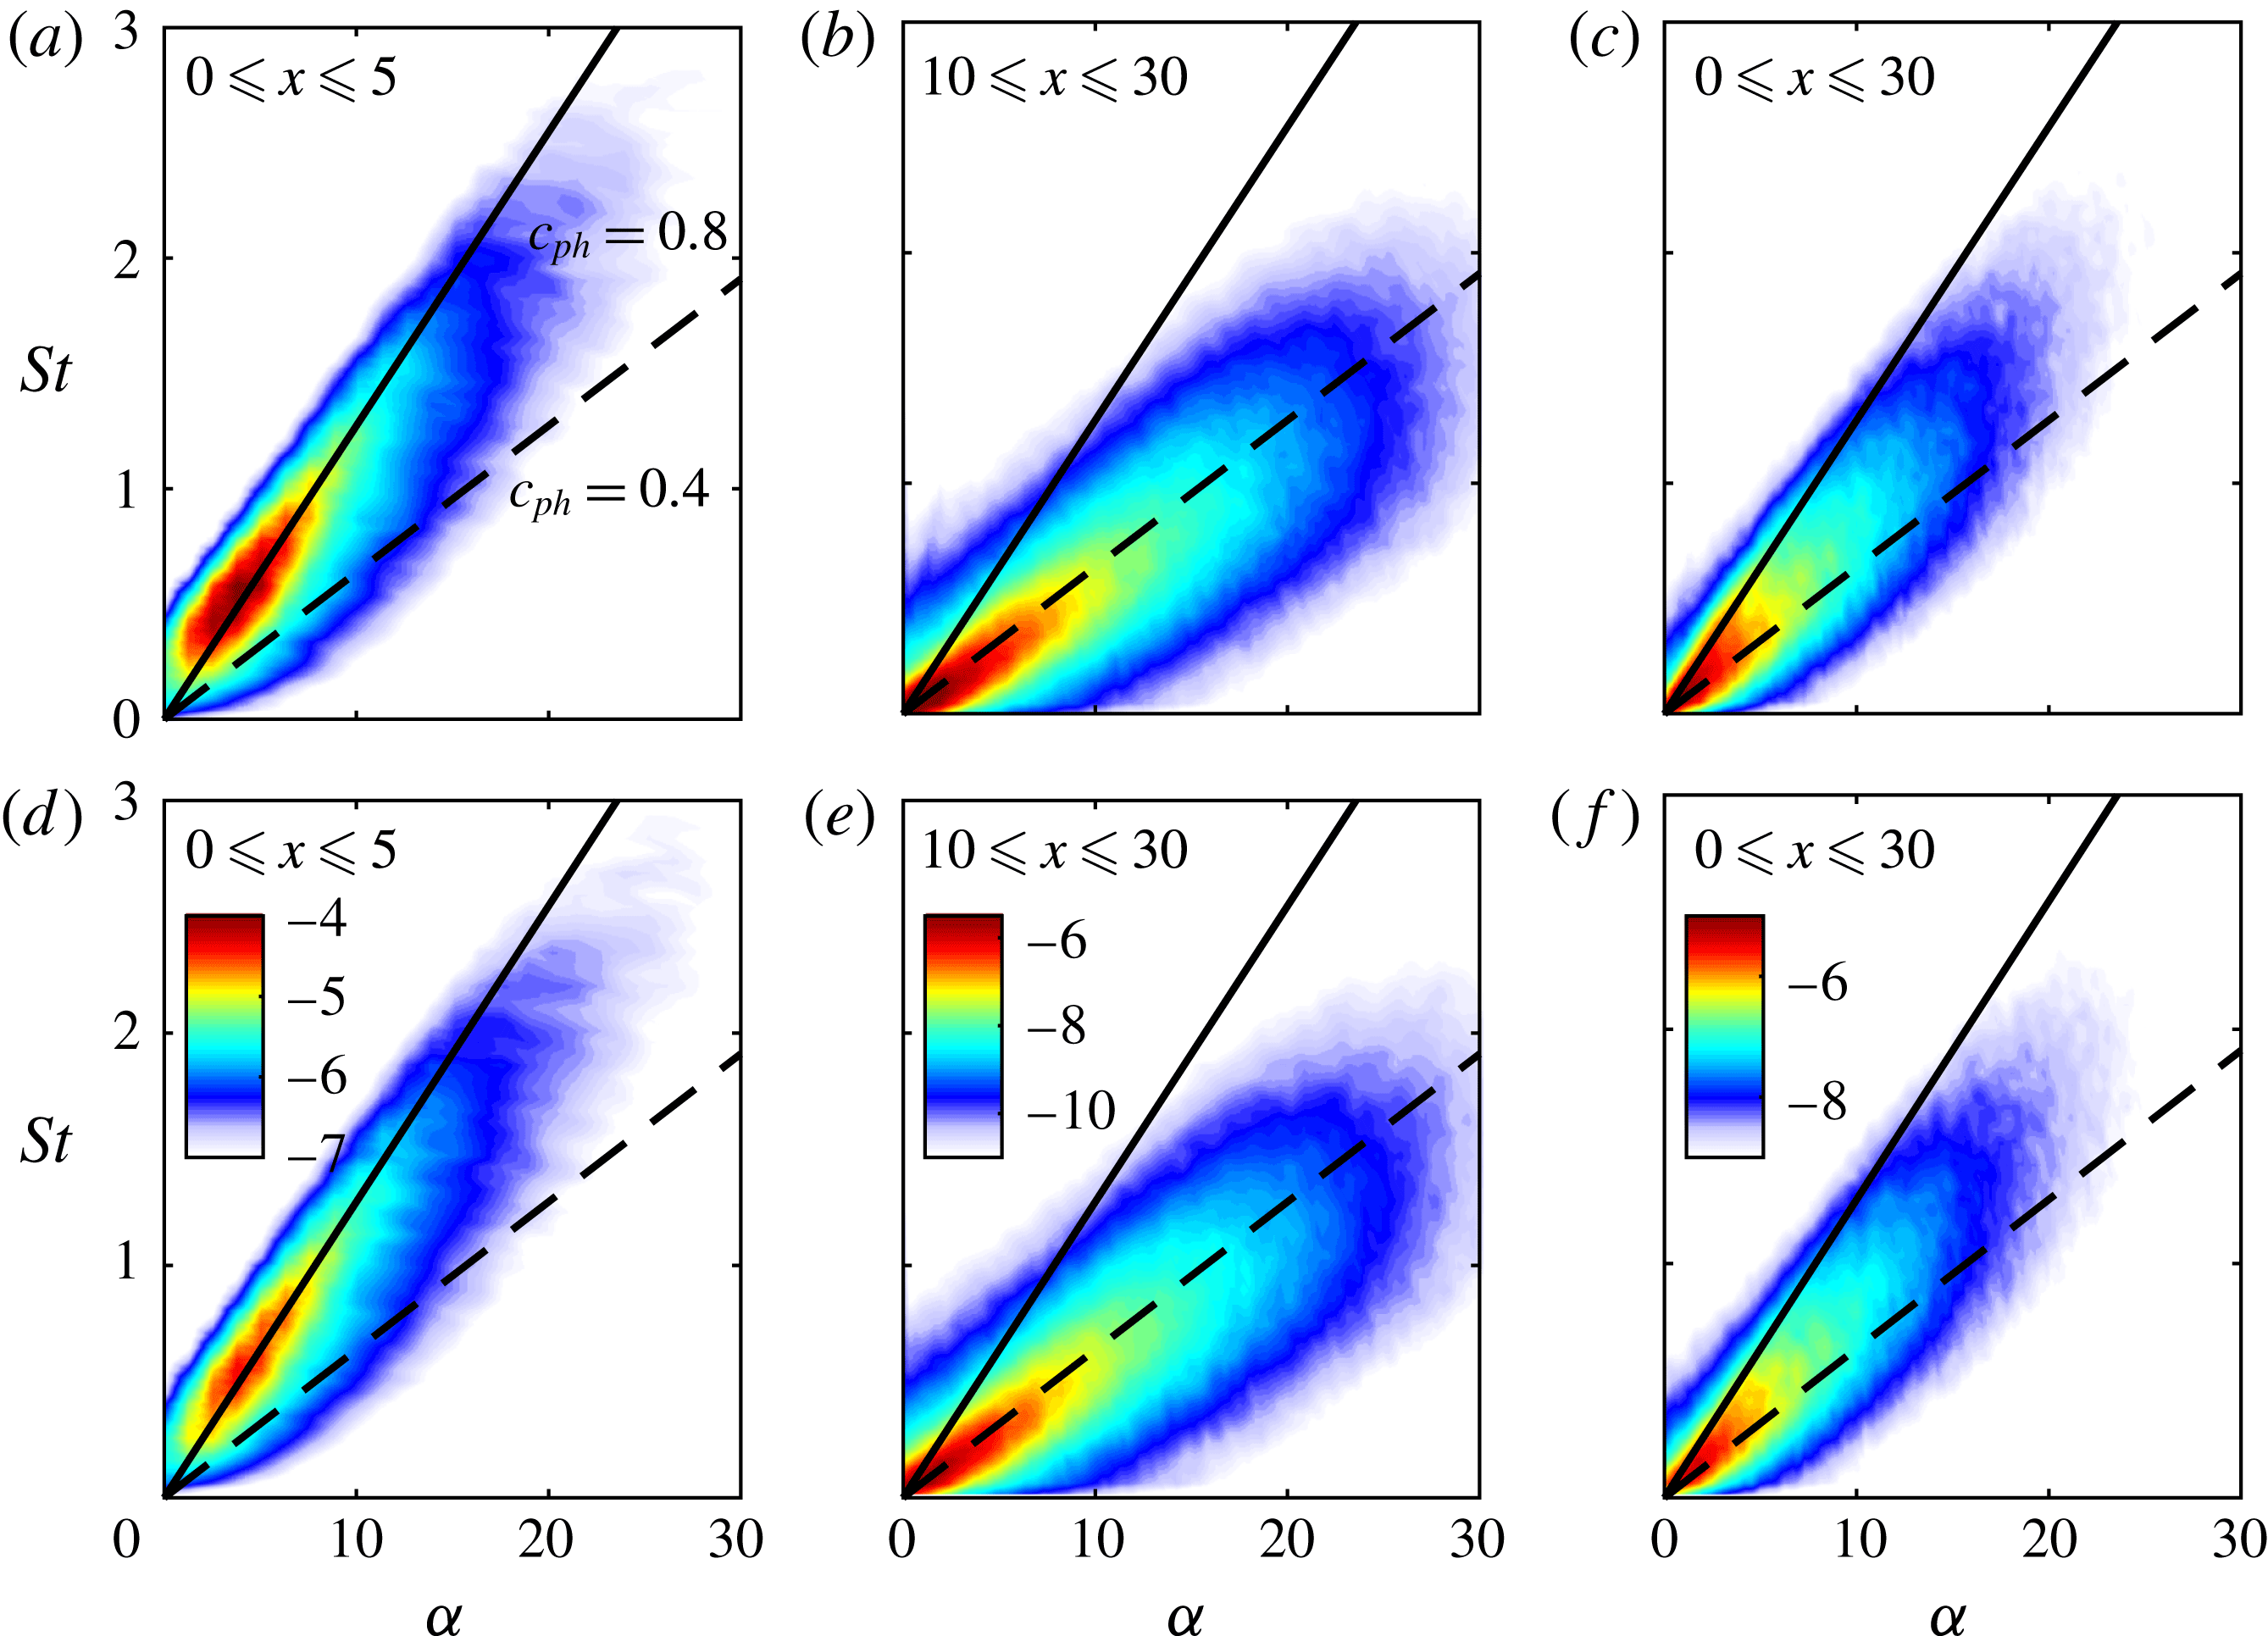
(d–f). In the initial shear-layer region investigated in figures 5(a) and 5(d), the pressure PSD follows the line of constant phase speed
 $c_{ph}=0.8$
and peaks at
 $St\approx 0.5$
for
 $m=0$
, and a slightly lower frequency for
 $m=1$
. This phase speed is typical for KH-type shear-layer instability waves, and the peak frequencies are close to the ones where the low-rank behaviour is most pronounced in figures 3(a) and 3(b), respectively. In the developing jet region in figures 5(b) and 5(e), waves propagate with approximately half of the phase speed observed in the initial shear layer, and the PSD peaks at the lowest resolved frequency. The PSD for the entire domain shown in figures 5(c) and 5(f), by construction, combines these effects.
Frequency–wavenumber diagrams (

 $\log _{10}(\bar{P}_{pp})$
) of the subsonic simulation along the lip line (
 $r=0.5$
) over axial sections representative of the potential core (a,d), downstream of the potential core (b,e) and the entire jet (c,f). The behaviours for
 $m=0$
(a–c) and
 $m=1$
(d–f) are similar. Two lines of constant phase speed (——,
 $c_{ph}=0.8$
) and (- - -,
 $c_{ph}=0.4$
) are shown as a reference. Rows share the same contour levels.
4 Resolvent model
A key concept that emerged from the early studies of transient growth (Farrell & Ioannou Reference Farrell and Ioannou1993; Reddy & Henningson Reference Reddy and Henningson1993; Reddy, Schmid & Henningson Reference Reddy, Schmid and Henningson1993; Trefethen et al. Reference Trefethen, Trefethen, Reddy and Driscoll1993) is that of the resolvent operator. The resolvent operator is derived from the forced linearized equations of motion and constitutes a transfer function between body forces and corresponding responses. It has been used to study the linear response to external forcing of a range of laminar flows including channel flow (Jovanović & Bamieh Reference Jovanović and Bamieh2005; Moarref & Jovanović Reference Moarref and Jovanović2012), boundary layers (Monokrousos et al. Reference Monokrousos, Åkervik, Brandt and Henningson2010; Sipp & Marquet Reference Sipp and Marquet2013) and the flow over a backward-facing step (Dergham, Sipp & Robinet Reference Dergham, Sipp and Robinet2013).
When the resolvent is computed for the turbulent mean flow, the forcing can be identified with the nonlinear effects, namely the triadic interactions that conspire to force a response at a given frequency and azimuthal wavenumber (McKeon & Sharma Reference McKeon and Sharma2010). Previous resolvent analyses of turbulent jets include those of Garnaud et al. (Reference Garnaud, Lesshafft, Schmid and Huerre2013), Jeun et al. (Reference Jeun, Nichols and Jovanović2016) and Semeraro et al. (Reference Semeraro, Lesshafft, Jaunet and Jordan2016b ).
The use of a resolvent model is motivated by recent findings that connect SPOD and resolvent analysis (Towne et al. Reference Towne, Colonius, Jordan, Cavalieri and Brès2015; Semeraro et al. Reference Semeraro, Lesshafft, Jaunet and Jordan2016b ; Towne et al. Reference Towne, Schmidt and Colonius2018). Specifically, SPOD and resolvent modes are identical when the SPOD expansion coefficients are uncorrelated, which is typically associated with white-noise forcing.
4.1 Methodology
We start by writing the forced linear governing equations, here the compressible Navier–Stokes equations, as an input–output system in the frequency domain
 $$\begin{eqnarray}\displaystyle & \displaystyle (-\text{i}\unicode[STIX]{x1D714}\unicode[STIX]{x1D644}-\unicode[STIX]{x1D63C}_{m})\hat{\boldsymbol{q}}_{m\unicode[STIX]{x1D714}}=\unicode[STIX]{x1D63D}\,\hat{\boldsymbol{f}}_{m\unicode[STIX]{x1D714}}, & \displaystyle\end{eqnarray}$$
 $$\begin{eqnarray}\displaystyle & \displaystyle \hat{\boldsymbol{y}}_{m\unicode[STIX]{x1D714}}=\unicode[STIX]{x1D63E}\hat{\boldsymbol{q}}_{m\unicode[STIX]{x1D714}}, & \displaystyle\end{eqnarray}$$
where
 $\unicode[STIX]{x1D63C}_{m}$
is the linearized compressible Navier–Stokes operator,
 $\hat{\boldsymbol{q}}_{m\unicode[STIX]{x1D714}}$
is the state vector as before and
 $\hat{\boldsymbol{f}}_{m\unicode[STIX]{x1D714}}$
the (for now unspecified) forcing. Equation (4.2) defines the output, or response,
 $\hat{\boldsymbol{y}}_{m\unicode[STIX]{x1D714}}$
as the product of an output matrix
 $\unicode[STIX]{x1D63E}$
with the state. Analogously, an input matrix
 $\unicode[STIX]{x1D63D}$
is introduced in (4.1). Without forcing, the right-hand side of equation (4.1) is zero, and the global linear stability eigenvalue problem for
 $\hat{\boldsymbol{q}}_{m\unicode[STIX]{x1D714}}$
and
 $\unicode[STIX]{x1D714}$
is recovered. We use the same discretization scheme as in Schmidt et al. (Reference Schmidt, Towne, Colonius, Cavalieri, Jordan and Brès2017) and refer to that paper for details of the numerical method.
Equations (4.1) and (4.2) allow us to express a direct relation between inputs and outputs,
 $$\begin{eqnarray}\hat{\boldsymbol{y}}_{m\unicode[STIX]{x1D714}}=\unicode[STIX]{x1D643}_{m\unicode[STIX]{x1D714}}\,\hat{\boldsymbol{f}}_{m\unicode[STIX]{x1D714}},\end{eqnarray}$$
by defining the resolvent operator
 $$\begin{eqnarray}\unicode[STIX]{x1D643}_{m\unicode[STIX]{x1D714}}=\unicode[STIX]{x1D63E}(-\text{i}\unicode[STIX]{x1D714}\unicode[STIX]{x1D644}-\unicode[STIX]{x1D63C}_{m})^{-1}\unicode[STIX]{x1D63D}\end{eqnarray}$$
as the transfer function between them. We further define the modified, or weighted, resolvent operator
 $$\begin{eqnarray}\unicode[STIX]{x1D64D}_{m\unicode[STIX]{x1D714}}=\unicode[STIX]{x1D652}_{\unicode[STIX]{x1D66E}}^{1/2}\unicode[STIX]{x1D643}_{m\unicode[STIX]{x1D714}}\unicode[STIX]{x1D652}_{\unicode[STIX]{x1D65B}}^{-(1/2)}=\tilde{\unicode[STIX]{x1D654}}\unicode[STIX]{x1D72E}\tilde{\unicode[STIX]{x1D641}}^{\ast }\end{eqnarray}$$
that accounts for arbitrary inner products on the input and output spaces that are defined shortly. In the last equality of equation (4.5), we anticipated the result that the optimal responses
 $\tilde{\unicode[STIX]{x1D654}}=[\,\tilde{\boldsymbol{y}}_{m\unicode[STIX]{x1D714}}^{(1)}\;\tilde{\boldsymbol{y}}_{m\unicode[STIX]{x1D714}}^{(2)}\cdots \tilde{\boldsymbol{y}}_{m\unicode[STIX]{x1D714}}^{(N)}]$
, forcings
 $\tilde{\unicode[STIX]{x1D641}}=[\,\tilde{\boldsymbol{f}}_{m\unicode[STIX]{x1D714}}^{(1)}\;\tilde{\boldsymbol{f}}_{m\unicode[STIX]{x1D714}}^{(2)}\cdots \tilde{\boldsymbol{f}}_{m\unicode[STIX]{x1D714}}^{(N)}]$
and amplitude gains
 $\unicode[STIX]{x1D72E}=\text{diag}(\unicode[STIX]{x1D70E}_{1},\unicode[STIX]{x1D70E}_{2},\ldots ,\unicode[STIX]{x1D70E}_{N})$
can be found from the singular value decomposition (SVD) of the modified resolvent operator. By
 $\tilde{(\cdot )}$
we denote singular or eigenvectors. The modified resolvent operator in (4.5) is weighted such that the orthonormality properties
 $$\begin{eqnarray}\displaystyle & \displaystyle \langle \,\tilde{\boldsymbol{y}}_{m\unicode[STIX]{x1D714}}\text{}^{(i)},\tilde{\boldsymbol{y}}_{m\unicode[STIX]{x1D714}}\text{}^{(j)}\rangle _{y}=\tilde{\boldsymbol{y}}_{m\unicode[STIX]{x1D714}}\text{}^{(i)^{\ast }}\unicode[STIX]{x1D652}_{\unicode[STIX]{x1D66E}}\tilde{\boldsymbol{y}}_{m\unicode[STIX]{x1D714}}\text{}^{(j)}=\unicode[STIX]{x1D6FF}_{ij}\quad \text{and} & \displaystyle\end{eqnarray}$$
 $$\begin{eqnarray}\displaystyle & \displaystyle \langle \,\tilde{\boldsymbol{f}}_{m\unicode[STIX]{x1D714}}\text{}^{(i)},\,\tilde{\boldsymbol{f}}_{m\unicode[STIX]{x1D714}}\text{}^{(j)}\rangle _{f}=\tilde{\boldsymbol{f}}_{m\unicode[STIX]{x1D714}}\text{}^{(i)^{\ast }}\unicode[STIX]{x1D652}_{\unicode[STIX]{x1D65B}}\,\tilde{\boldsymbol{f}}_{m\unicode[STIX]{x1D714}}\text{}^{(j)}=\unicode[STIX]{x1D6FF}_{ij} & \displaystyle\end{eqnarray}$$
hold for the optimal responses in the output norm
 $\langle \cdot ,\cdot \rangle _{y}$
, and the forcings in the input norm
 $\langle \cdot ,\cdot \rangle _{f}$
, respectively. The optimal forcings and responses are found from the definition of the optimal energetic gain
 $$\begin{eqnarray}G_{max}^{2}(\,\hat{\boldsymbol{f}}_{m\unicode[STIX]{x1D714}})=\max _{\Vert \,\hat{\boldsymbol{f}}_{m\unicode[STIX]{x1D714}}\Vert _{f}^{2}=1}\frac{\langle \,\hat{\boldsymbol{y}}_{m\unicode[STIX]{x1D714}},\hat{\boldsymbol{y}}_{m\unicode[STIX]{x1D714}}\rangle _{y}}{\langle \,\hat{\boldsymbol{f}}_{m\unicode[STIX]{x1D714}},\hat{\boldsymbol{f}}_{m\unicode[STIX]{x1D714}}\rangle _{f}}=\frac{\langle \,\tilde{\boldsymbol{y}}_{m\unicode[STIX]{x1D714}},\tilde{\boldsymbol{y}}_{m\unicode[STIX]{x1D714}}\rangle _{y}}{\langle \,\tilde{\boldsymbol{f}}_{m\unicode[STIX]{x1D714}},\,\tilde{\boldsymbol{f}}_{m\unicode[STIX]{x1D714}}\rangle _{f}}=G^{2}(\,\tilde{\boldsymbol{f}}_{m\unicode[STIX]{x1D714}}^{(1)})=\unicode[STIX]{x1D70E}_{1}^{2}\end{eqnarray}$$
between inputs and outputs (see e.g. Schmid & Henningson Reference Schmid and Henningson2001). By writing the energetic gain in the form of a generalized Rayleigh quotient and inserting equations (4.3) and (4.4), it is found that the orthogonal basis of forcings optimally ranked by energetic gain can be found from the eigenvalue problem
 $$\begin{eqnarray}\unicode[STIX]{x1D652}_{\unicode[STIX]{x1D65B}}^{-1}\unicode[STIX]{x1D63D}^{H}(-\text{i}\unicode[STIX]{x1D714}\unicode[STIX]{x1D644}-\unicode[STIX]{x1D63C}_{m})^{-H}\unicode[STIX]{x1D63E}^{H}\unicode[STIX]{x1D652}_{\unicode[STIX]{x1D66E}}\unicode[STIX]{x1D63E}(-\text{i}\unicode[STIX]{x1D714}\unicode[STIX]{x1D644}-\unicode[STIX]{x1D63C}_{m})^{-1}\unicode[STIX]{x1D63D}\,\tilde{\boldsymbol{f}}_{m\unicode[STIX]{x1D714}}\text{}^{(i)}=\unicode[STIX]{x1D70E}_{i}^{2}\,\tilde{\boldsymbol{f}}_{m\unicode[STIX]{x1D714}}\text{}^{(i)}.\end{eqnarray}$$
Equation (4.11) is solved by first factoring
 $(-\text{i}\unicode[STIX]{x1D714}\unicode[STIX]{x1D644}-\unicode[STIX]{x1D63C}_{m})=\unicode[STIX]{x1D647}\unicode[STIX]{x1D650}$
(Sipp & Marquet Reference Sipp and Marquet2013) and then solving the eigenvalue problem
 $$\begin{eqnarray}\unicode[STIX]{x1D652}_{\unicode[STIX]{x1D65B}}^{-1}\unicode[STIX]{x1D63D}^{H}\unicode[STIX]{x1D650}^{-H}\unicode[STIX]{x1D647}^{-H}\unicode[STIX]{x1D63E}^{H}\unicode[STIX]{x1D652}_{\unicode[STIX]{x1D66E}}\unicode[STIX]{x1D63E}\unicode[STIX]{x1D650}^{-1}\unicode[STIX]{x1D647}^{-1}\unicode[STIX]{x1D63D}\tilde{\unicode[STIX]{x1D641}}=\tilde{\unicode[STIX]{x1D641}}\unicode[STIX]{x1D72E}^{2}\end{eqnarray}$$
for the largest eigenvalues using a standard Arnoldi method. The corresponding responses are readily obtained as
 $$\begin{eqnarray}\tilde{\unicode[STIX]{x1D654}}=\unicode[STIX]{x1D64D}_{m\unicode[STIX]{x1D714}}\tilde{\unicode[STIX]{x1D641}}=\unicode[STIX]{x1D652}_{\unicode[STIX]{x1D66E}}^{1/2}\unicode[STIX]{x1D63E}\unicode[STIX]{x1D650}^{-1}\unicode[STIX]{x1D647}^{-1}\unicode[STIX]{x1D63D}\unicode[STIX]{x1D652}_{\unicode[STIX]{x1D65B}}^{-(1/2)}\tilde{\unicode[STIX]{x1D641}}.\end{eqnarray}$$
In this study, we quantify both the energy of the input and the output in the compressible energy norm, as defined in (3.2), by setting
 $\unicode[STIX]{x1D652}_{\unicode[STIX]{x1D66E}}=\unicode[STIX]{x1D652}_{\unicode[STIX]{x1D65B}}=\unicode[STIX]{x1D652}$
. The matrices
 $\unicode[STIX]{x1D63D}$
and
 $\unicode[STIX]{x1D63E}$
we use for the sole purpose of restricting the analysis to the physical part of the computational domain by assigning zero weights to the sponge region. The physical solution domain corresponds to the domain of the LES data detailed in table 2. Note that the nozzle is not part of this computational domain. This simplifies the numerical discretization, and is motivated by the convective nature of the KH-type shear-layer instability waves. As discussed in the literature review in § 1, the KH waves can be modelled as local spatial instability modes, or PSE solutions that are initiated by a local mode at some distance downstream of the nozzle. We therefore do not expect a significant effect on their modal shape. Other studies (Garnaud et al.
Reference Garnaud, Lesshafft, Schmid and Huerre2013; Jeun et al.
Reference Jeun, Nichols and Jovanović2016; Semeraro et al.
Reference Semeraro, Lesshafft, Jaunet and Jordan2016b
) include a pipe as a nozzle subtitute, and we would expect quantitative changes to the gain, as the additional spatial upstream extent allows for a more efficient exploitation of the convective non-normality. The Orr-type waves are most efficiently forced close to their spatial support, as discussed in § 4.2 below, and we therefore do not expect them to be affected by the nozzle.
The solution domain is surrounded by a sponge region of width
 $D$
, and discretized using
 $950\times 195$
points in the streamwise and radial direction, respectively. The streamwise extent of the domain sets a limit of
 $St\gtrsim 0.2$
on the lowest possible frequency. For lower frequencies, the response structures become so elongated that domain truncation affects the gain. An upper limit on
 $St$
is imposed by the numerical discretization, i.e. the capability of the differentiation scheme to resolve the smallest structures in the response and forcing fields for the given resolution. This limit is
 $St\lesssim 2.5$
for the subsonic,
 $St\lesssim 1.5$
for the transonic and
 $St\lesssim 1$
for the supersonic case, respectively. A molecular Reynolds number of
 $Re=3\times 10^{4}$
is used for this study. We return to this issue later and discuss our rationale in § 4.3.
4.2 Resolvent spectra and modes
Optimal and suboptimal resolvent forcings (a,c,e,g,i,k) and corresponding responses (b,d,f,h,j,l) of the subsonic jet for
 $St=0.6$
and
 $m=0$
. The pressure field (


Figure 6 shows the optimal and the five leading suboptimal forcings and responses for
 $St=0.6$
and
 $m=0$
. The leading mode in figure 6(b) resembles a KH-type instability wavepacket that is confined to the initial shear-layer region. The corresponding optimal forcing in figure 6(a) is confined close to the nozzle. The inset in figure 6(a) reveals that the KH-type wavepacket is most efficiently forced by a structure that is oriented against the mean shear in the vicinity of the lip line. This is a typical manifestation of the Orr mechanism and has similarly been observed in resolvent models of other flows (e.g. in Garnaud et al.
Reference Garnaud, Lesshafft, Schmid and Huerre2013; Dergham et al.
Reference Dergham, Sipp and Robinet2013; Jeun et al.
Reference Jeun, Nichols and Jovanović2016; Semeraro et al.
Reference Semeraro, Lesshafft, Jaunet and Jordan2016b
; Tissot et al.
Reference Tissot, Zhang, Lajús, Cavalieri and Jordan2017). The suboptimal modes in figure 6(d,f,h,j,l) contain two wavepackets: one in the initial shear layer region that is similar to the KH wavepackets in the optimal mode, and a second further downstream in the developing jet region. With increasing mode number, the downstream wavepacket moves upstream and becomes more spatially confined. It is optimally forced downstream of the inlet and over an axial distance comparable to the length of the response. Following the same arguments as for the suboptimal SPOD modes presented in figure 4, we term the downstream wavepackets Orr-type wavepackets. Both the KH-type and the Orr-type wavepackets are optimally exerted via the Orr mechanism. From a local stability theory point of view, the two mechanisms are distinguished by their modal and non-modal nature: see Jordan et al. (Reference Jordan, Zhang, Lehnasch and Cavalieri2017) and Tissot et al. (Reference Tissot, Zhang, Lajús, Cavalieri and Jordan2017).
The critical layer effect in the subsonic jet for
 $St=0.6$
and
 $m=0$
: (a) estimated phase velocity (—— red, first mode; —— blue, second mode); (b,c) normalized pressure of the first and second mode (

 $c_{ph}=\bar{u}_{x}$
. The KH and Orr wavepackets clearly follow the critical layer.
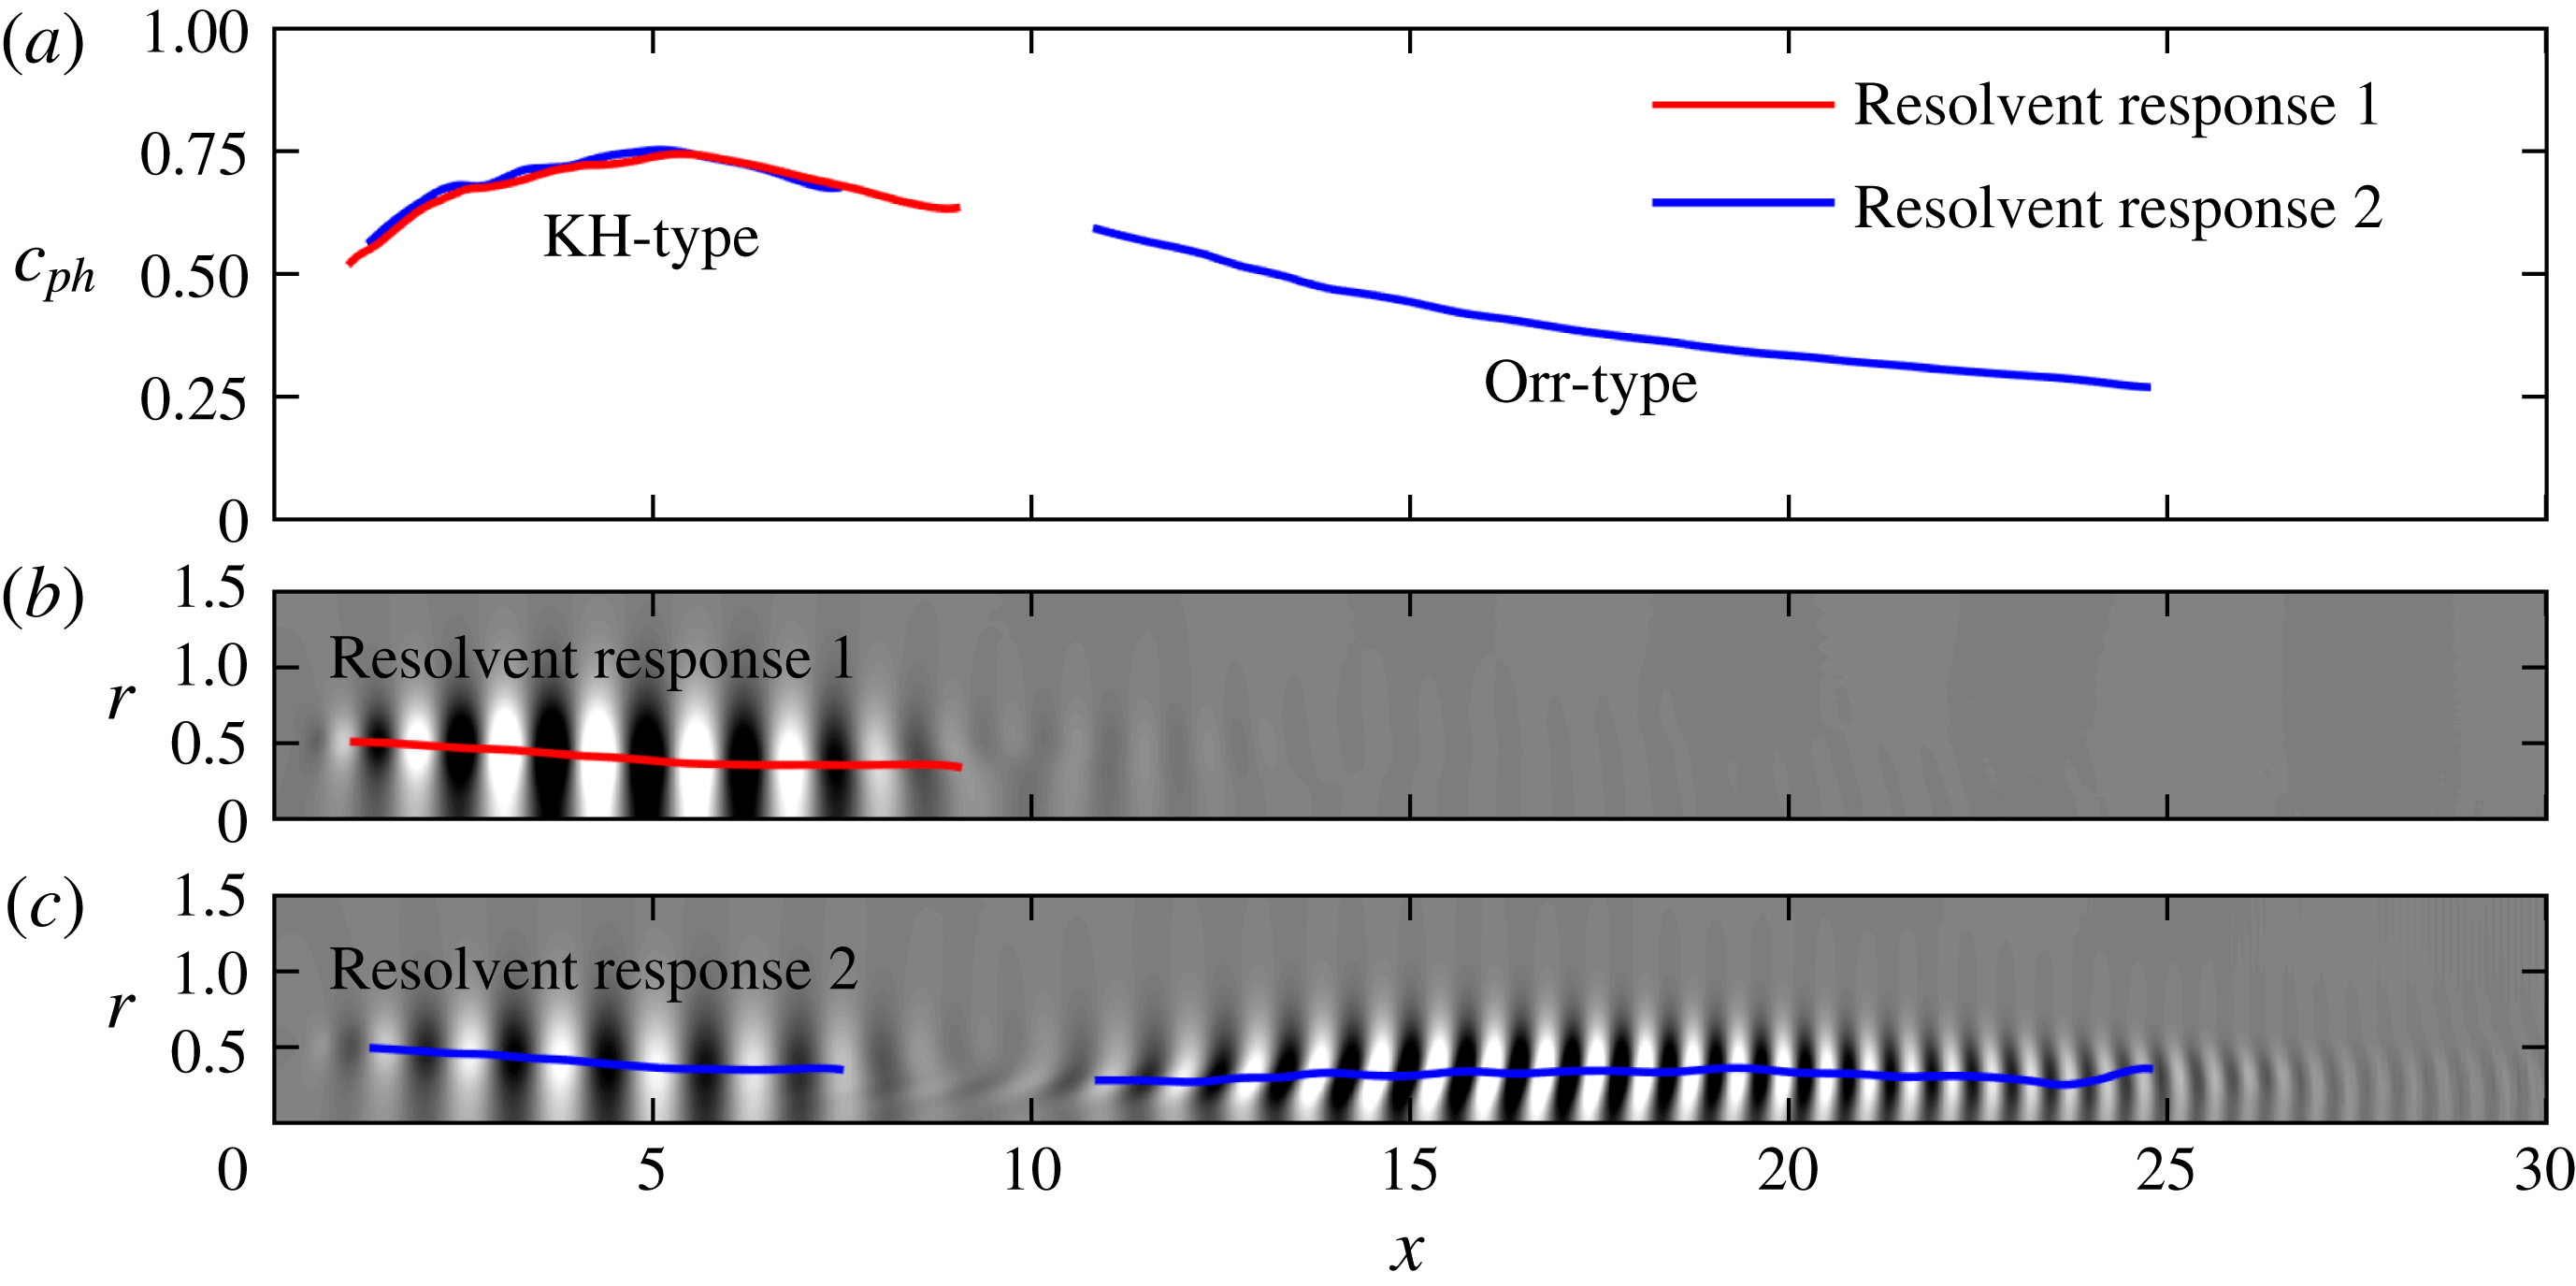
Tissot et al. (Reference Tissot, Zhang, Lajús, Cavalieri and Jordan2017) found that the critical layer, defined where the phase speed of the wavepacket is equal to the local mean velocity, plays an important role in the forced linear dynamics of jets. In accordance with our interpretation, their results suggests that the Orr mechanism is active downstream of the potential core. Figure 7(a) shows the phase velocity of the leading and first suboptimal resolvent response for
 $m=0$
and
 $St=0.6$
. The phase velocity is approximated as
 $c_{ph}\approx \unicode[STIX]{x1D714}/(\unicode[STIX]{x2202}\unicode[STIX]{x1D703}_{p}/\unicode[STIX]{x2202}x)$
, where
 $\unicode[STIX]{x1D703}_{p}=\arg (\unicode[STIX]{x1D719}_{p})$
is the local phase of the pressure along
 $r=0.5$
. The phase velocity is plotted for the regions where the pressure exceeds 25 % of its global absolute maximum value. The phase velocity of the upstream wavepacket in the initial shear layer is almost identical for the first and second response modes. Besides their similar structure, this also suggests that the primary wavepacket of the suboptimal mode is of KH type. The phase velocity of the downstream wavepacket decreases with axial distance in accordance with the jet’s velocity-decay rate. Figure 7(b,c) shows that the first and second wavepackets closely follow the critical layer. The variation of the phase speed with axial distance explains why the KH and Orr wavepackets are characterized by broad bands in frequency–wavenumber space: see figure 5.
Optimal energetic gain spectra (

 $\unicode[STIX]{x1D70E}_{1}>\unicode[STIX]{x1D70E}_{2}>\cdots >\unicode[STIX]{x1D70E}_{N}$
) for the subsonic jet: (a)
 $m=0$
; (b)
 $m=1$
; (c)
 $m=2$
; (d)
 $m=3$
. The difference between the optimal and the first suboptimal mode (▪ red) highlights the low-rank behaviour. The thirty largest singular values were computed for
 $m=0$
, and the three largest for
 $m>0$
. In the inset in panel (a), the KH-type mode is tracked (—— blue) into the frequency range where it becomes suboptimal. The leading mode at
 $St=0.33$
(
 $+$
) serves reference and the scalar projection
 $\langle \boldsymbol{q}^{(i)},\boldsymbol{q}_{ref}^{(1)}\rangle _{E}$
onto that mode is used for the tracking.
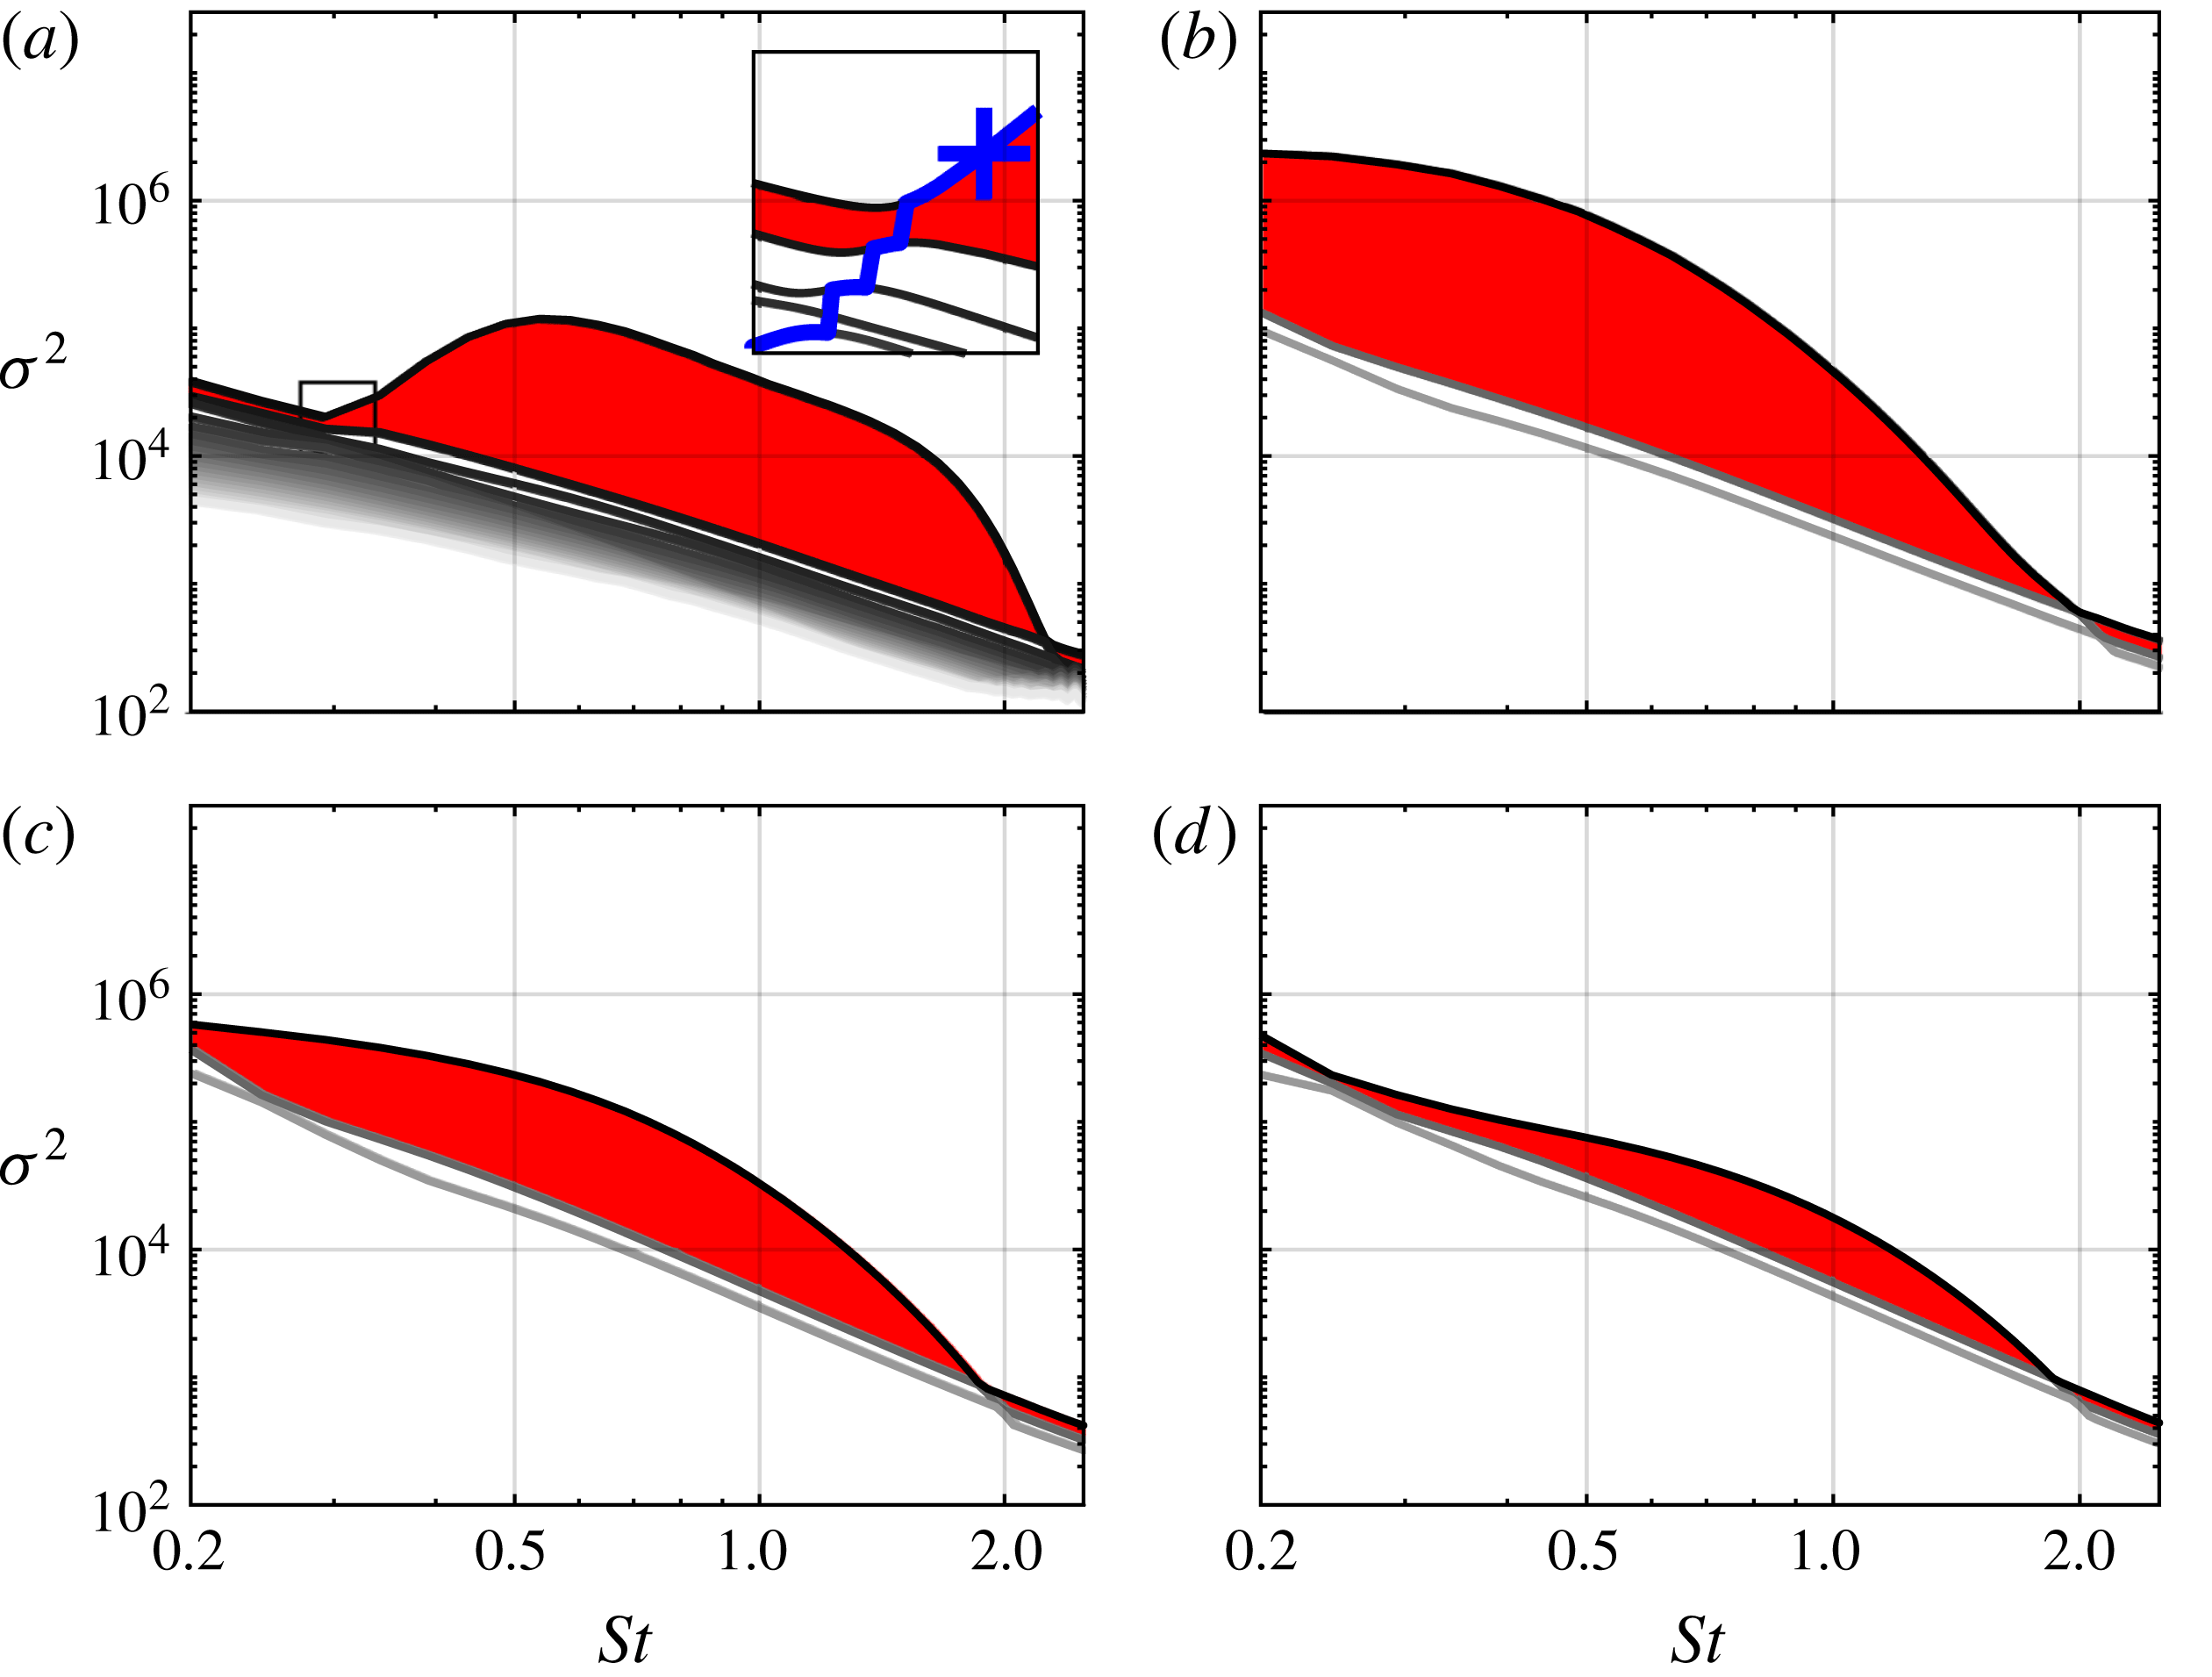
Resolvent gain spectra for the first four azimuthal wavenumbers are shown in figure 8. As in figure 3, we highlight the difference between the leading and the first suboptimal gain to emphasize low-rank behaviour. A pronounced low-rank behaviour is evident for
 $0.3\lesssim St\lesssim 2$
for
 $m=0$
as can be seen in figure 8(a). The 20 leading modes were calculated for
 $m=0$
, and the the three leading modes for
 $m>0$
. The inset in panel 8(a) shows that the KH mechanism persists into lower frequencies as a suboptimal mode (—— blue). The reference mode is of pure KH type, and it was confirmed by visual inspection of the mode shapes (not shown) that the KH signature indeed prevails in the suboptimal modes. The vertical line segments indicate transitions to the next lower singular suboptimal. At high frequencies, the continuation is more obvious. For all four azimuthal wavenumbers, the curve associated with the KH wavepacket crosses the suboptimal gain curves at
 $St\approx 2$
. This marks the end of the low-rank frequency band. For
 $m>0$
, the low-rank band extends to lower frequencies. Figure 8(b) shows that a strong low-rank behaviour is predicted for frequencies even lower than the minimum frequency
 $St<0.2$
for
 $m=1$
. With increasing azimuthal wavenumber, the low-rank behaviour becomes less and less pronounced. All these qualitative trends are reflected in the empirical SPOD energy spectra in figure 3. The direct comparison of the SPOD analysis with the resolvent model is the subject of § 6.
4.3 Reynolds number effects
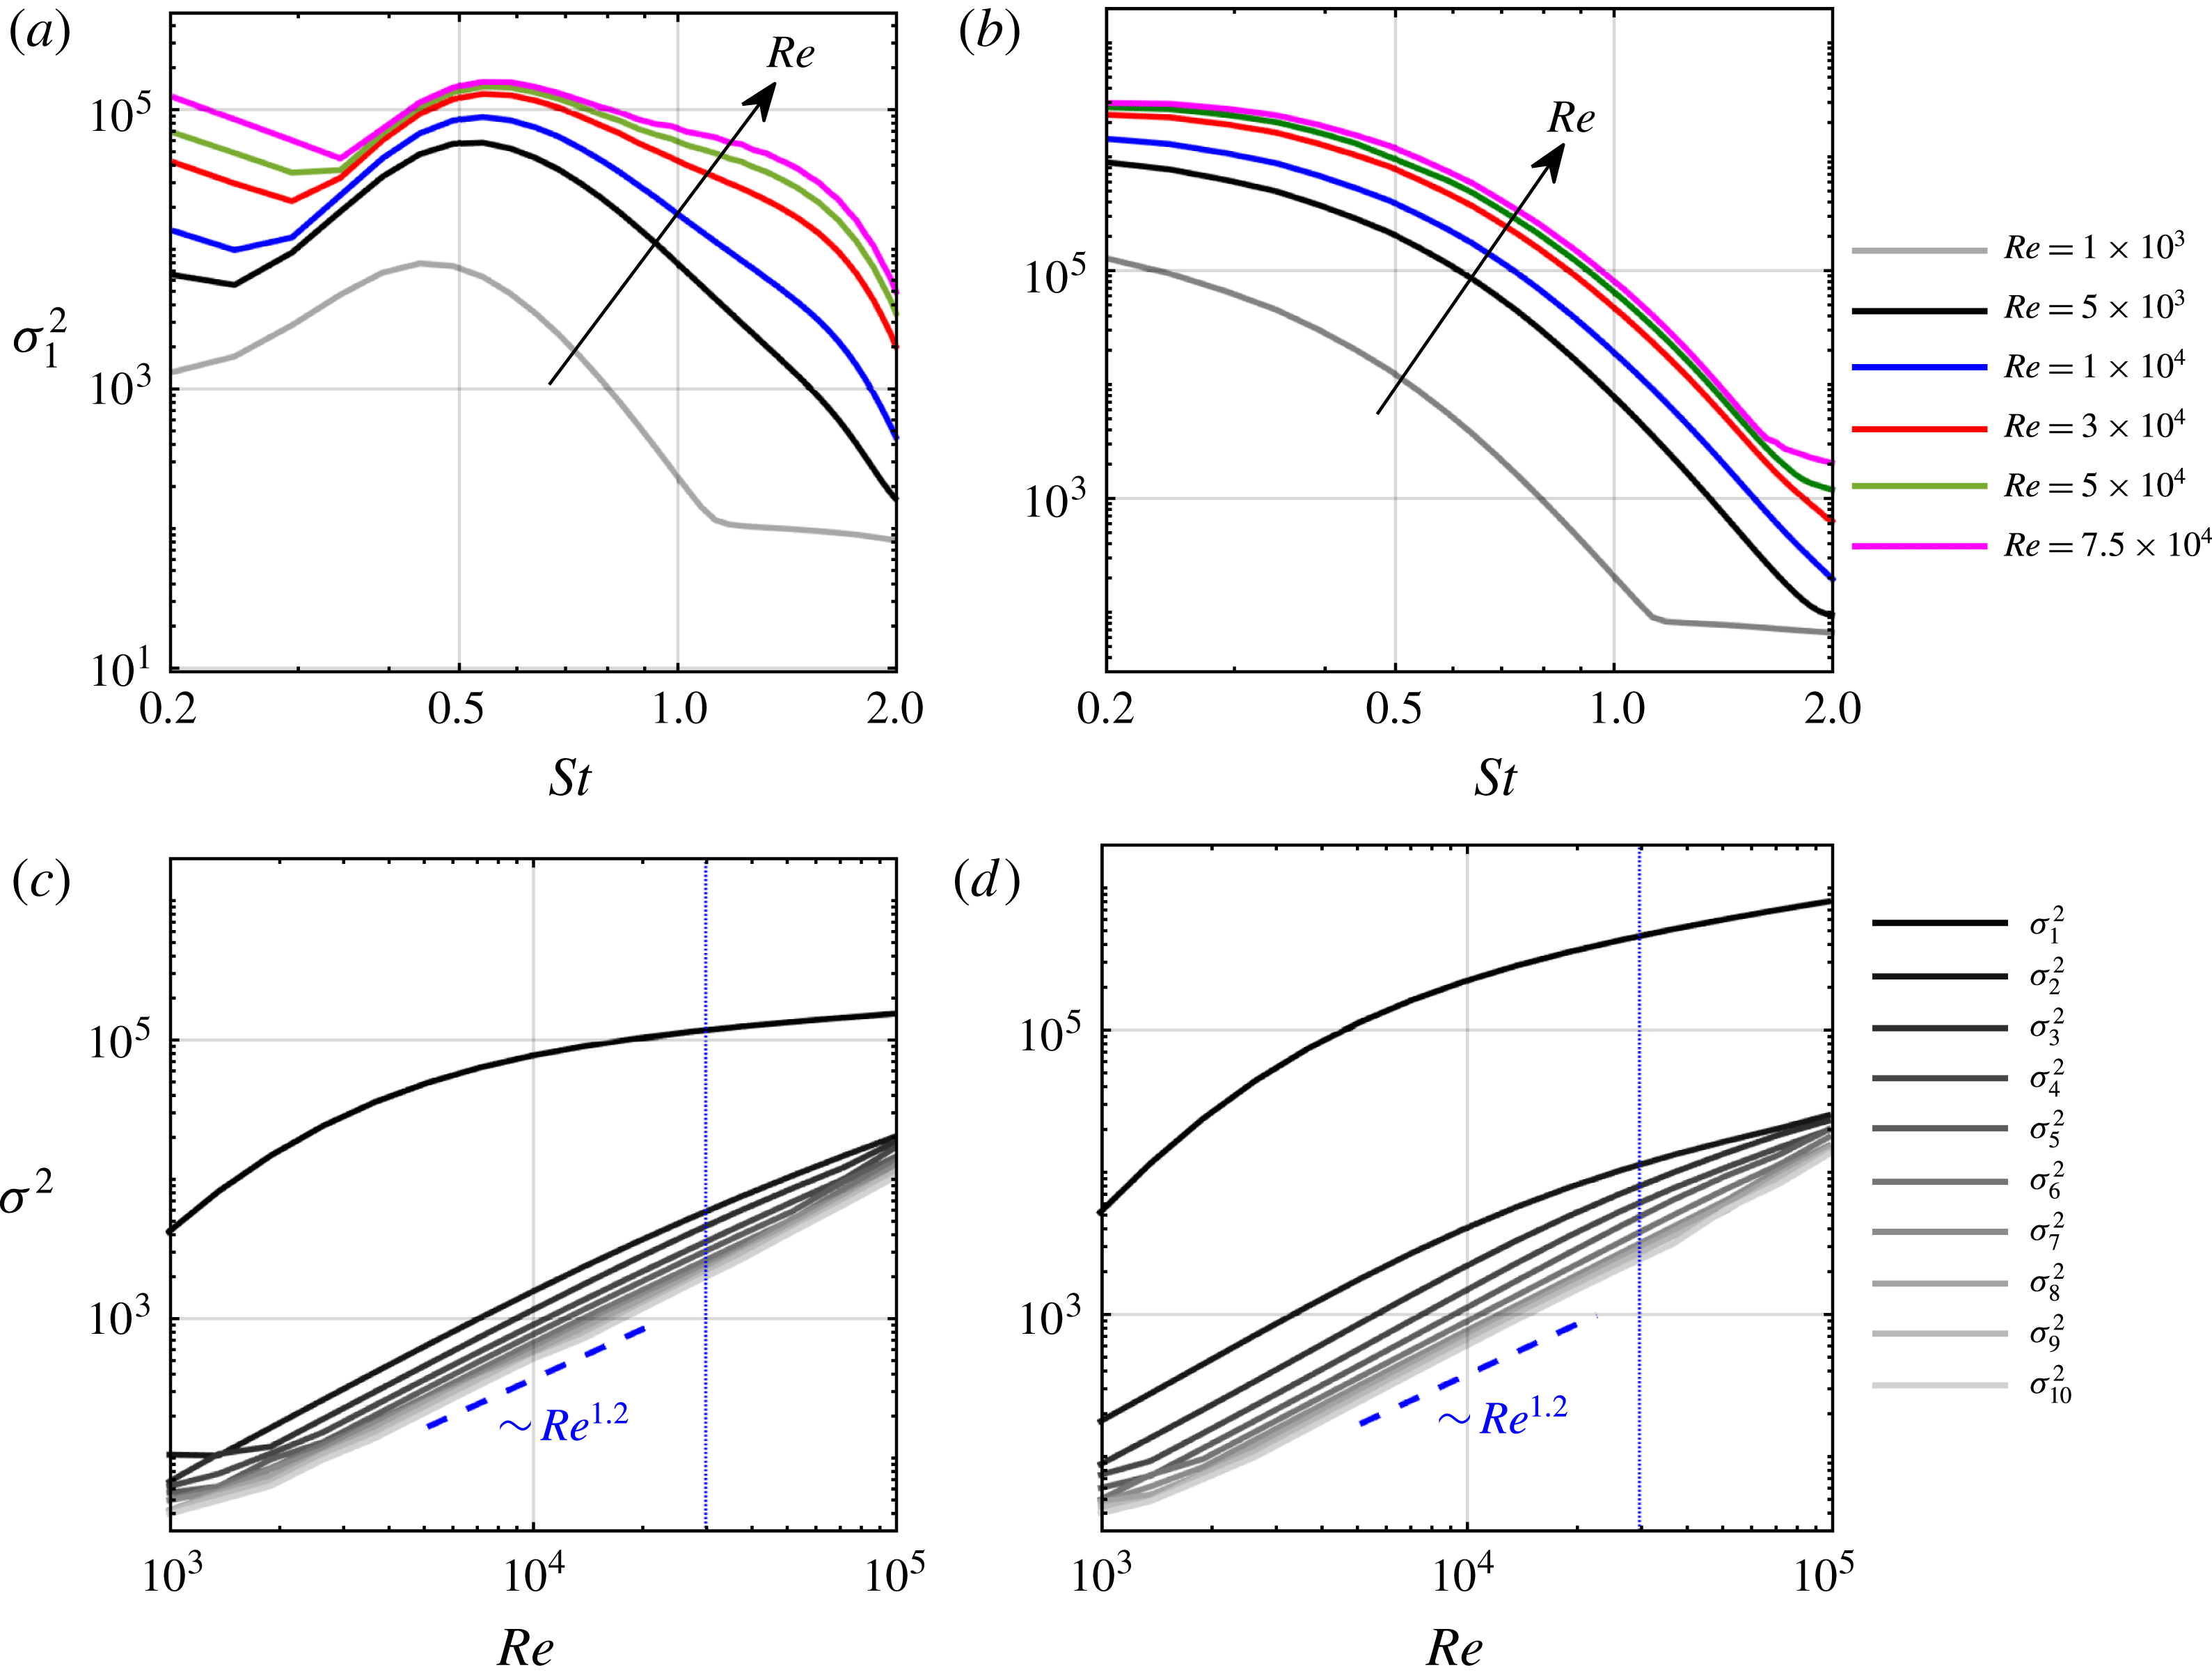
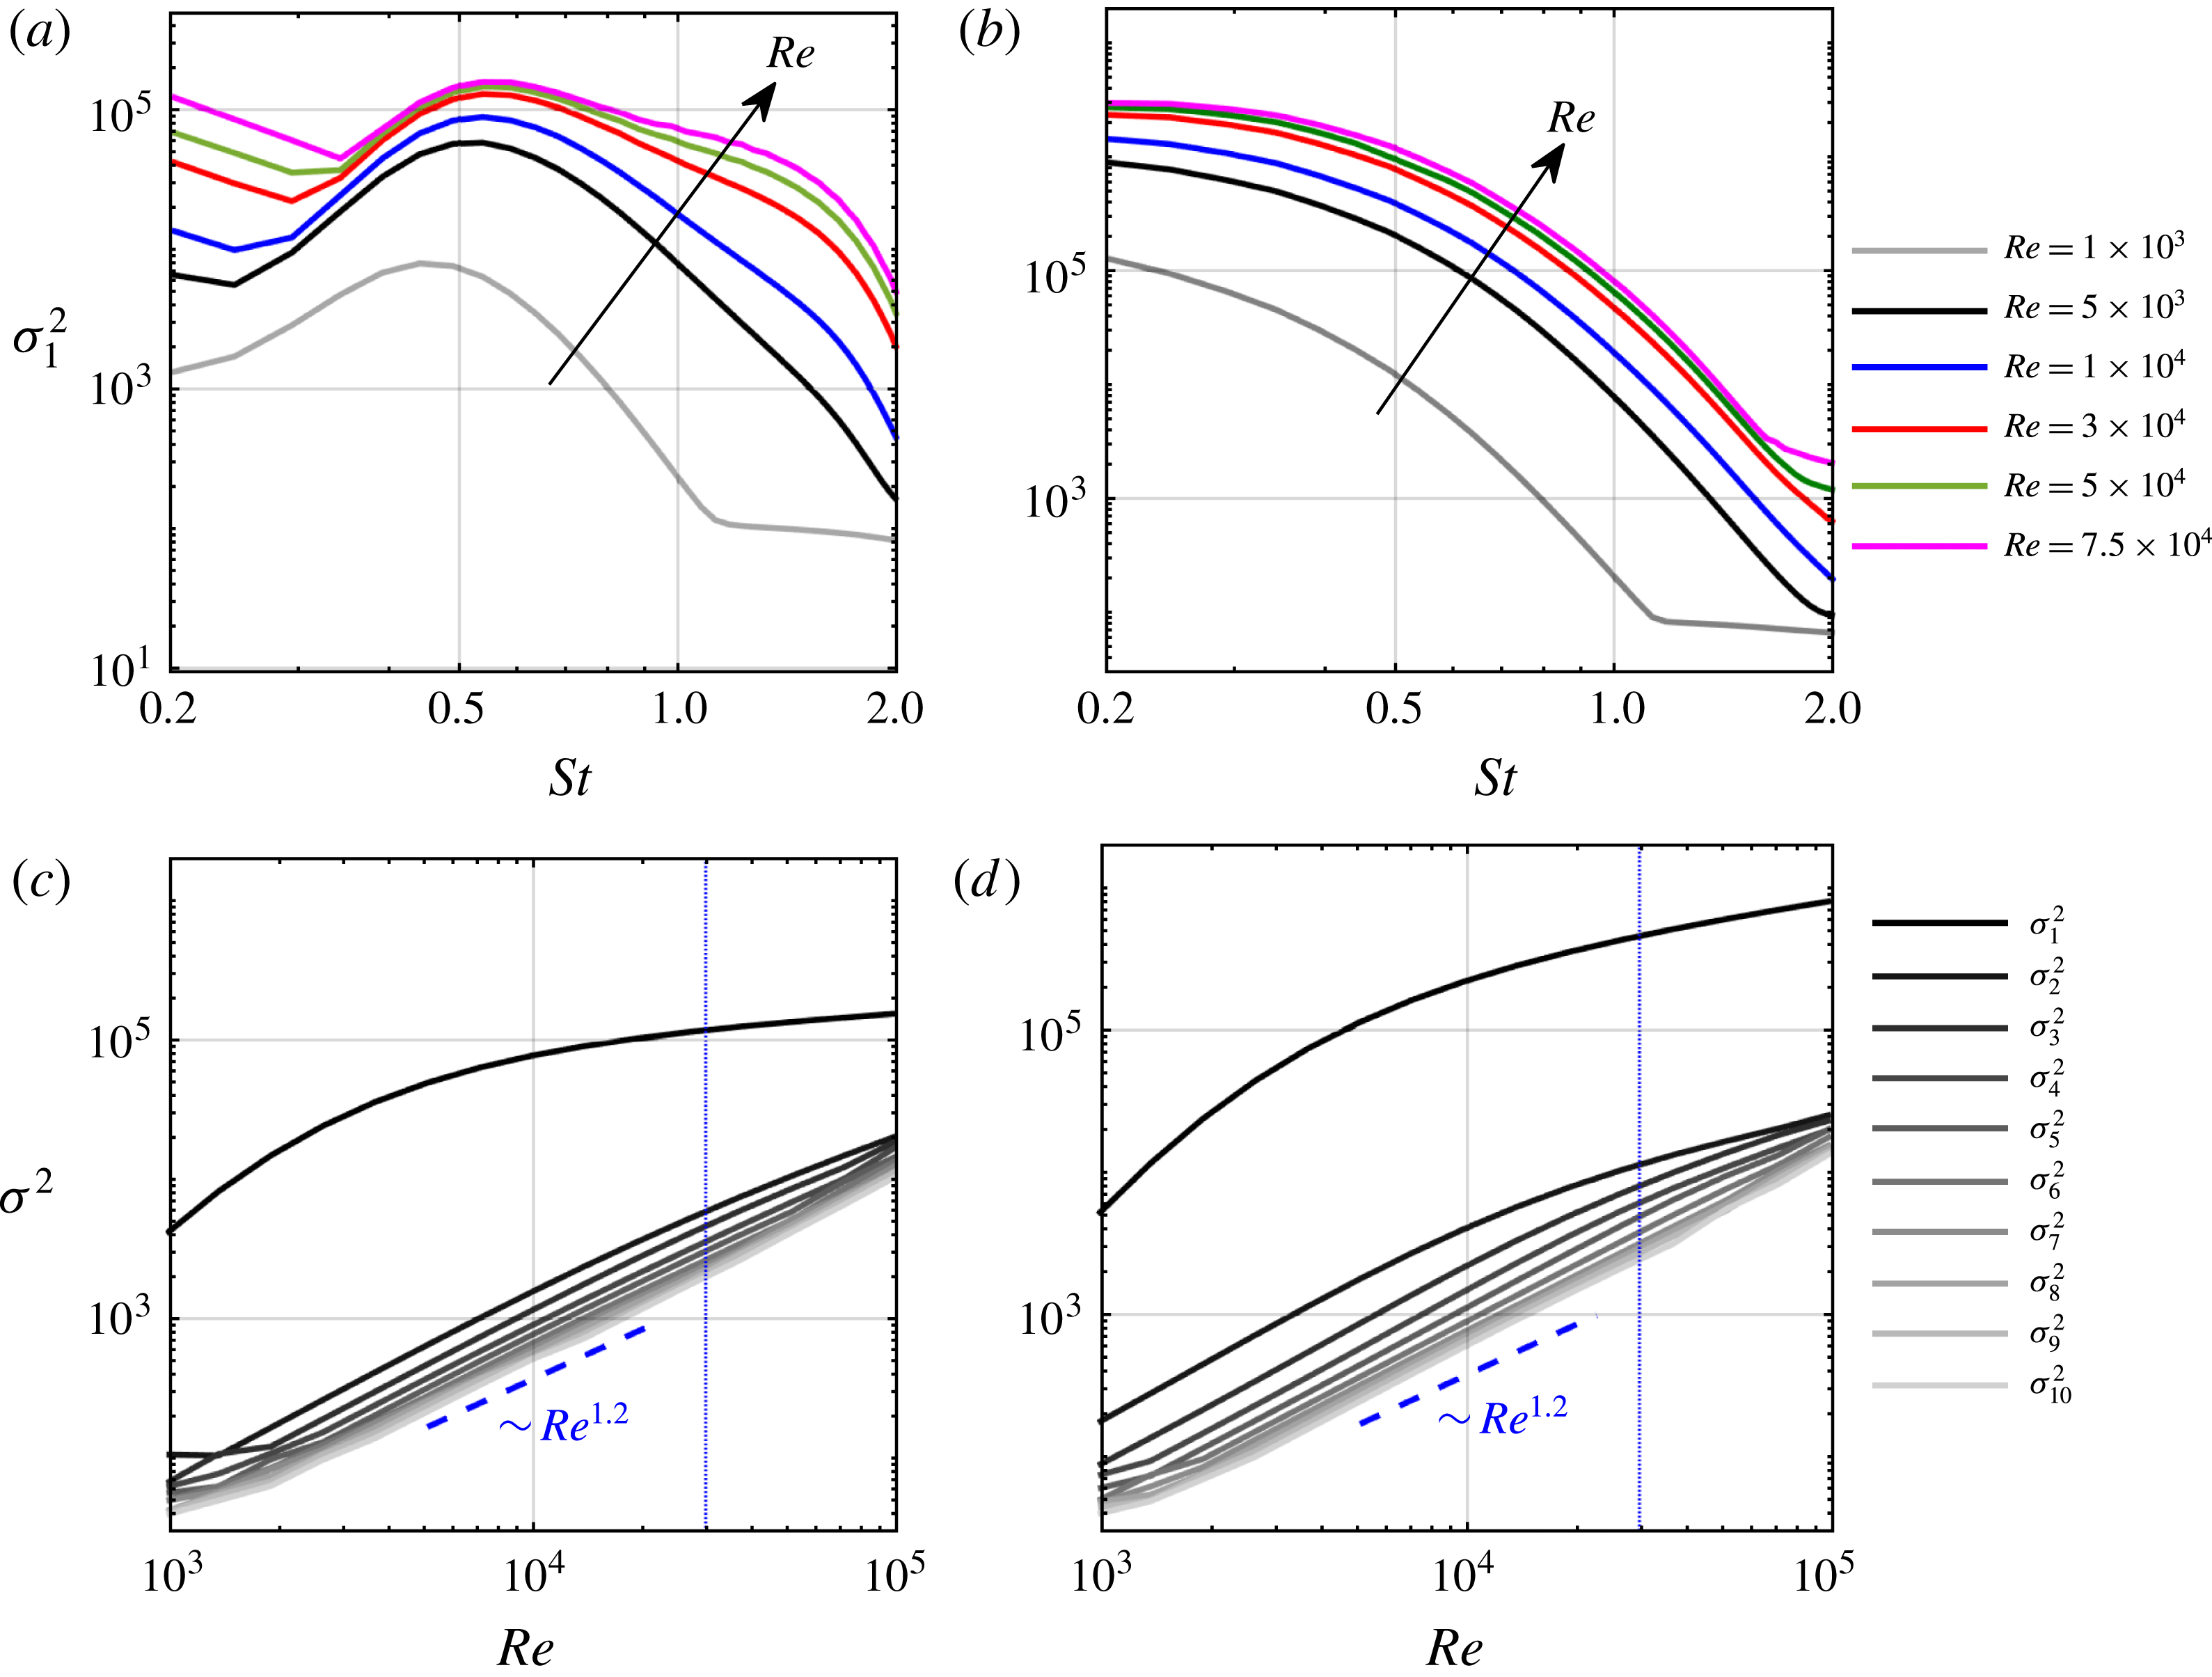
Reynolds number effect on the energetic gain of the subsonic jet: (a,b) optimal gain spectra for
 $m=0$
and
 $m=1$
; (c,d) energetic gain at
 $St=0.6$
for
 $m=0$
and
 $m=1$
. The blue dashed line marks the Reynolds number
 $Re=3\times 10^{4}$
used for the present study.
The effect of the Reynolds number on the spectrum of the discretized linearized Navier–Stokes operator
 $\unicode[STIX]{x1D63C}_{m}$
is studied in Schmidt et al. (Reference Schmidt, Towne, Colonius, Cavalieri, Jordan and Brès2017, appendix D). In figure 9, the effect of the Reynolds number on the resolvent gain is investigated. The optimal gain
 $\unicode[STIX]{x1D70E}_{1}^{2}$
for
 $m=0$
and
 $m=1$
shown in figures 9(a) and 9(b), respectively, increases with increasing Reynolds number over the entire frequency range. Above
 $Re\geqslant 3\times 10^{4}$
, the gain does not show a pronounced dependence on the Reynolds number for all but the lowest frequencies for
 $m=0$
. The gain of the leading ten modes at a fixed frequency of
 $St=0.6$
is shown in figure 9(c,d). At this particular frequency, the optimal gain is significantly higher than the suboptimal gains, which are all of comparable magnitude. Similar to the modal energy gap in the SPOD analysis, this reflects the low-rank behaviour of the jet in the resolvent model. The suboptimal gains follow an approximate power law behaviour over the range of Reynolds number studied. The different behaviour of the optimal and the suboptimal gains highlights the disparate physical nature of the two mechanisms. Their different scalings highlight the importance of a proper choice of Reynolds number for mean-flow-based resolvent models. In particular, the model Reynolds number determines which of the two mechanisms dominates at a certain frequency. This becomes apparent, for example, for
 $m=0$
at low frequencies: the kink in the gain curves in figure 9(a), which marks the transition from one scaling to another, shifts to higher frequencies with increasing Reynolds number. For
 $Re=7.5\times 10^{4}$
, the exchange of optimal mechanisms occurs at
 $St\approx 0.35$
, whereas it occurs at
 $St\approx 0.25$
for
 $Re=5000$
. We chose a Reynolds number of
 $Re=3\times 10^{4}$
for the present study. This choice is motivated by the good correspondence with the LES, as discussed in the next section. For now, and in the absence of a proper model for the effective Reynolds number, the Reynolds number has to be understood as a free model parameter. Mettot, Sipp & Bézard (Reference Mettot, Sipp and Bézard2014), for example, demonstrate that resolvent analyses based on the linearized Reynolds-averaged Navier–Stokes (RANS) equations with modelled turbulence do not necessarily give superior results to our ad hoc approach.
5 Comparison of the SPOD and resolvent models
In this section, we make comparisons between the high-energy SPOD modes and the high-gain resolvent modes. This comparison is facilitated by recently established theoretical connections between the two methods (Towne et al. Reference Towne, Colonius, Jordan, Cavalieri and Brès2015; Semeraro et al. Reference Semeraro, Lesshafft, Jaunet and Jordan2016b ; Towne et al. Reference Towne, Schmidt and Colonius2018). Specifically, the resolvent operator relates the cross-spectral density of the nonlinear forcing to the cross-spectral density of the response. If the forcing were uncorrelated in space and time with equal amplitude everywhere, i.e. unit-variance white noise, then the SPOD and resolvent modes would be identical. This result is conceptually intuitive: when there is no bias in the forcing, the modes with highest gain are also the most energetic.
The nonlinear forcing terms in real turbulent flows are, of course, not white. Zare, Jovanović & Georgiou (Reference Zare, Jovanović and Georgiou2017) showed that it is necessary to account for correlated forcing in order to reconstruct the flow statistics of a turbulent channel flow using a linear model. Of particular relevance to our study, Towne, Brès & Lele (Reference Towne, Brès and Lele2017a ) investigated the statistical properties of the nonlinear forcing terms in a turbulent jet. They found limited correlation in the near-nozzle shear layer but significant correlation further downstream, especially near and beyond the end of the potential core.
Correlated nonlinear forcing leads to differences between SPOD and resolvent modes. Precisely, the correlation causes a bias in the forcing that preferentially excites certain resolvent modes and mixes them together via correlations between different modes (Towne et al. Reference Towne, Schmidt and Colonius2018). As a result, multiple resolvent modes are required to reconstruct each SPOD mode. Accordingly, we do not expect a one-to-one correspondence between the SPOD and resolvent modes of the jet. Rather, we are looking for the signatures of the high-gain resolvent modes within the high-energy SPOD modes. That is, we seek evidence that the mechanisms identified in the resolvent modes are active in the real flow and responsible for the most energetic coherent structures.
First SPOD mode energy spectra (a) and optimal resolvent gain (b) for
 $0\leqslant m\leqslant 3$
for the subsonic jet. A five-point moving average filter was used to increase the clarity of the SPOD spectrum.

Empirical SPOD modes (a,c,e,g,i,k) and optimal resolvent response modes (b,d,f,h,j,l) for
 $St=0.6$
and
 $m=0$
for the subsonic jet. The normalized pressure is shown. The leading resolvent response in (b) accurately models the leading SPOD mode in (a).

The leading mode SPOD energy spectra (see figure 3) and optimal resolvent gain curves (see figure 8) for
 $m=0,\ldots ,3$
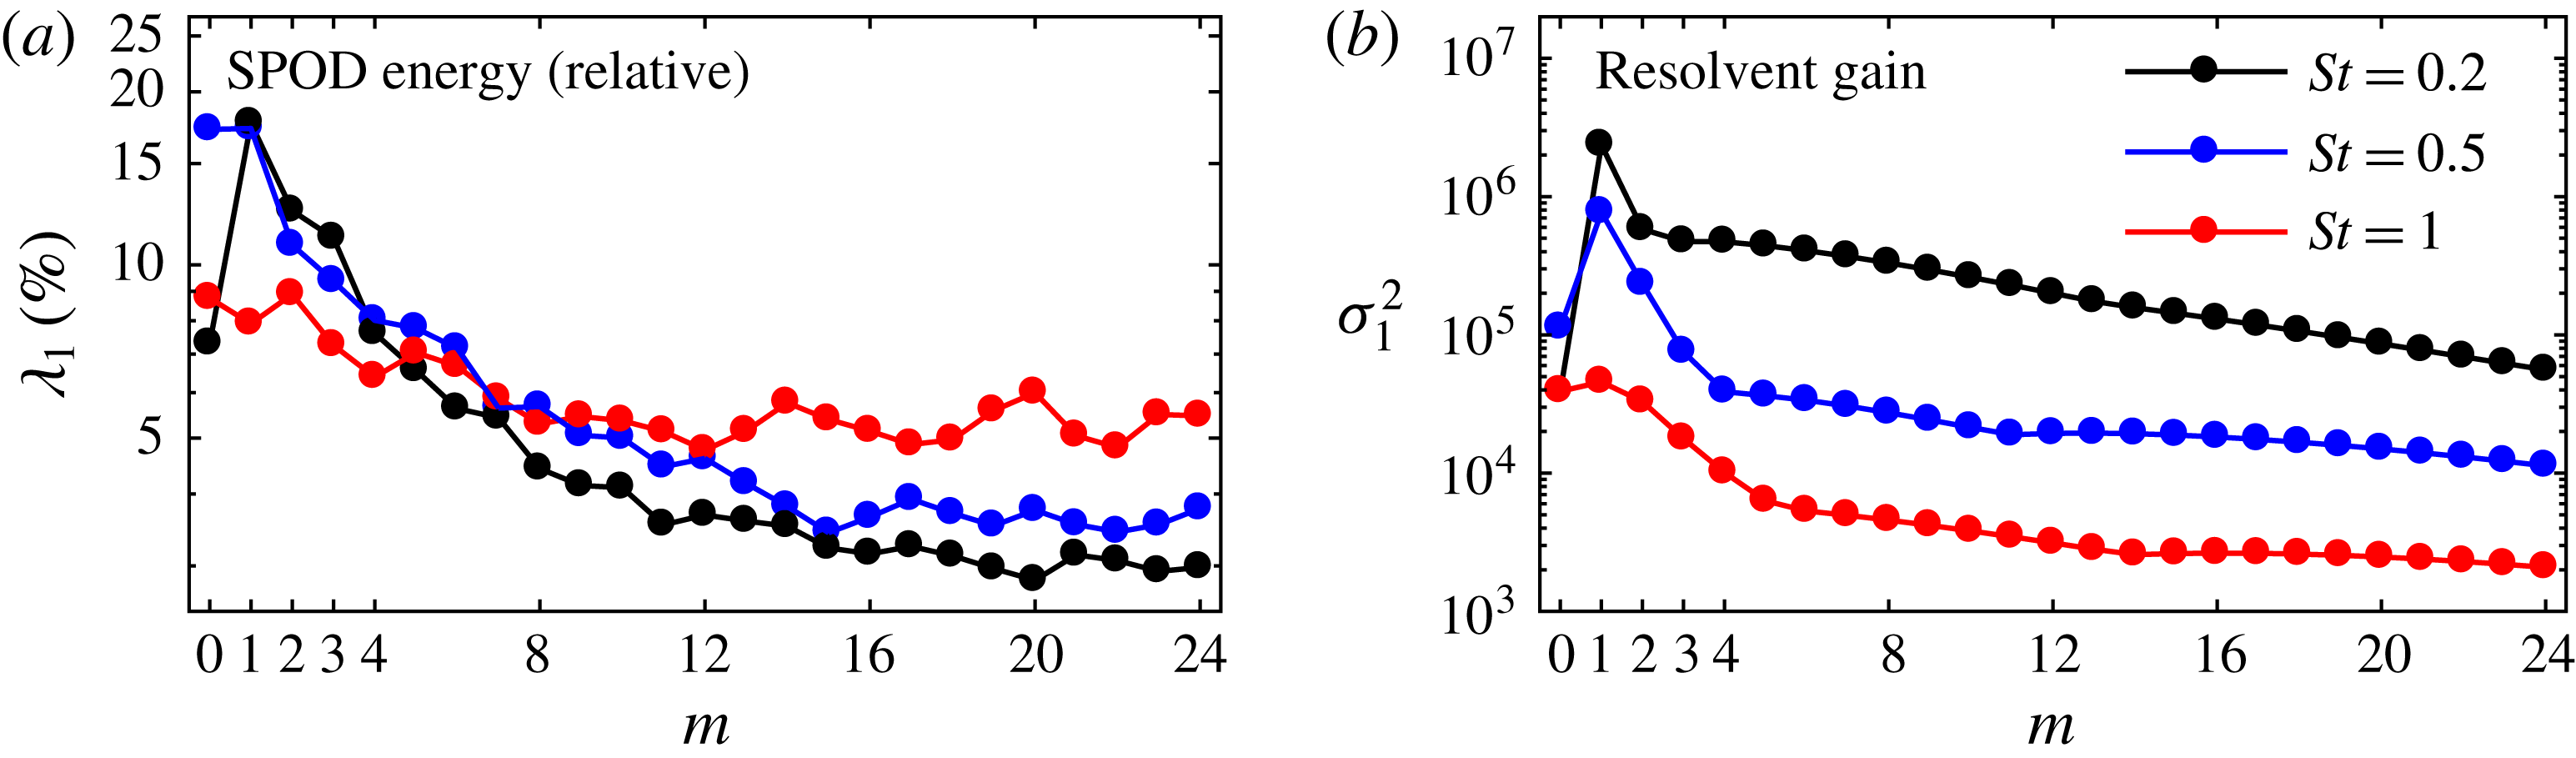
are compared in figure 10. In figure 10(a), we show the relative energy of the leading mode in percentages of the total energy at each frequency. We choose this quantity as a qualitative surrogate for the gain, which is not defined for the LES data. The resolvent gain curves capture the trends of the SPOD eigenspectra remarkably well. The peak in relative energy of the leading
 $m=0$
SPOD mode in figure 10(a) clearly indicates low-rank behaviour. At low frequencies, the ordering of the resolvent gains is directly reflected in the relative importance of the corresponding SPOD modes.
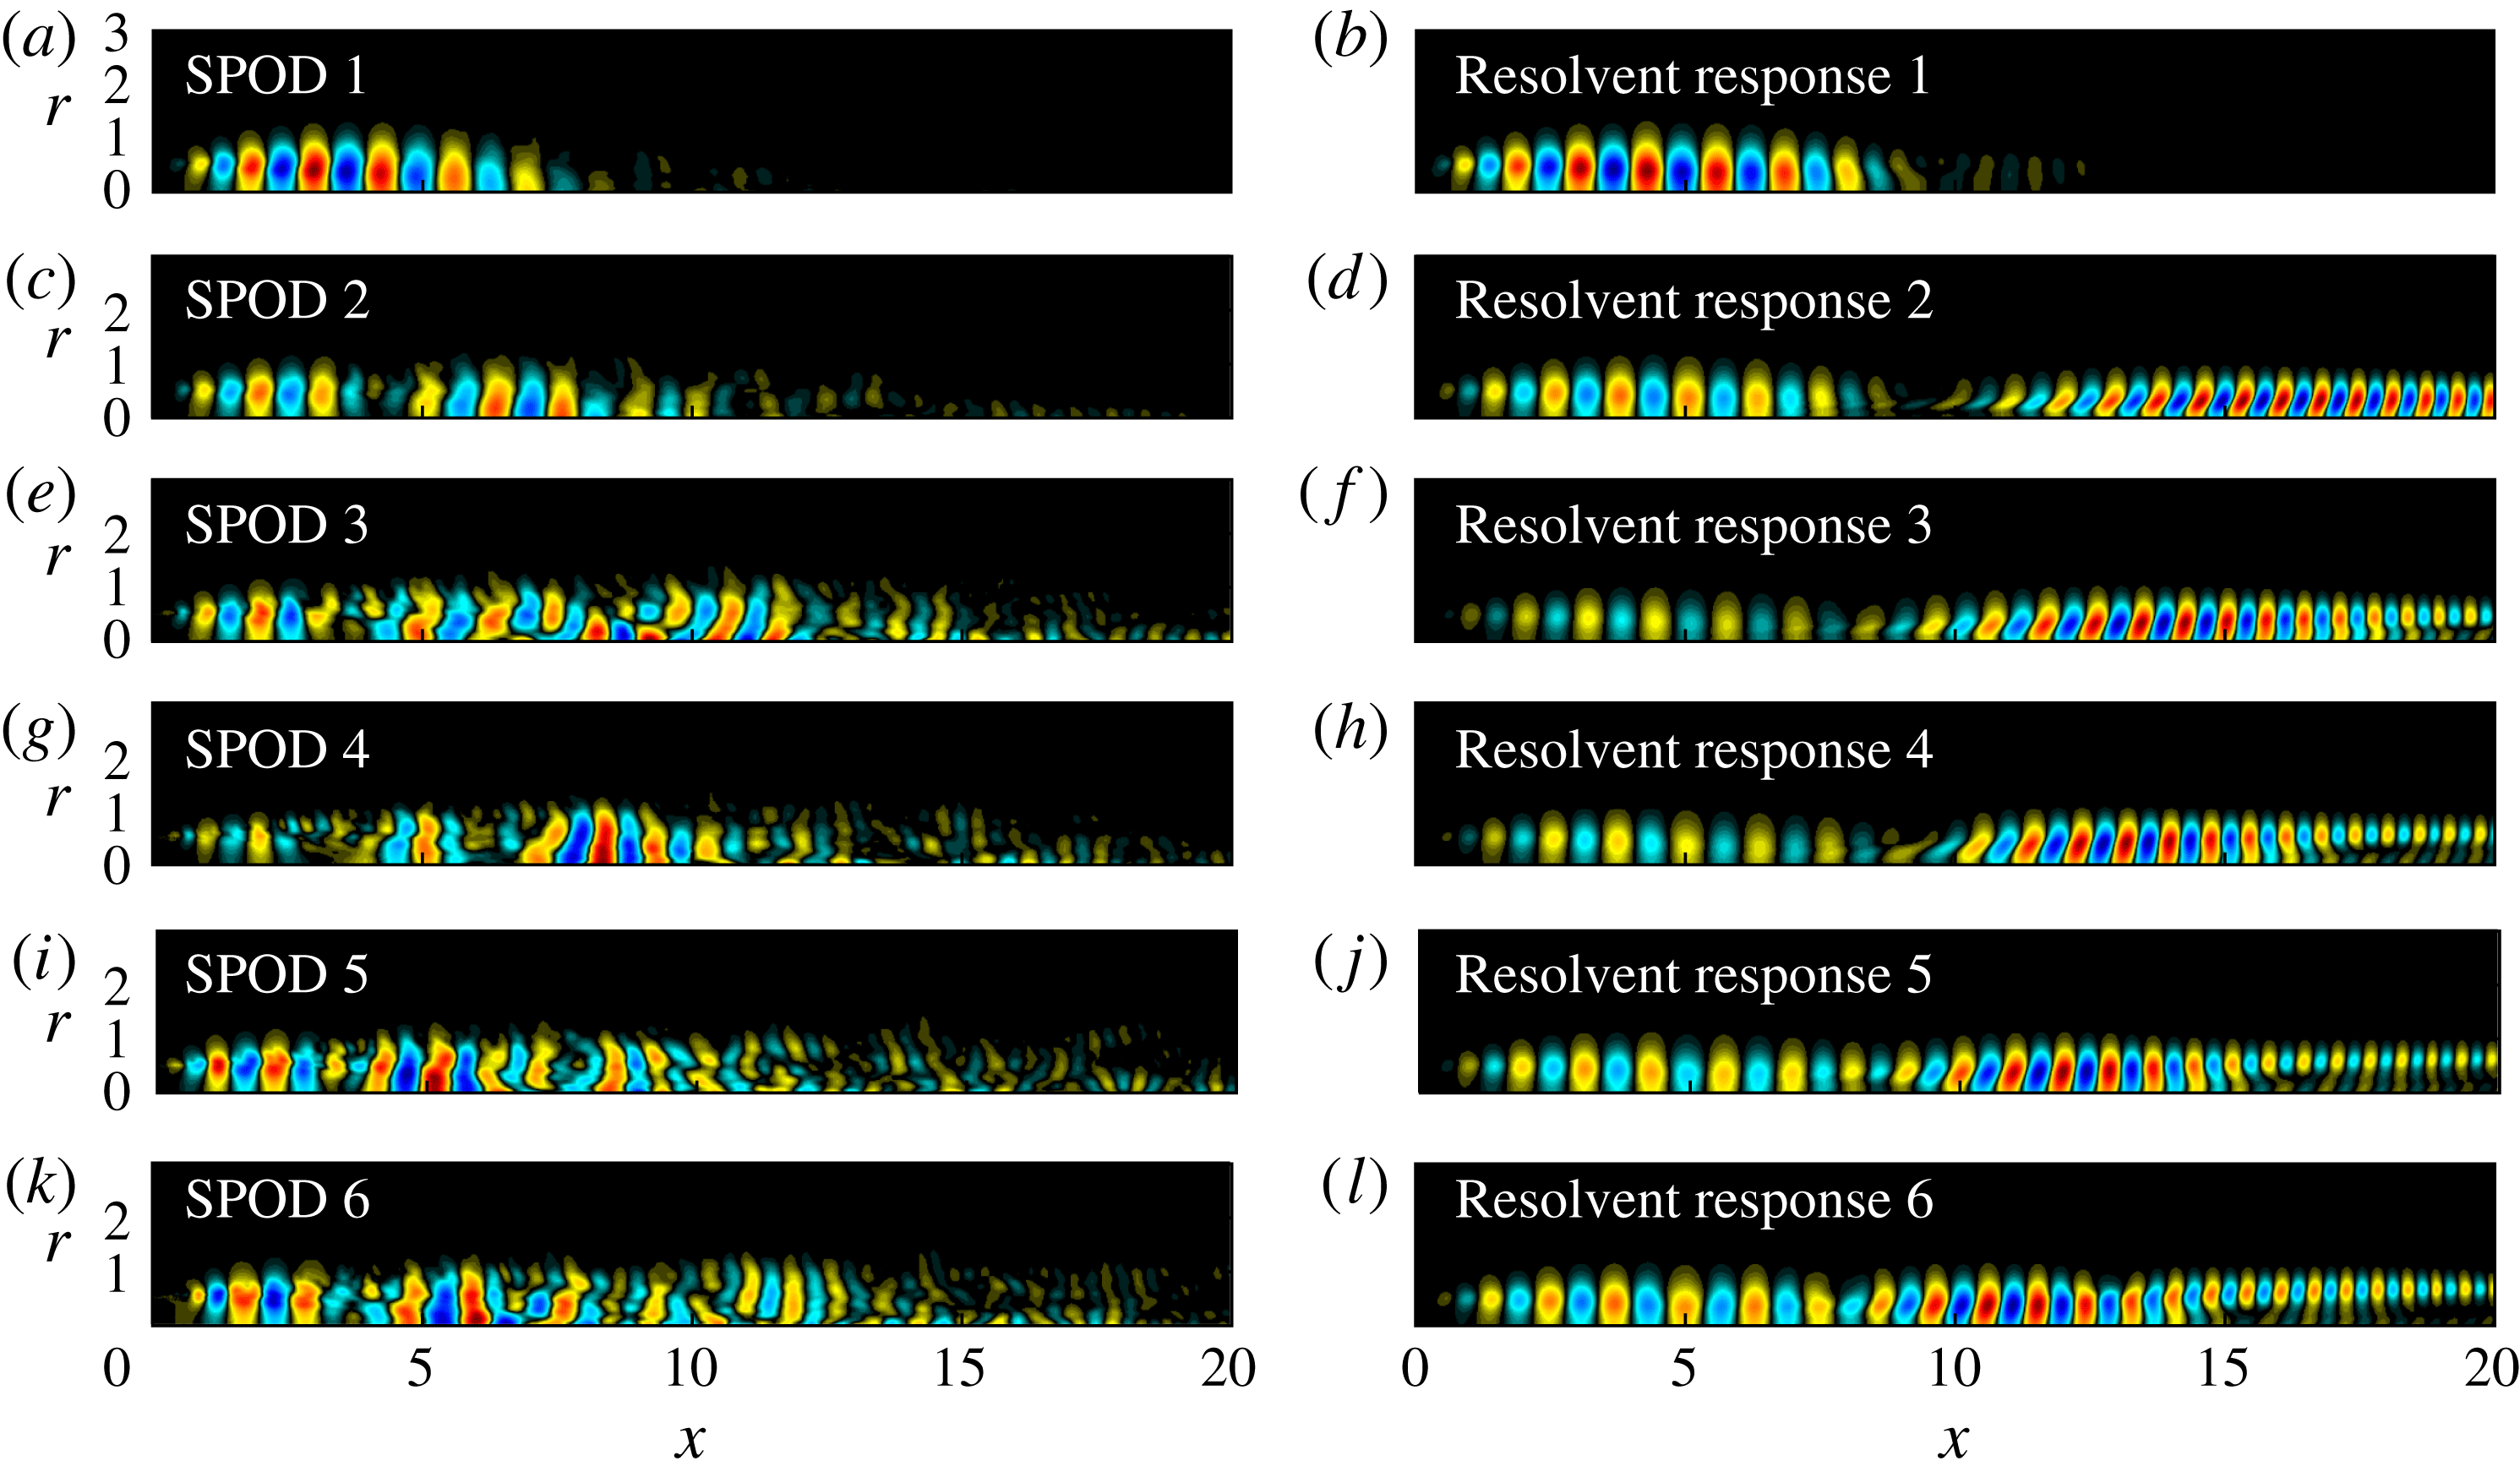
A comparison of the six leading resolvent and SPOD modes for
 $m=0$
and
 $St=0.6$
is shown in figure 11. The KH-type wavepacket of the first SPOD mode in 11(a) closely resembles the optimal resolvent mode in figure 11(b). Unlike the resolvent responses (as discussed in the context of figure 6), the subdominant SPOD modes do not follow an immediately obvious hierarchy. Similar to the resolvent modes, they exhibit a multi-lobe structure and peak downstream or at the end of the potential core. Close to the nozzle, their structure resembles the KH-type waveform of the first mode. Their highly distorted structure suggests that their statistics may not be as well converged as the leading mode. The first three modes are characterized by an increasing integer number of lobes or successive wavepackets (this becomes much more evident in figure 14 below).
Comparison between leading empirical SPOD modes (a,c,e,g,i,k,m,o,q) and optimal resolvent response modes (b,d,f,h,j,l,n,p,r) at three representative frequencies for the subsonic jet: (a–f)
 $m=0$
; (g–l)
 $m=1$
; (m–r)
 $m=3$
. The normalized pressure is shown. The leading modes compare favourably with the exception of the low frequency case for
 $m=0$
shown in (e,f), where the SPOD mode is of KH type, whereas the optimal response mode is of Orr type. Only part of the computational domain is shown for clarity.

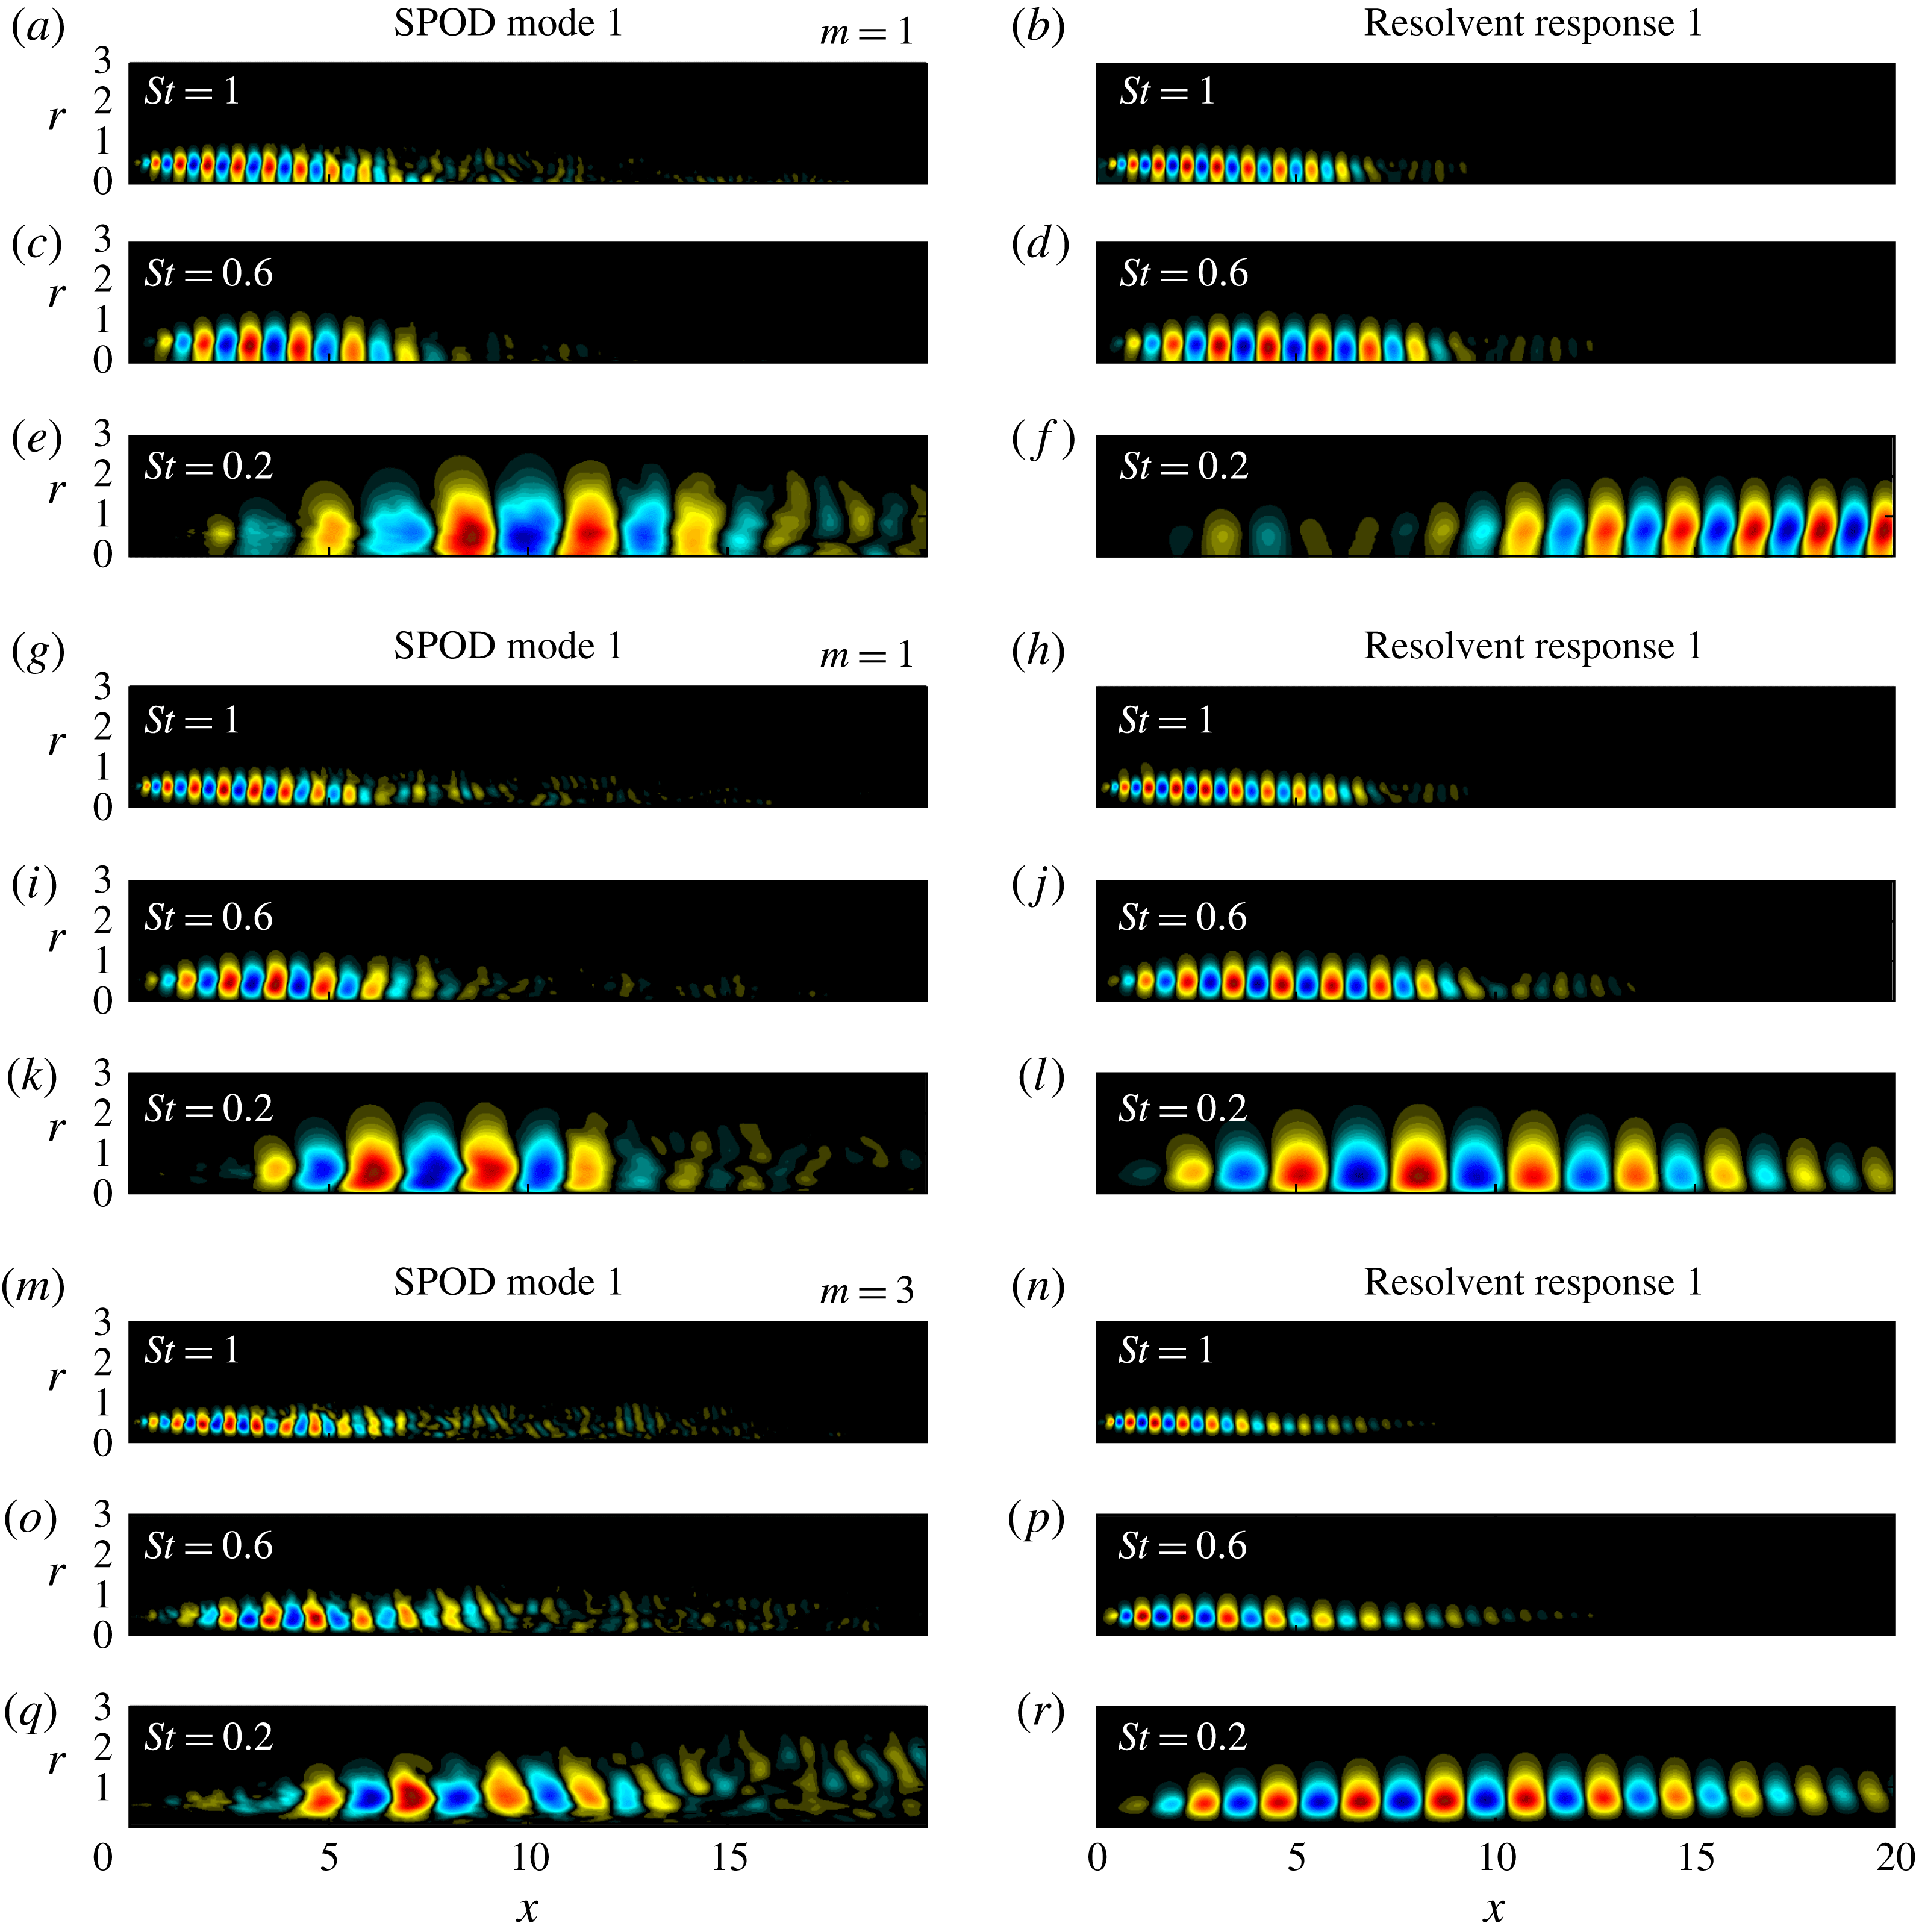
Figure 12 makes direct comparisons between the leading SPOD and resolvent modes for different frequencies (
 $St=1.0,0.6,0.2$
) and azimuthal wavenumbers (
 $m=0,1,3$
). In general, the modes compare well for frequency–azimuthal wavenumber combinations that exhibit low-rank behaviour according to the SPOD and resolvent gain spectra in figures 3 and 8, respectively. For example, good agreement is obtained for
 $St=0.6$
and
 $St=1.0$
for
 $m=0$
and
 $m=1$
, i.e. figure 12(a–d,g–j). In figure 12(e,f), the leading resolvent mode is an Orr-type wavepacket far downstream of the potential core, whereas the SPOD mode peaks further upstream and has a larger axial wavelength. For
 $m=3$
in figure 12(m–q) and higher azimuthal wavenumbers, the SPOD modes appear to be less well converged as compared to their low
 $m$
counterparts. This is, again, explained by the observation that the low-rank behaviour decreases as
 $m$
increases.
Isolation of the mechanisms for spatial modal growth in the initial shear layer, and non-modal spatial growth further downstream for the subsonic jet: (a) SPOD spectra; (b) optimal resolvent gain spectra; (c–f) normalized pressure field for
 $St=0.6$
. For the SPOD, the restriction is realized via the weight matrix and the non-zero weighted regions are shown. For the resolvent analysis, the forcing and response are restricted via the input and output matrices.

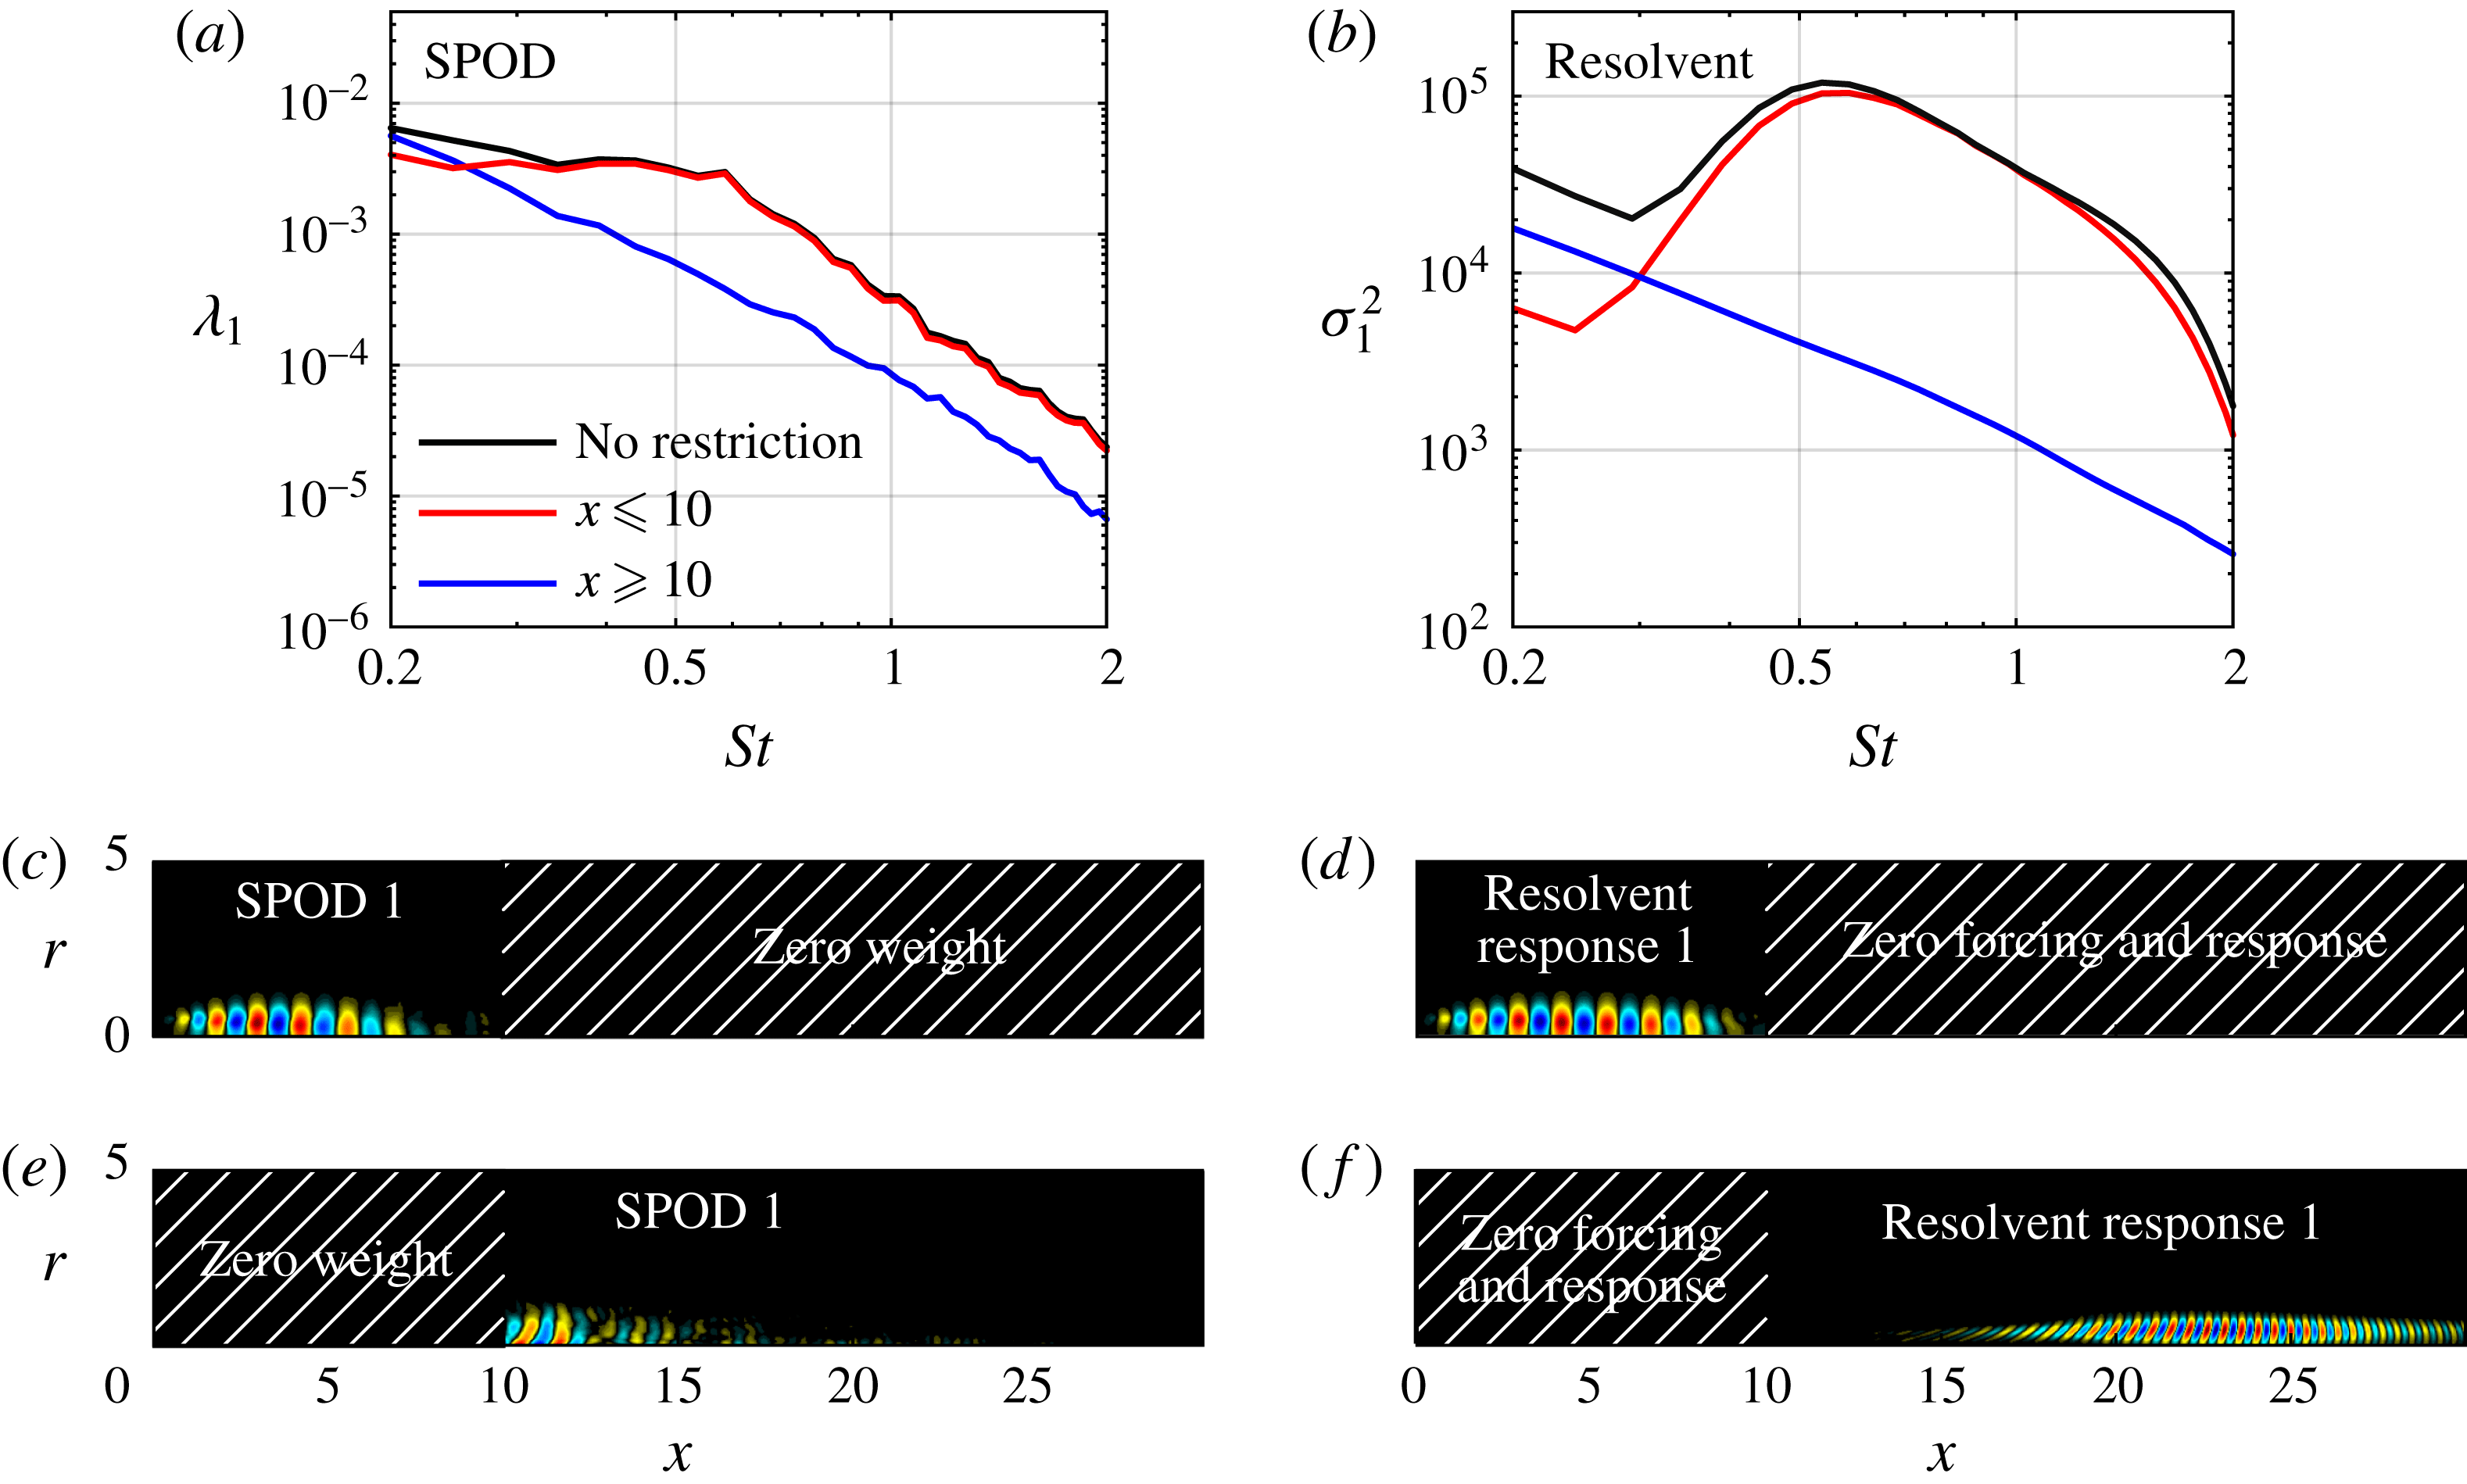
Both the SPOD and resolvent methodologies allow us to isolate the characteristics of the KH-type wavepackets near the nozzle and the downstream Orr-type wavepackets through their different spatial support. In the SPOD analysis, we utilize the weight matrix
 $\unicode[STIX]{x1D652}$
to assign zero weight to the region we wish to exclude, e.g.
 $x>10$
, to focus on the initial shear-layer region and vice versa for the developing jet region. The resulting energy spectra and modes are depicted in figure 13(a,c,e). For the resolvent analysis, we restrict both the forcing and the response to the region of interest through the input and output matrices
 $\unicode[STIX]{x1D63D}$
and
 $\unicode[STIX]{x1D63E}$
. The resulting gain spectra and modes are shown in figure 13(b,d,f). The SPOD and gain spectra consistently separate the two mechanisms. In both cases, the spectra obtained without spatial restriction are a superposition of the spectra of the two isolated physical mechanisms. The different spatial support of the restricted SPOD (figure 13
e) and resolvent (figure 13
f) modes emphasizes that the forcing of the subdominant mode is clearly not white, though there are obvious similarities in the wavepacket shape indicating a similar mechanism.
Frequency–axial distance diagrams (

 $\tilde{P}_{pp}$
) along the lip line (
 $r_{0}=0.5$
) for
 $m=0$
(top half) and
 $m=1$
(bottom half) for the subsonic jet. The three leading SPOD and resolvent modes are compared. The estimated pressure PSD,
 $\bar{P}_{pp}$
, is normalized by its maximum value at each frequency. The end of the potential core (- - -,
 $x=5.3$
), and a Strouhal number of
 $St=0.3$
(—— blue) differentiate shear layer from developing jet behaviour. The different frequency scalings of shear layer (—— magenta,
 $St\sim 1/x$
) and jet wavepackets (—— green,
 $St\sim 1/x^{2}$
) are indicated.

Plotting the temporal and azimuthal PSD,
 $$\begin{eqnarray}\tilde{P}_{qq}=\frac{1}{n_{blk}}\mathop{\sum }_{l=1}^{n_{blk}}|\hat{q}_{m\unicode[STIX]{x1D714}}^{(l)}(x,r=r_{0})|^{2},\end{eqnarray}$$
as a function of
 $x$
along a line of constant distance
 $r_{0}$
from the axis allows us to locate the wavepackets in space. The resulting frequency–axial distance diagrams are shown in figure 14 for
 $m=0$
and
 $m=1$
. The results for the SPOD and the resolvent response modes are directly compared. This form of visualization of the SPOD modes brings to light the hierarchal structure of the SPOD modes more clearly. From figures 12(a–c) for
 $m=0$
, and 12(g–i) for
 $m=1$
, respectively, it becomes apparent that the higher-order modes are characterized by an increasing number of subsequent wavepackets in the streamwise direction.
The change from KH-type shear-layer instability to Orr-type wavepackets in the developing jet is apparent from the change of the slope of the PSD at
 $(x,St)\approx (6,0.3)$
. Different frequency scalings in the two regions explain this sudden change. They can be directly deduced from the varying characteristic velocity and length scales of each region as shown in figure 2. The initial shear layer grows linearly as
 $\unicode[STIX]{x1D6FF}_{\unicode[STIX]{x1D703}}\sim x$
while the characteristic velocity in that region, for example taken as
 $(1/2)u_{c}$
, stays constant as
 $u_{c}\neq f(x)$
. The frequency of the high-frequency wavepackets therefore scales with
 $St\sim u_{c}/\unicode[STIX]{x1D6FF}_{\unicode[STIX]{x1D703}}\sim 1/x$
. The radial extent of the jet in the developing and self-similar jet regions and can be characterized by the jet’s half-width
 $r_{1/2}(x)$
defined as
 $\overline{u(x,r_{1/2})}=(1/2)u_{c}(x)$
. It increases linearly with
 $x$
(Pope Reference Pope2000). The centreline velocity, however, decays in inverse proportion to the axial distance. The frequency in that region consequently scales with
 $St\sim u_{c}/r_{1/2}\sim 1/x^{2}$
. The different frequency scalings in the two regions of the jet are apparent in other studies on wavepacket modelling (Cavalieri et al.
Reference Cavalieri, Sasaki, Jordan, Schmidt, Colonius and Brès2016; Sasaki et al.
Reference Sasaki, Cavalieri, Jordan, Schmidt, Colonius and Brès2017), and on acoustic-source localization (Bishop, Ffowcs Williams & Smith Reference Bishop, Ffowcs Williams and Smith1971; Schlinker et al.
Reference Schlinker, Simonich, Shannon, Reba, Colonius, Gudmundsson and Ladeinde2009).
The optimal response modes in figures 14(d) and 14(j) accurately predict the wavepacket location in the initial shear-layer region in the leading SPOD modes. For
 $m=1$
in figure 14(j), the low-rank behaviour of the jet permits accurate predictions at low frequencies. For
 $m=0$
(figure 14
d), on the contrary, the non-low-rank behaviour at low frequencies hinders a rank-one resolvent mode representation of the leading SPOD mode. Similarly, the subdominant SPOD modes shown in figures 14(b,c) and 14(h,i) cannot be represented by a single suboptimal resolvent mode.
Azimuthal wavenumber dependence of the relative modal energy of the SPOD (a), and the optimal resolvent gain (b) for three representative frequencies for the subsonic jet.

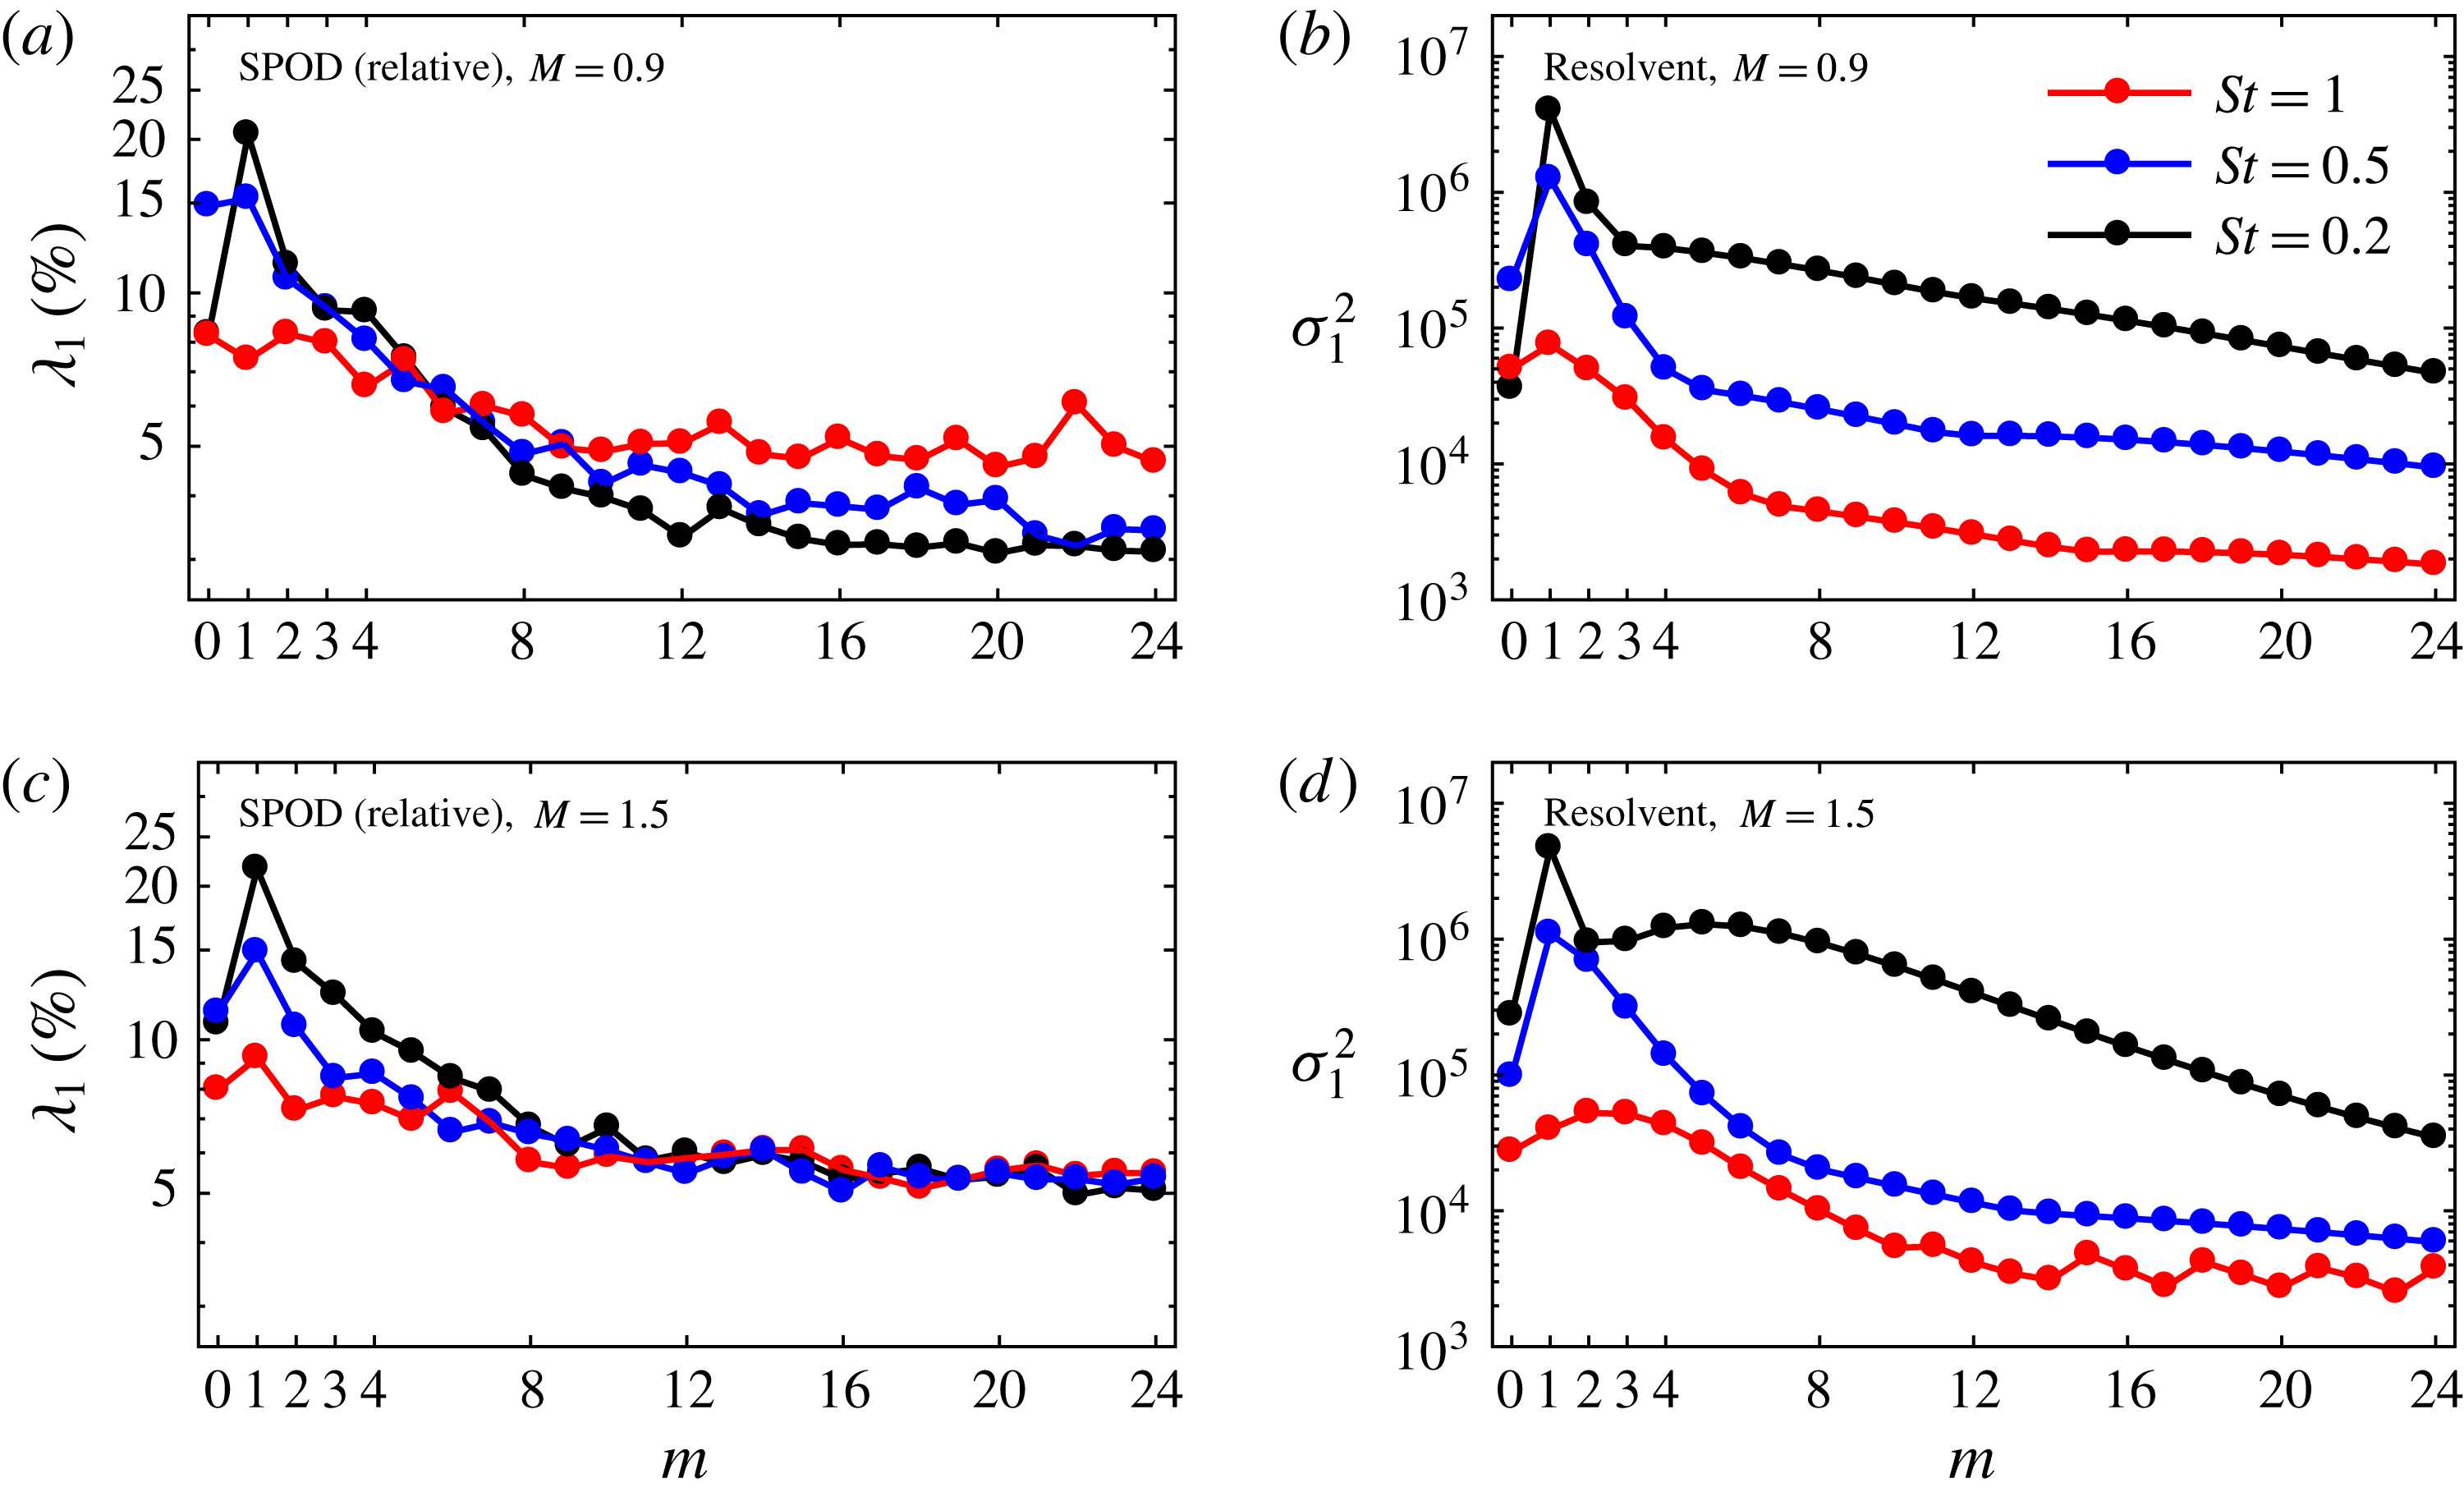
The azimuthal wavenumber dependence of the SPOD energy and the resolvent gain is investigated in figure 15. As in figure 10, we show the percentage of the energy of the first SPOD mode to highlight low-rank behaviour. The fall-off of the SPOD energy spectra seen in figure 15(a) implies that the low-rank behaviour is more pronounced at low azimuthal wavenumbers and lower frequencies. For higher frequencies such as
 $St=1$
, the relative energy of the first SPOD mode is not a strong function of the azimuthal wavenumber. At higher azimuthal wavenumbers
 $m\gtrsim 10$
, its relative energy content stays at
 ${\approx}5\,\%$
, which is above the levels of the two lower-frequency cases. Similar trends are observed for the resolvent gain shown in figure 15(b). The maximum gain, for example, is attained for
 $m=1$
, and the gain curve for the highest frequency is a much weaker function of the azimuthal wavenumber than in the case of two lower frequencies. For higher azimuthal wavenumbers, the gain falls off almost monotonically.
6 Effect of the Mach number
In the following, we address the effect of compressibility on the low-rank behaviour. SPOD and resolvent analyses are conducted for the other two LES cases with
 $M_{j}=0.9$
and
 $M_{j}=1.5$
, respectively (see table 1). The main conclusions drawn from the analysis of the subsonic case in §§ 3–4 regarding the behaviour of the KH- and Orr-type wavepackets apply to the other regimes as well. We therefore catalogue the complete results for the two additional higher Mach number cases in the Appendix, and focus on specific Mach-number-dependent physical effects in this section.
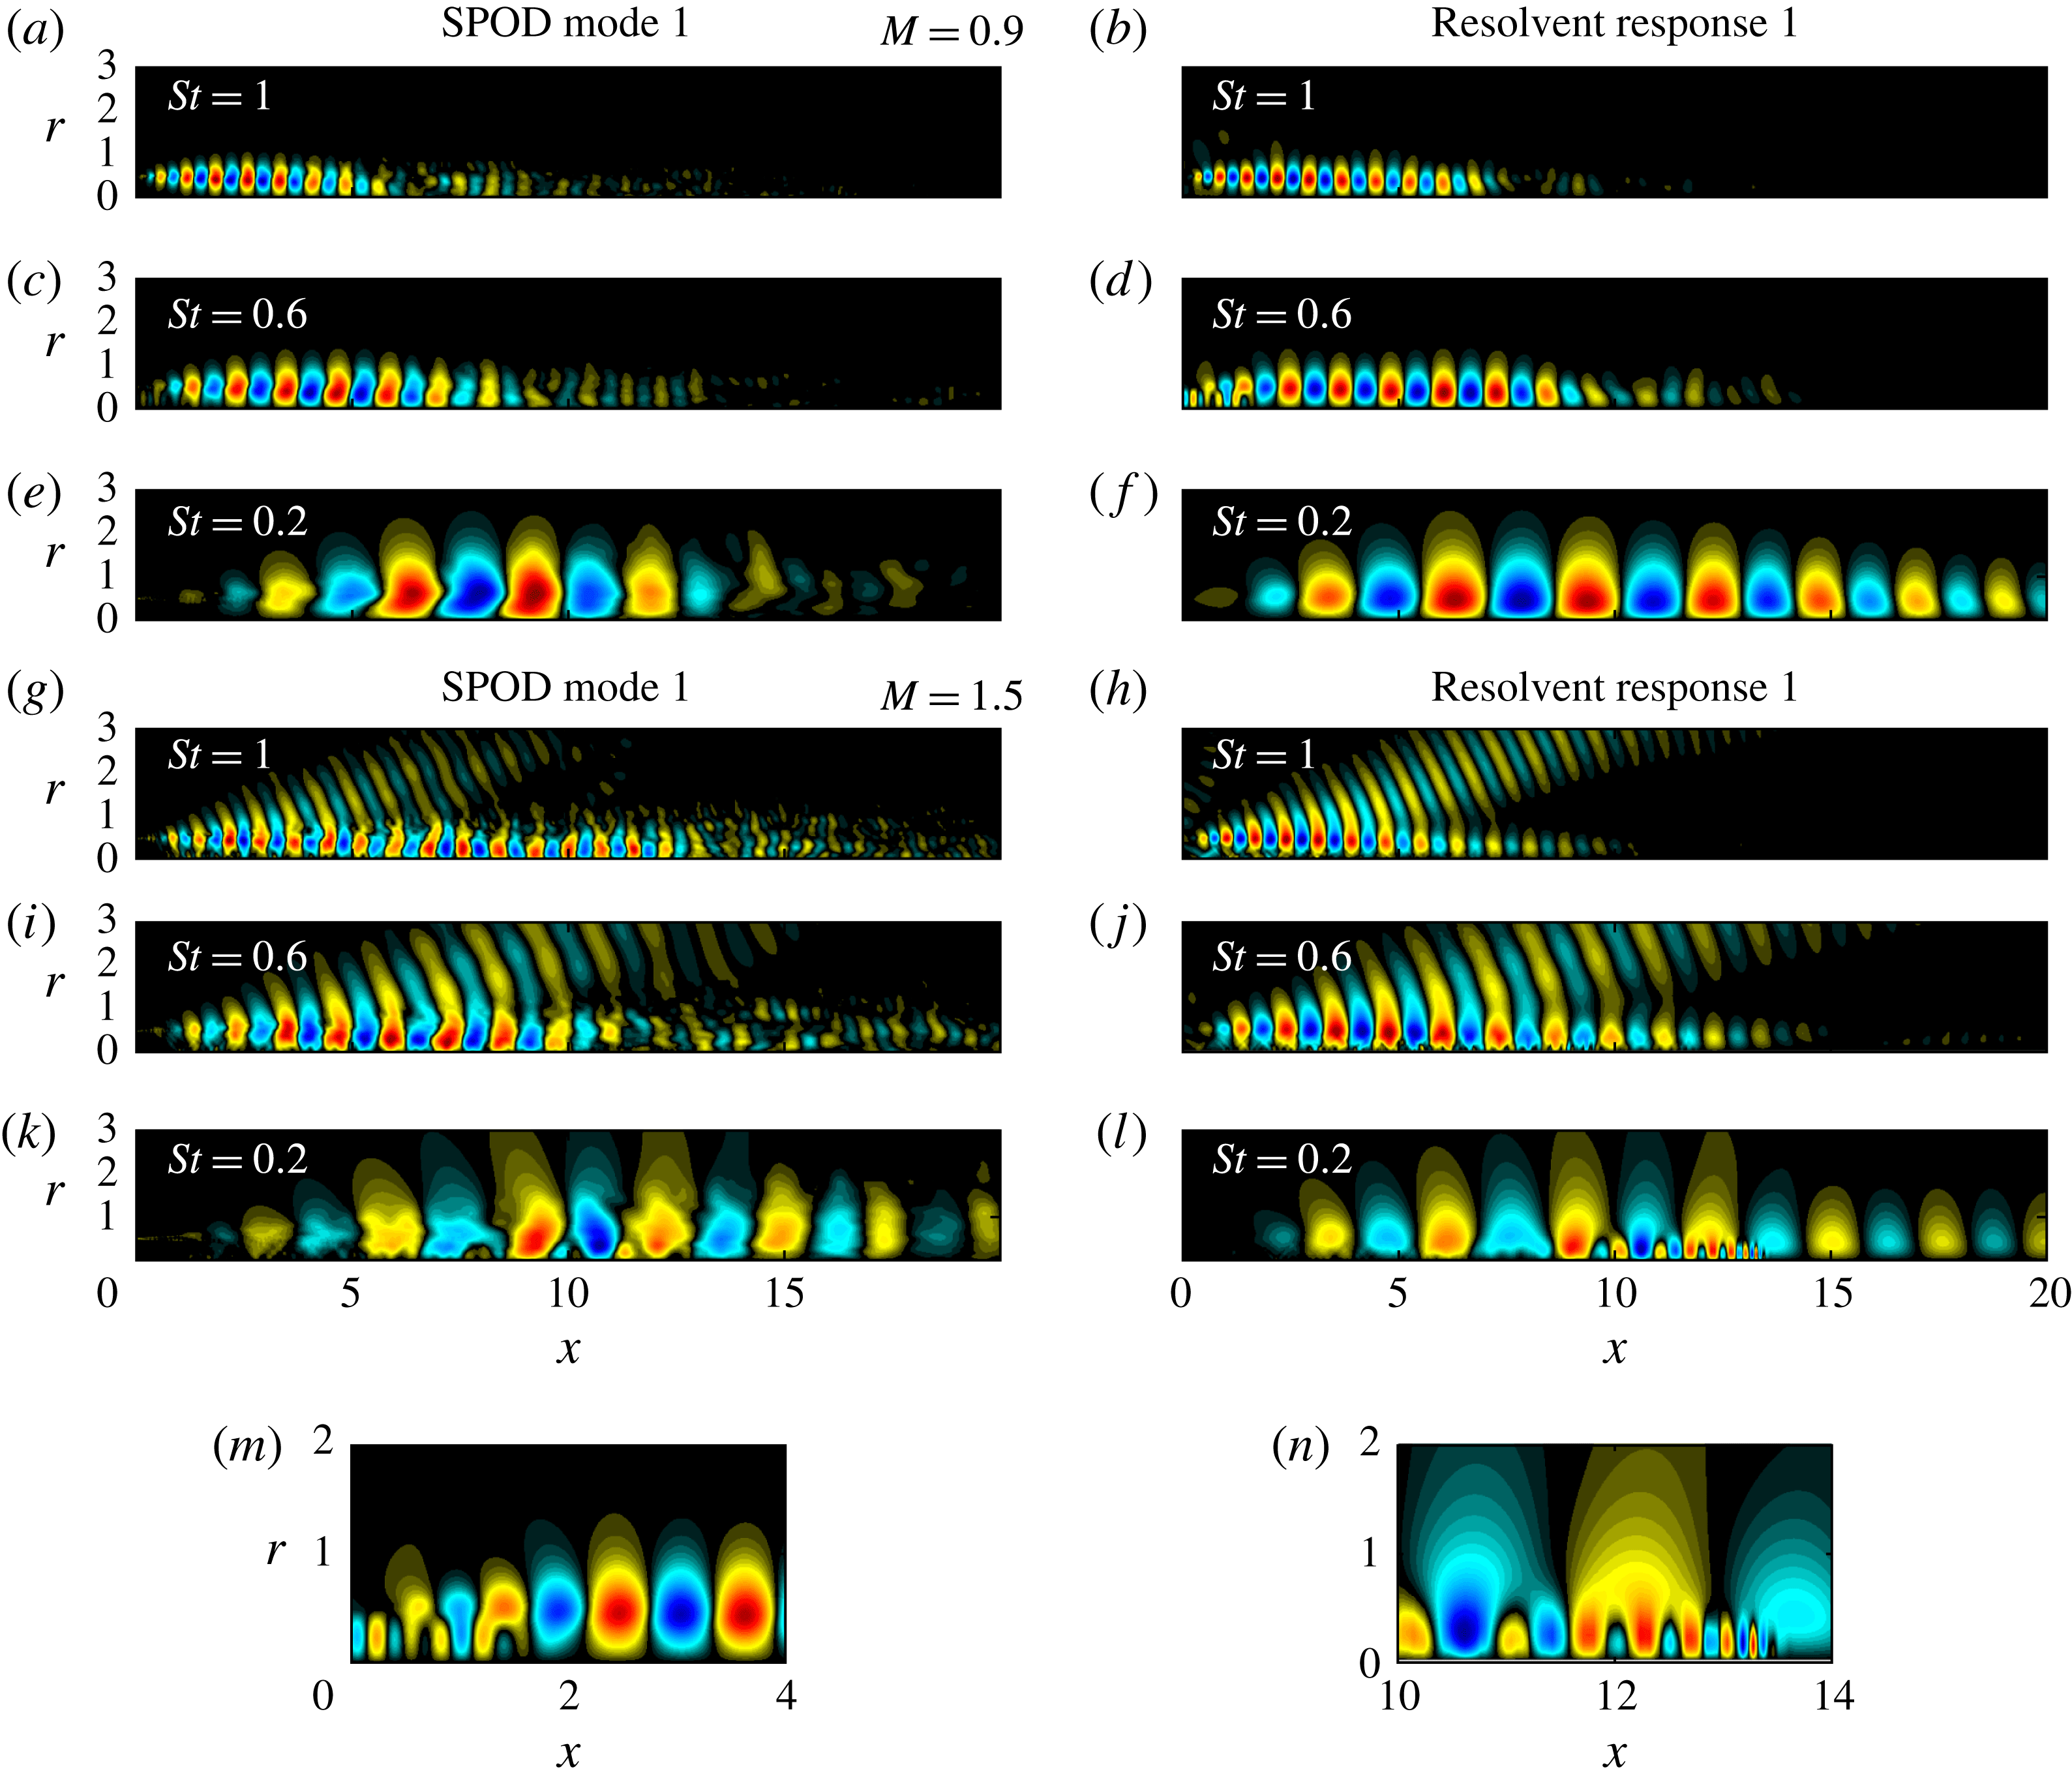
Comparison between leading empirical SPOD modes and optimal resolvent response modes at three representative frequencies for
 $m=1$
for the transonic (a–f) and the supersonic jet (g–l). Panels (m) and (n) zoom in on a trapped acoustic mode (Schmidt et al.
Reference Schmidt, Towne, Colonius, Cavalieri, Jordan and Brès2017; Towne et al.
Reference Towne, Cavalieri, Jordan, Colonius, Schmidt, Jaunet and Brès2017b
) in the transonic jet, and an upstream-propagating subsonic mode (Tam & Hu Reference Tam and Hu1989) in the supersonic jet, respectively. The normalized pressure is shown.

Figure 16 shows a side-by-side comparison of SPOD and resolvent modes for the transonic and the supersonic jet. The leading modes are shown for three frequencies. Similar to the subsonic case in figure 12, favourable agreement between the empirical modes and the model is found. Significant discrepancies in terms of the length of the wavepackets and their radial structure is only observed for the transonic jet at the lowest frequency, as shown in figure 16(e,f). In figure 16(g–j), it can be seen that the resolvent model accurately predicts the super-directive Mach wave radiation of the supersonic jet. Sinha et al. (Reference Sinha, Rodríguez, Brès and Colonius2014) found similarly good agreement with their PSE model.
Besides the KH- and Orr-type wavepackets, which are vortical, jets also support different types of frequency-dependent acoustic waves. The transonic jet, for example, supports trapped acoustic waves within the potential core (Towne et al.
Reference Towne, Cavalieri, Jordan, Colonius, Schmidt, Jaunet and Brès2017b
; Schmidt et al.
Reference Schmidt, Towne, Colonius, Cavalieri, Jordan and Brès2017). Such a trapped acoustic wave can be seen close to the nozzle in the detail shown in figure 16(m). In the supersonic jet, a closely related mechanism (Tam & Hu Reference Tam and Hu1989; Towne et al.
Reference Towne, Cavalieri, Jordan, Colonius, Schmidt, Jaunet and Brès2017b
) is visible further downstream in figure 16(n). The reader is referred to Towne et al. (Reference Towne, Cavalieri, Jordan, Colonius, Schmidt, Jaunet and Brès2017b
) for details. In the present context, it suffices to recapitulate that the trapped waves are the result of an acoustic resonance in the transonic jet regime
 $0.82<M_{j}<1$
. More important than their physical nature for the present study is the observation that the resolvent analysis emphasized this type of intrinsic mechanism. This becomes clear from a closer inspection of figures 16(c,d) and 16(k,l), respectively. The acoustic wave phenomena are evident in the SPOD modes, but are more pronounced in the resolvent modes. Two factors contribute to this fact. First, the frequency and Reynolds number scaling of the various physical effects is different, which leads to the same modelling challenges as for the KH- and Orr-type modes discussed in the context of figure 9 (see also the Appendix, figure 21). Second, efficient means of forcing, such as resonances, are optimally exploited by the resolvent model, whereas they might not be forced as efficiently in the real flow. A method to single out the trapped acoustic wave components in the transonic jet is presented in Schmidt et al. (Reference Schmidt, Towne, Colonius, Cavalieri, Jordan and Brès2017).
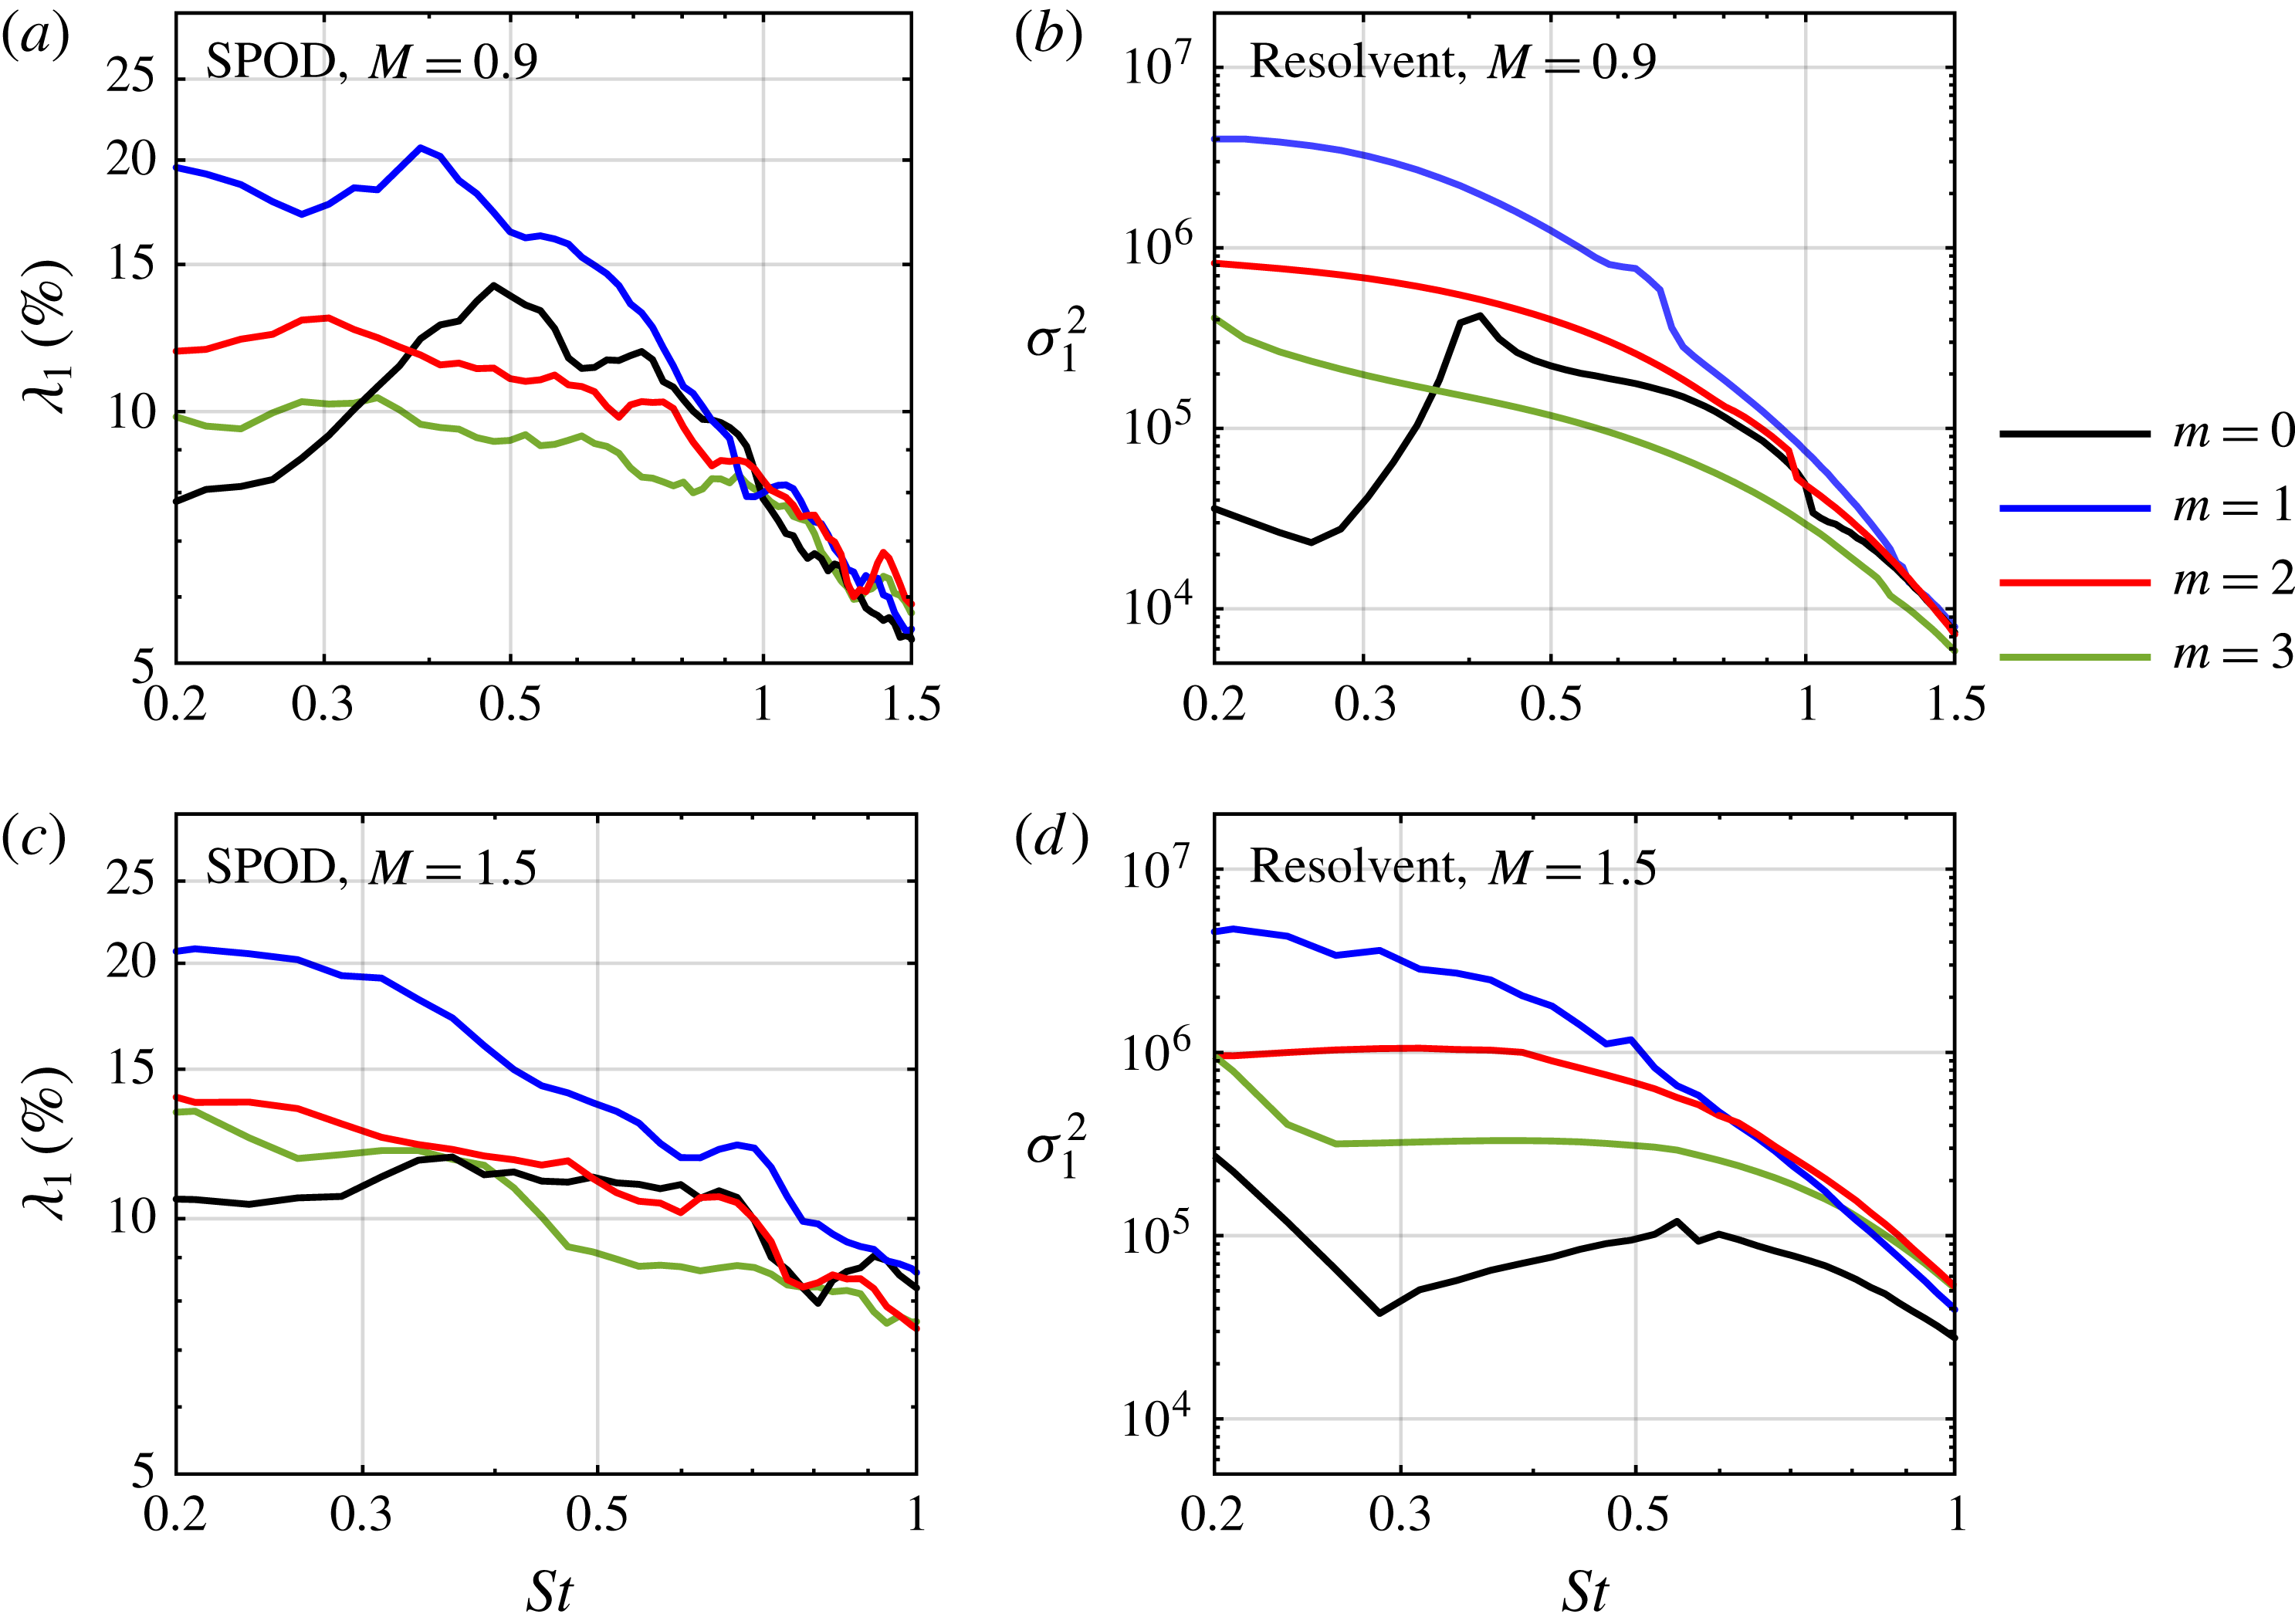
SPOD energy spectra (a,c) and optimal resolvent gains (b,d) as in figure 10, but for the transonic (a,b) and the supersonic (c,d) jet.

Figure 17 shows the leading SPOD mode energy and the optimal resolvent gain for the transonic (a,b) and supersonic (c,d) cases. As in figure 10, spectra for the first four azimuthal wavenumbers are reported. As in the subsonic case, favourable agreement of the qualitative trends is found between the SPOD analysis and the resolvent model. The presence of the acoustic resonance mechanism associated with the trapped modes is apparent in the gains. The peaks seen in figure 10(b), for example at
 $(St,m)\approx (0.4,0)$
and
 $(St,m)\approx (0.7,1)$
, coincide with the frequencies of branches of trapped acoustic modes. The associated eigenvalues are only marginally damped in the global spectra of the same operator (Schmidt et al.
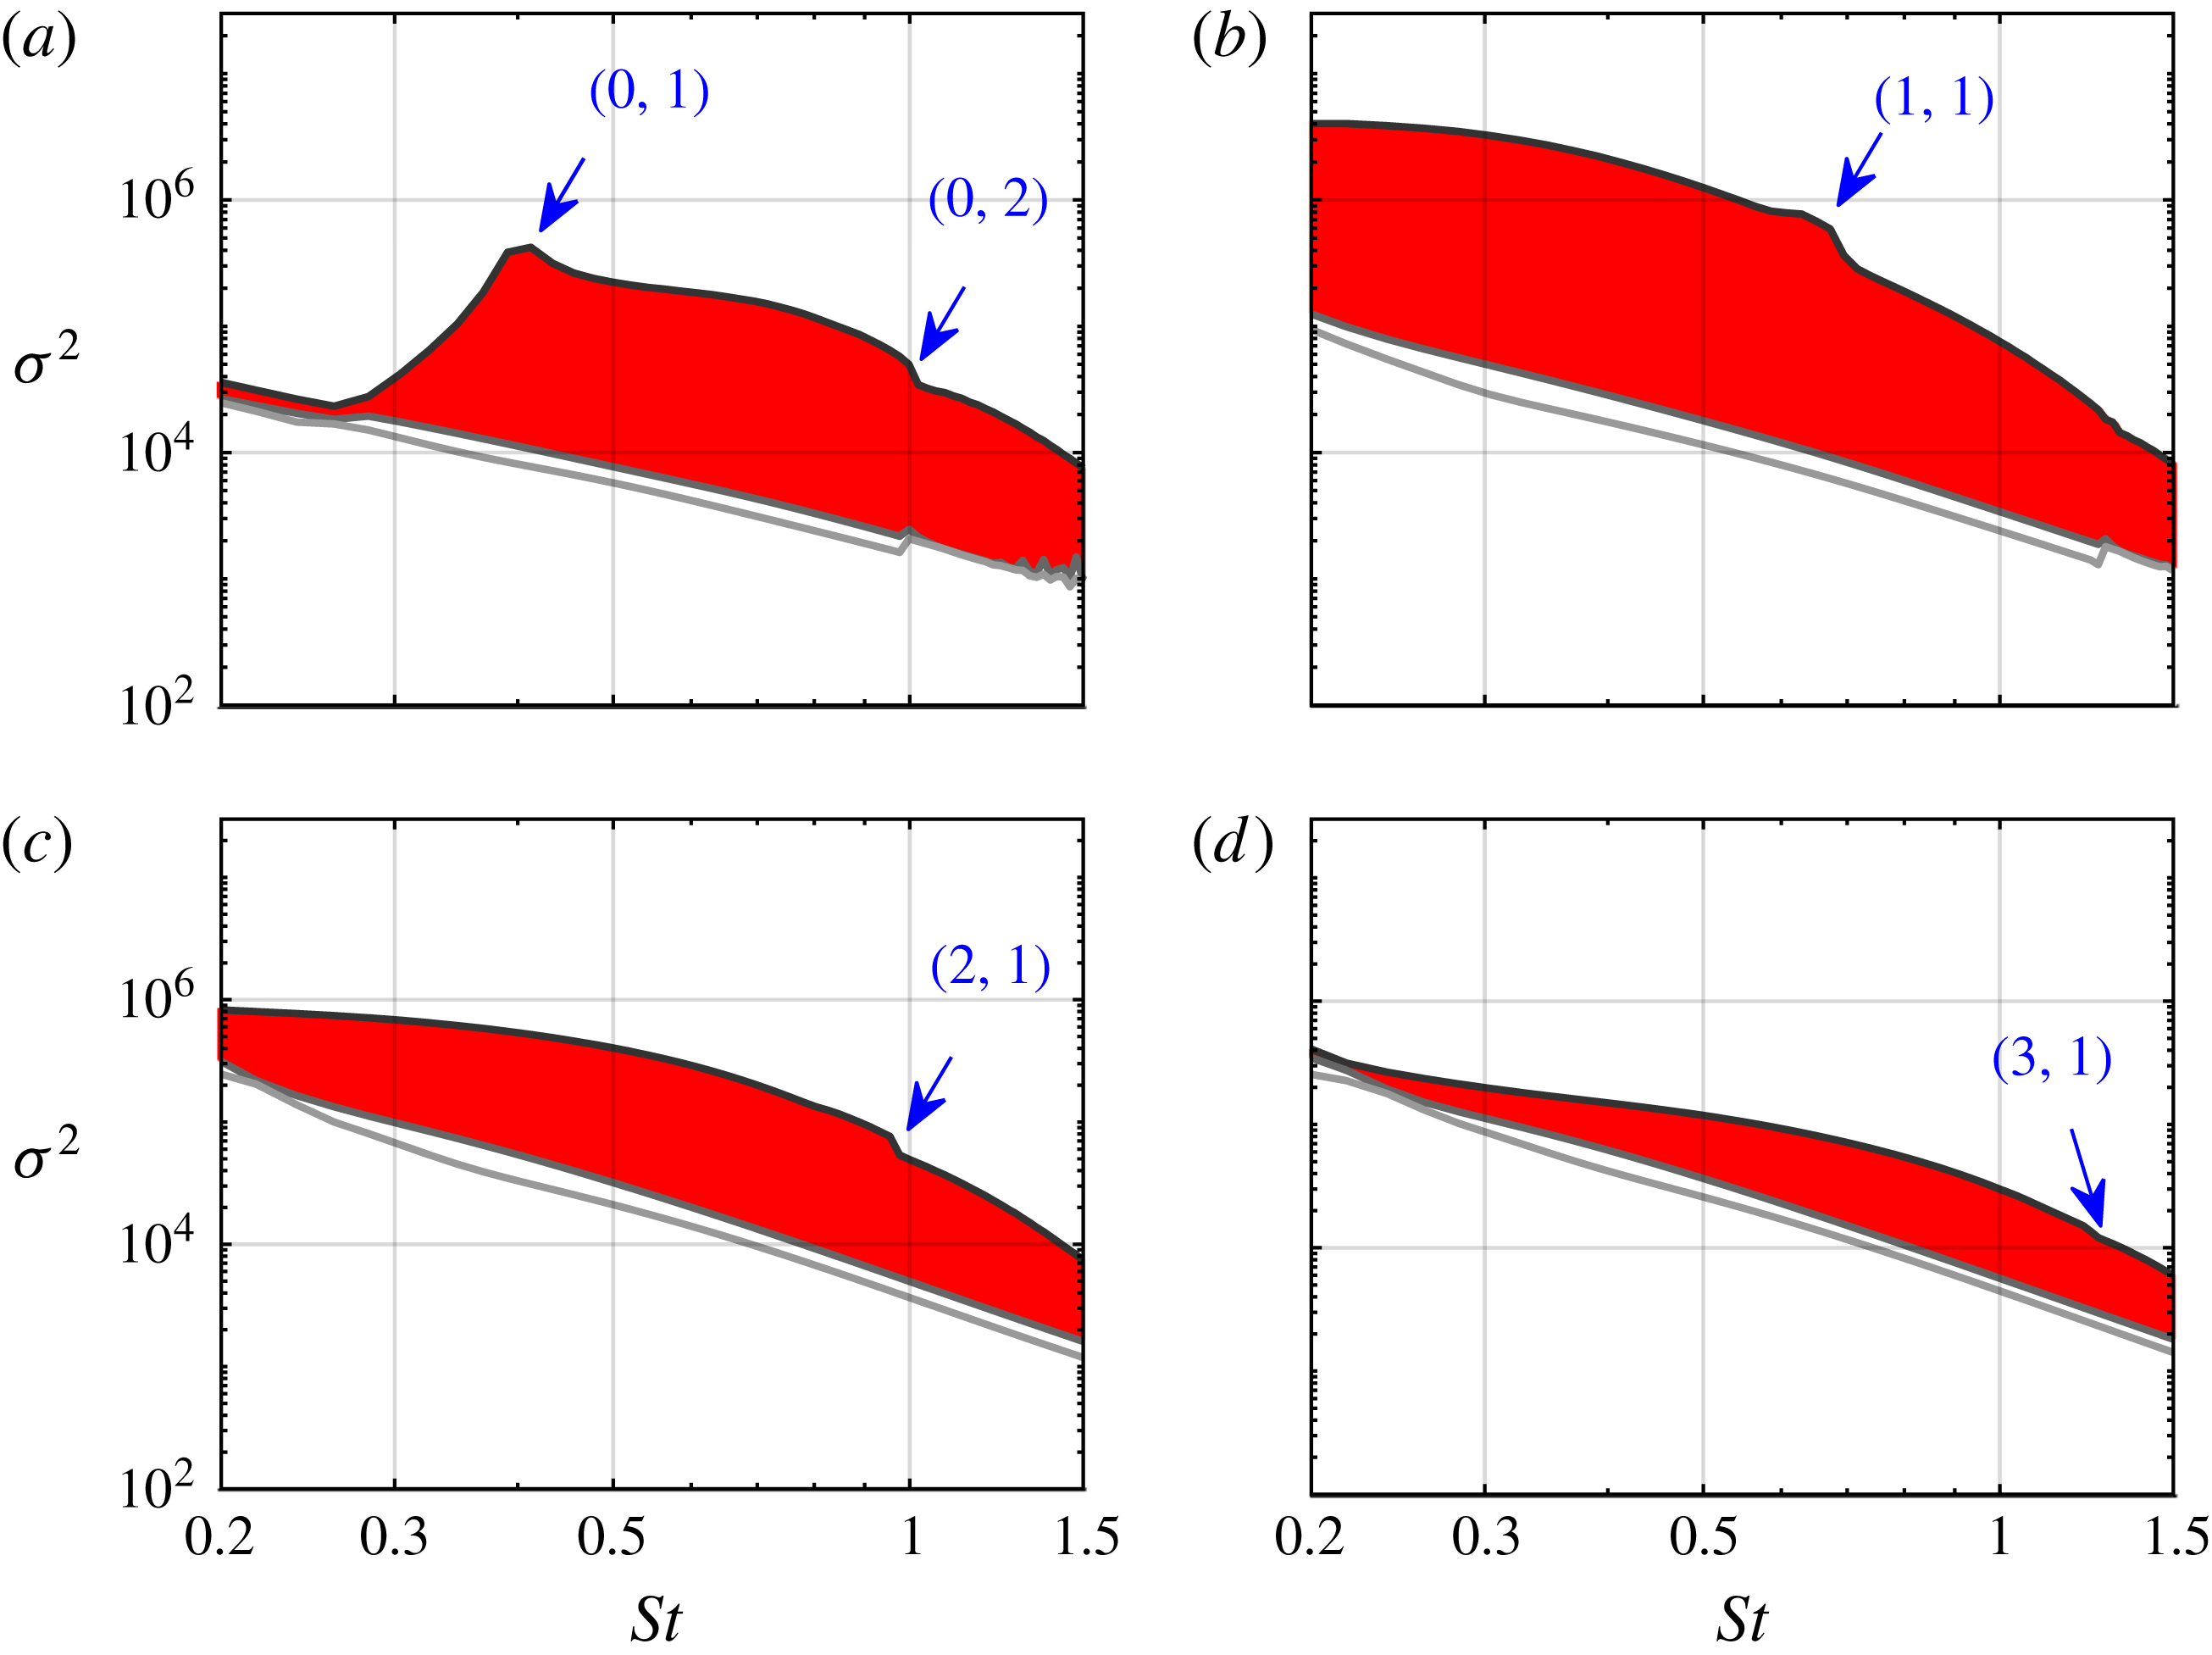
Reference Schmidt, Towne, Colonius, Cavalieri, Jordan and Brès2017). This proximity of the eigenvalues to the real axis explains the peaks in the gain curves as a pseudo-resonance. The acoustic branch locations are marked in the resolvent gain spectra shown in figure 19 (Appendix).
SPOD eigenvalue spectra (

 $\unicode[STIX]{x1D706}_{1}>\unicode[STIX]{x1D706}_{2}>\cdots >\unicode[STIX]{x1D706}_{N}$
) as in figure 3, but for the
 $M=0.9$
transonic jet: (a)
 $m=0$
; (b)
 $m=1$
; (c)
 $m=2$
; (d)
 $m=3$
.

Optimal energetic gain spectra (——,
 $\unicode[STIX]{x1D70E}_{1{-}3}$
) as in figure 8 but for the transonic
 $M=0.9$
jet: (a)
 $m=0$
; (b)
 $m=1$
; (c)
 $m=2$
; (d)
 $m=3$
. The locations of the branches of trapped acoustic modes are indicated by the doublets
 $(m,n_{r})$
, where
 $n_{r}$
is their radial order and
 $m$
the azimuthal wavenumber, as before. See Towne et al. (Reference Towne, Cavalieri, Jordan, Colonius, Schmidt, Jaunet and Brès2017b
) and Schmidt et al. (Reference Schmidt, Towne, Colonius, Cavalieri, Jordan and Brès2017) for details.

SPOD eigenvalue spectra (

 $\unicode[STIX]{x1D706}_{1}>\unicode[STIX]{x1D706}_{2}>\cdots >\unicode[STIX]{x1D706}_{N}$
) as in figure 3, but for the
 $M=1.5$
supersonic jet: (a)
 $m=0$
; (b)
 $m=1$
; (c)
 $m=2$
; (d)
 $m=3$
.

Optimal energetic gain spectra (——,
 $\unicode[STIX]{x1D70E}_{1{-}3}$
) as in figure 8 but for the supersonic
 $M=1.5$
jet: (a)
 $m=0$
; (b)
 $m=1$
; (c)
 $m=2$
; (d)
 $m=3$
. The pressure of the leading and first suboptimal modes at
 $(m,St)=(0,0.2)$
are shown in (e) and (f), respectively.

Azimuthal wavenumber dependence of the relative modal energy of the SPOD (a,c), and the optimal resolvent gains (b,d) as in figure 15, but for the transonic (a,b), and supersonic jet (c,d).

7 Summary and conclusions
Large-scale structures taking the form of spatially modulated wavepackets have long been observed in turbulent jets, and past attempts to model them using linear theory have met with partial success (Jordan & Colonius Reference Jordan and Colonius2013). In this paper, we use SPOD to distil these wavepackets from a high-fidelity numerical simulation and demonstrate that a resolvent mean-flow model predicts them well. Both approaches paint a consistent picture of two coexisting mechanisms. The KH-type instability is active, over a range of frequencies and azimuthal wavenumbers, in the initial shear layer whereas the region downstream of the potential core is dominated by Orr-type waves. Moreover, in the initial shear-layer region, Orr-type waves are also present but not readily observed as they are swamped by the high-gain KH waves. We quantified both types of structures over a range of frequencies and azimuthal wavenumbers. In addition to their differing spatial regions of dominance, they are distinguished by their spatial support, phase speed and frequency scaling. KH-type wavepackets can be regarded as local spatial instabilities. They convect with a phase velocity of
 $c_{ph}\approx 0.8U_{j}$
and are triggered by fluctuations close to the nozzle. This spatial separation between optimal forcing and response characterizes a convective non-normality (Marquet et al.
Reference Marquet, Lombardi, Chomaz, Sipp and Jacquin2009) in the presence of a spatial instability mechanism (Alizard, Cherubini & Robinet Reference Alizard, Cherubini and Robinet2009; Dergham et al.
Reference Dergham, Sipp and Robinet2013; Beneddine et al.
Reference Beneddine, Sipp, Arnault, Dandois and Lesshafft2016). By contrast, Orr-type waves convect at a lower speed in accordance with the jet’s velocity-decay rate, and are most effectively sustained by distributed forcing. Both the KH and Orr waves peak at the height of the critical layer in the radial direction and are optimally forced by the Orr mechanism.
In the LES data analysis, frequencies at which the KH mechanism dominates are identified by a separation between the first and second eigenvalues in the SPOD spectrum, and the resolvent gain reliably predicts this low-rank behaviour. Although this low-rank behaviour can in principle be inferred from the success of past studies based on spatial linear stability theory (e.g. Michalke Reference Michalke1971), it is most compellingly revealed in the SPOD and resolvent spectra. Equally important to its presence is its absence. For
 $m=0$
at very low frequencies, for example, the KH mechanism is absent as the initial shear layer becomes short as compared to the perturbation wavelength. Here, the jet exhibits non-low-rank behaviour and both the SPOD and the resolvent model predict the coexistence of Orr-type waves of similar energy. For
 $m=1$
, on the contrary, the KH mechanism persists to very low frequencies.
The non-low-rank behaviour explains why wavepacket models based on PSE such as the ones by Gudmundsson & Colonius (Reference Gudmundsson and Colonius2011), Cavalieri et al. (Reference Cavalieri, Rodríguez, Jordan, Colonius and Gervais2013) and Sinha et al. (Reference Sinha, Rodríguez, Brès and Colonius2014) fail at these very low frequencies for
 $m=0$
. For example, the PSE method is initialized with the locally most unstable spatial wave, which is then propagated downstream by space marching. In the non-low-rank regime, this mode does not optimally trigger transient growth and appears as a subdominant resolvent mode. Furthermore, as volumetric forcing by the turbulence is not accounted for, PSE cannot support the dominant Orr-type waves. With the goal in mind of further improving its predictive capabilities, in particular at low frequencies, we plan to model the second-order statistics of the forcing and incorporate them into a resolvent-based jet noise model in future work.
Acknowledgements
O.T.S., T.C. and G.R. gratefully acknowledge support from the US Office of Naval Research under contract N00014-16-1-2445. The LES studies were supported by NAVAIR SBIR project under the supervision of J. T. Spyropoulos, with computational resources provided by DoD HPCMP at the ERDC DSRC supercomputer facility.
Appendix. Spectral analysis and resolvent model for the transonic and supersonic jets
This appendix reports the additional results for the SPOD and resolvent analyses of the
 $M=0.9$
and
 $M=1.5$
jets, that were omitted in § 6 for brevity. The resolvent gain spectra for the transonic and supersonic jets are reported in figures 19 and 21, and the SPOD energy spectra in figures 18 and 20, respectively. The azimuthal wavenumber dependence of the optimal gain and SPOD energy is studied in figure 22 for both jet configurations. In figure 19, the locations of the branches of trapped acoustic modes (Schmidt et al.
Reference Schmidt, Towne, Colonius, Cavalieri, Jordan and Brès2017) are indicated, and their effect on the resolvent gain becomes apparent.
For the supersonic jet shown in figure 21, a sudden change of slope is observed in the suboptimal gain curves. An inspection of the modal structures confirms that this change is associated with the presence of upstream-propagating subsonic waves (Tam & Hu Reference Tam and Hu1989), as previously discussed in the context of figure 16. In figure 21(e,f), the dominant and the first suboptimal mode for
 $(m,St)=(0,0.2)$
are compared. At this frequency, the leading mode is of KH type, whereas the second mode is of mixed Orr/acoustic type. In the second mode in figure 21(f), the acoustic wave component appears isolated in the stretch
 $6\lesssim x\lesssim 12$
along the axis. The trapped acoustic waves in the transonic jet and the upstream-propagating subsonic waves in the supersonic jet have a direct effect on the resolvent gain, as can be seen in figures 19 and 21, respectively. It is a remarkable property of the resolvent analysis that it is able to isolate these physical phenomena. Both types of waves are also apparent in the SPOD modes. However, they appear much less pronounces in the latter. This discrepancy is also reflected in the SPOD energy spectra in figures 18(a) and 20(b), respectively. In the SPOD spectra, the effect of these special waves is not apparent. This observation further highlights the importance of the second-order forcing statistics. Other factors are the Reynolds number dependence and the choice of norm.