Introduction
Major depressive disorder (MDD) is a highly heterogenous disorder from a clinical standpoint (Goldberg, Reference Goldberg2011; Fried & Nesse, Reference Fried and Nesse2015; Lux et al., Reference Lux, Kendler, Payerle, Team, Payerle, Dolnicar, Chapple, Pastuszak and Wang2015), and there is mounting evidence that there are different biological pathways contributing to the disease (Majd et al., Reference Majd, Saunders and Engeland2020). MDD can influence all parts of our body, as it changes our circadian rhythm, autonomic nervous system reactivity, immunological response, and the Hypothalamic–pituitary–adrenal (HPA) axis’s reactivity (Maes et al., Reference Maes, Kubera, Mihaylova, Geffard, Galecki, Leunis and Berk2013; De Hert et al., Reference De Hert, Detraux and Vancampfort2018). There is a known interrelation between MDD and various somatic diseases (Breznoscakova et al., Reference Breznoscakova, Palova, Dragasek and Moscovic2007; Baune et al., Reference Baune, Stuart, Gilmour, Wersching, Arolt and Berger2012; De Hert et al., Reference De Hert, Detraux and Vancampfort2018; Chan et al., Reference Chan, Cathomas and Russo2019; Khassawneh et al., Reference Khassawneh, Alzoubi, Khasawneh, Abdo, Abu-Naser, Al-Mistarehi, Albattah and Kheirallah2020) and recent large scale epidemiological studies further emphasise this notion (Alshehri et al., Reference Alshehri, Mook-Kanamori, van Dijk, Dinga, Penninx, Rosendaal, le Cessie and Milaneschi2021). It has been shown that MDD is associated with a metabolic signature also found in Cardiovascular disease (CVD) patients (Bot et al., Reference Bot, Milaneschi, Al-Shehri, Amin, Garmaeva, Onderwater, Pool, Thesing, Vijfhuizen and Vogelzangs2020) and that the risk factors for CVD likely play a part in the development of MDD (Khandaker et al., Reference Khandaker, Zuber, Rees, Carvalho, Mason, Foley, Gkatzionis, Jones and Burgess2020). Elevated inflammation has been documented in clinical and subclinical depression (Dowlati et al., Reference Dowlati, Herrmann, Swardfager, Liu, Sham, Reim and Lanctôt2010), and inflammatory biomarkers, such as C-Reactive Protein (CRP), interleukin 6 (IL-6), tumor necrosis factor α (TNF-α), have verified associations with the depressive disorder (Majd et al., Reference Majd, Saunders and Engeland2020; Milton et al., Reference Milton, Ward, Ward, Lyall, Strawbridge, Smith and Cullen2021; Pitharouli et al., Reference Pitharouli, Hagenaars, Glanville, Coleman, Hotopf, Lewis and Pariante2021). Control over the HPA axis is also disrupted in MDD (Lamers et al., Reference Lamers, Vogelzangs, Merikangas, de Jonge, Beekman and Penninx2013) and showing strong correlations with MDD severity (Maes et al., Reference Maes, Kubera, Mihaylova, Geffard, Galecki, Leunis and Berk2013), while a growing body of evidence indicates a strong relationship between perturbations of the HPA axis and metabolic syndrome (MetS) (Juruena et al., Reference Juruena, Cleare, Papadopoulos, Poon, Lightman and Pariante2006; Lamers et al., Reference Lamers, Vogelzangs, Merikangas, de Jonge, Beekman and Penninx2013).
MetS is also a complex multisystemic disorder consisting of abdominal obesity, disrupted lipid metabolism, hypertension, and disrupted glucose metabolism (Balkau et al., Reference Balkau, Valensi, Eschwège and Slama2007). MetS, also seen as an inflammatory condition (Chan et al., Reference Chan, Cathomas and Russo2019), is connected to proinflammatory and prothrombogenic effects due to the secretory activity of adipose tissue, mostly visceral, and is characterised by increased levels of inflammatory mediators and endothelial dysfunction, among others (Moller & Kaufman, Reference Moller and Kaufman2005; Eckel et al., Reference Eckel, Alberti, Grundy and Zimmet2010). Free fatty acids, leptin, adiponectin, and restin are some of the known culprits in pathological conditions that arise from MetS. Still, visceral adipose tissue is one of the primary sources of inflammatory mediators, such as TNF-α and IL-6 (Chan et al., Reference Chan, Cathomas and Russo2019), both of which have their role in the pathogenesis of MetS (Kubaszek et al., Reference Kubaszek, Pihlajamäki, Komarovski, Lindi, Lindström, Eriksson, Valle, Hämäläinen, Ilanne-Parikka, Keinänen-Kiukaanniemi, Tuomilehto, Uusitupa and Laakso2003) but also MDD (Majd et al., Reference Majd, Saunders and Engeland2020). There is mounting evidence showing high overlapping between MDD and MetS patients, ranging between 25% and 50%, depending on population and MetS criteria (Heiskanen et al., Reference Heiskanen, Niskanen, Hintikka, Koivumaa-Honkanen, Honkalampi, Haatainen and Viinamäki2006; Koponen et al., Reference Koponen, Jokelainen, Keinänen-Kiukaanniemi, Kumpusalo and Vanhala2008; Pan et al., Reference Pan, Keum, Okereke, Sun, Kivimaki, Rubin and Hu2012). The association is somewhat more robust in studies that have used self-rating scales to diagnose MDD rather than structured clinical diagnostic interviews or clinical assessment, as the self-rating scales also identify subsyndromal clinical images, i.e. the presence of depressive symptoms that do not meet the criteria. Although MDD is complex and is influenced by biological, social, and psychological factors (Malhi & Mann, Reference Malhi and Mann2018), there is no clinically useful and generalisable biological subtypisation of MDD [28] and the diagnosis is confirmed solely through diagnostic criteria and clinical observation.
Methods
Study design and participants
This cross-sectional study was conducted at the University Clinical Hospital Center ‘Sestre Milosrdnice,’ Department of Psychiatry (Zagreb, Croatia) in hospital settings. Participants of both sexes, aged 18–50 years, had MDD episodes or were healthy, as confirmed with the structured clinical interview for the ICD-10 and MINI questionnaire (Mini International Neuropsychiatric Interview) (Lecrubier et al., Reference Lecrubier, Sheehan, Weiller, Amorim, Bonora, Sheehan, Janavs and Dunbar1997). Participants were recruited from the University Clinical Hospital Center Sestre Milosrdnice and the Croatian Center for transfusion medicine. All participants with MDD were hospitalised. Eligible participants were non-smokers with no history of concurrent alcohol or substance dependence. They were medication-free for at least 3 months before the study, including herbal medicine as St. John’s wort. Participants with major depressive episodes were given the 17-item Hamilton Depression Rating Scale (HAM-D), and for enrolment, a minimum score of 18 was required (moderate to severe clinical presentation of MDD according to HAM-D). The diagnosis of the MetS was confirmed using NCEP ATP III criteria. Participants were excluded if they had hormonal changes (i.e. menopause, pregnancy) and predefined psychiatric comorbidities (major depressive episodes with psychotic symptoms, bipolar disorder (types I or II), and borderline or antisocial personality disorder). Participants were excluded as well if they had predefined somatic comorbidities which could raise proinflammatory cytokine levels (i.e. rheumatoid or psoriatic arthritis, Crohn’s disease). All participants provided written informed consent after all procedures were fully explained. The research ethics board at the University Clinical Hospital Center ‘Sestre Milosrdnice’ approved the study, protocol, and informed consent forms. Data that are obtained were collected solely for the purposes of this study and as such have not been analysed in other ways.
Procedures
Each participant in the study had his blood taken in the morning hours in the hospital setting. The blood samples were used to analyse several metabolic, hormonal, and inflammatory parameters and determine serotonin concentration in platelets. White blood cell count, red blood cell count, haemoglobin concentration, platelet count, reticulocyte count, nucleated RBC, mean corpuscular volume, mean platelet volume, and mean reticulocyte volume were analysed using the automatic hematologic analyzer Beckman Coulter LH 750 (Beckman Coulter, Miami, SAD) according to the manufacturer instructions. With the above-given parameters, haematocrit, mean cell haemoglobin, mean corpuscular haemoglobin concentration, red cell distribution width, procalcitonin, platelet distribution width, and immature reticulocyte fraction were calculated. Serotonin concentration in platelets was determined using the DRG ELISA FAST, version 2 (DRG Instruments Gmbh, Germany) test. We obtained the serum cortisol levels by an immunochemical method following the manufacturer’s instructions (Roche Diagnostics GmbH, Germany). High-density lipoprotein (HDL) cholesterol and Low-density lipoprotein (LDL) cholesterol levels were obtained using the homogenous immunoseparation method in the automatic analyzer AU 2700 (Beckman Coulter, SAD), with the reagents coming from the same manufacturer. Glucose concentration was obtained using enzymatic spectrometric methods with hexokinase in the automatic analyzer AU 2700 (Beckman Coulter, SAD) with the manufacturer’s reagents. All of the parameters mentioned above were determined three times, and a mean value was used. All of the analysis was conducted at the Clinical Department for chemistry, Clinical Hospital Center ‘Sestre Milosrdnice’, which is certified for these procedures in accordance to ISO standard 15189:2006 and is monitored for quality by LABQUALITY (External Quality Assessment Services), DGKL - Reference Institute for Bioanalytics of the German Society of Clinical Chemistry and Laboratory Medicine. Height, weight, and body circumference of the patients were determined as a mean from three measurements, while the body mass index was calculated from the weight of the patient divided by the square of the height.
Statistical analysis
All the obtained results were processed using descriptive and non-parametric or parametric statistical methods depending on the data distribution. Categorical variables were presented as percentages and frequencies, while the continuous variables were presented as mean (SD). Sociodemographic characteristics were assessed using the chi-square test, and Fisher’s exact test where necessary, and the analysis of variance (ANOVA). The chi-square test and t-test tested differences in the clinical characteristics of the sample. An ANOVA was used to test the difference in the studied variables between the groups: MDD with MetS, MDD without MetS, and the control group of subjects. Following a one-way ANOVA, we used Bonferroni’s post hoc test to determine intergroup differences. A multiple regression analysis was performed to examine the association of individual components of the MetS with the variables studied. The individual analysis was performed for the group of patients with MDD and a second analysis for the control group. To examine the association between MetS and the investigated clinical, laboratory, and anthropometric parameters, logistic regression analysis was performed.
We performed a cluster analysis to do the subtyping of the depressive disorder based on laboratory, anthropometric, and clinical characteristics, as shown in Table 3. In the first step, we created a hierarchical cluster analysis method to define the number of clusters, and in the second step, we did a k-means procedure to form clusters. Using Elbow’s rule and Ward’s method, we determined the potential number of clusters in the hierarchical cluster analysis. This procedure justified the separation of three potential clusters of patients with depressive disorder and three subtypes of MDD, distinguished from each other by predefined variables. In the next step, we made a k-means cluster analysis method to set the value of k in advance to 3 (the number of potential clusters offered by the previously made hierarchical cluster analysis). Clusters obtained by cluster analysis: Three separate subtypes of MDD were used as criterion variables in the discriminant analysis. A probability level of p < 0.05 was considered statistically significant. SPSS statistical software, version 15, was used for all statistical analyses (SSPS Inc., Chicago, IL).
Results
For this study, 460 potential participants were approached. We excluded 32 participants because they were smokers, 25 because of alcohol and/or other substance abuse, 47 because they were already taking antidepressant therapy, 11 because the HAM-D score was below 18, and 52 because of predefined psychiatric and or somatic comorbidities. Healthy controls were recruited from the Croatian Center for transfusion medicine. They were matched for age and sex. They had no current or past psychiatric or somatic disorder and had no family history of MDD. After careful evaluation, the final sample consisted of 293 participants, 148 healthy participants, and 145 patients with MDD. Of those 145 patients, 60 (41,4%) were diagnosed with MetS, and the remaining 85 (58,6%) did not meet the diagnosis criteria.
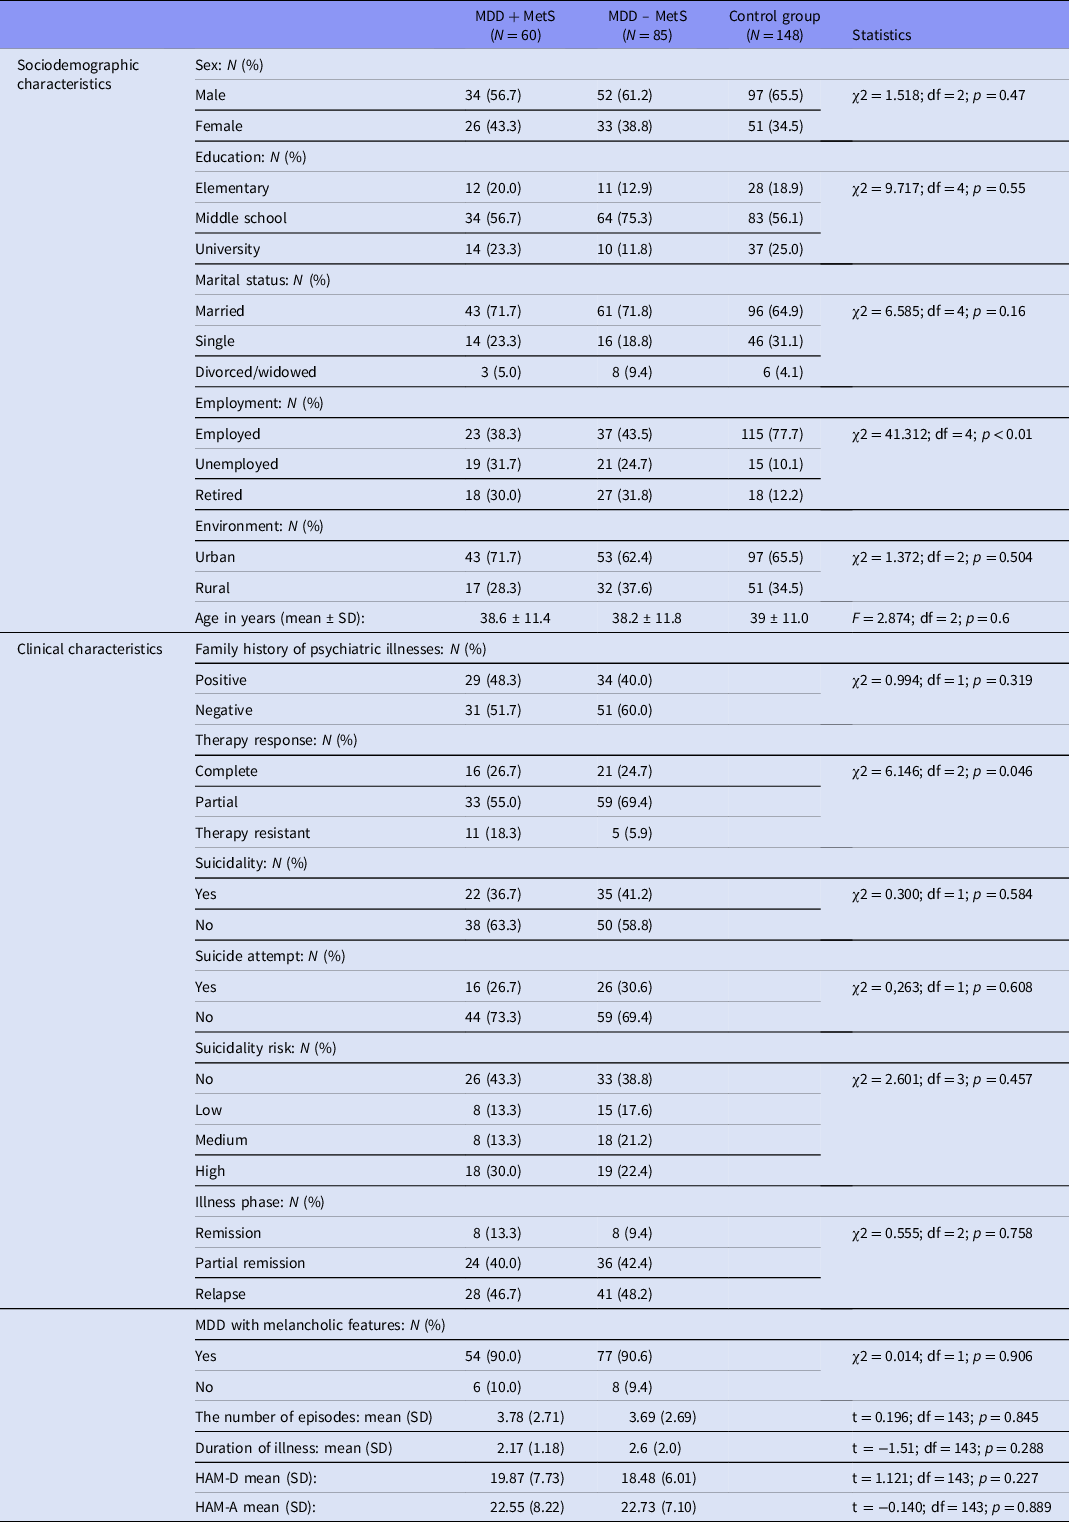
We observed no differences in age or gender distribution in all three groups – MDD with MetS, MDD without MetS, and healthy control group (Table 1). Furthermore, we did not find any statistically relevant differences in MDD patients in any clinical characteristics except that MDD patients with MetS were significantly more often resistant to pharmacotherapy than MDD patients without MetS (Table 1). Regarding the socioeconomic characteristics of these three groups, we did not find any statistically relevant differences in any of the traits (Table 1), except employment status, where healthy controls had a statistically significant higher employment rate (p < 0.001).
Sociodemographic and clinical characteristics of patients with MDD, with metabolic syndrome (MDD + MetS) and without metabolic syndrome (MDD − MetS), and healthy participants (control). Values are presented as percentages or as mean (SD), while the value p < 0.05 was considered statistically significant

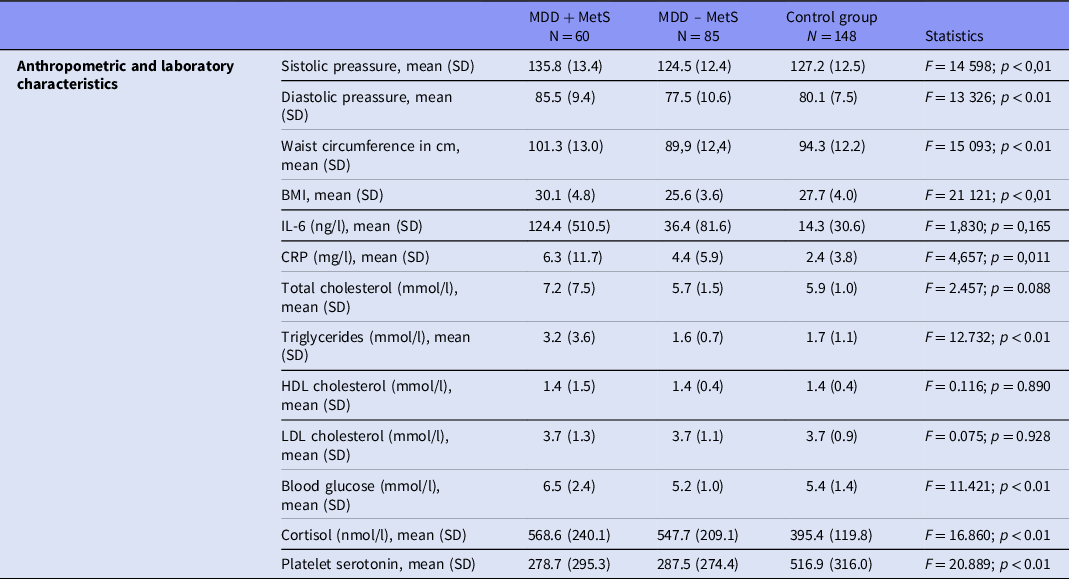
The results of anthropometric characteristics had several significant differences (Table 2). Patients with a diagnosis of MDD and MetS had statistically higher systolic pressure in comparison to healthy subjects (p < 0.01) and MDD patients without MetS (p < 0.01) (Table 2). The same statistically significant difference was observed for diastolic pressure, waist circumference measurements, BMI values, and the levels of glucose in the blood (p < 0.01) (Table 2).
Anthropometric and laboratory characteristics of patients with MDD, with metabolic syndrome (MDD + MetS) and without metabolic syndrome (MDD − MetS) and healthy participants (control). Values are presented as percentages or as mean (SD), while the value p < 0.05 was considered statistically significant

A statistically significant difference for cortisol and serotonin was found between MDD patients with MetS and the control group (p < 0.01) and between MDD patients without MetS and the control group (p < 0.01), while no difference was observed between MDD groups (Table 2). The values of CRP had a statistically significant difference between MDD patients with MetS and the control group (p < 0.01), while no statistically significant difference was found between other groups (Table 2). There was a statistically significant difference for triglyceride values of both MDD groups and controls (p < 0.01) (Table 2) while for the values of IL-6, cholesterol, HDL, and LDL cholesterol values, there was no statistically significant difference between the individual groups tested (Table 2).
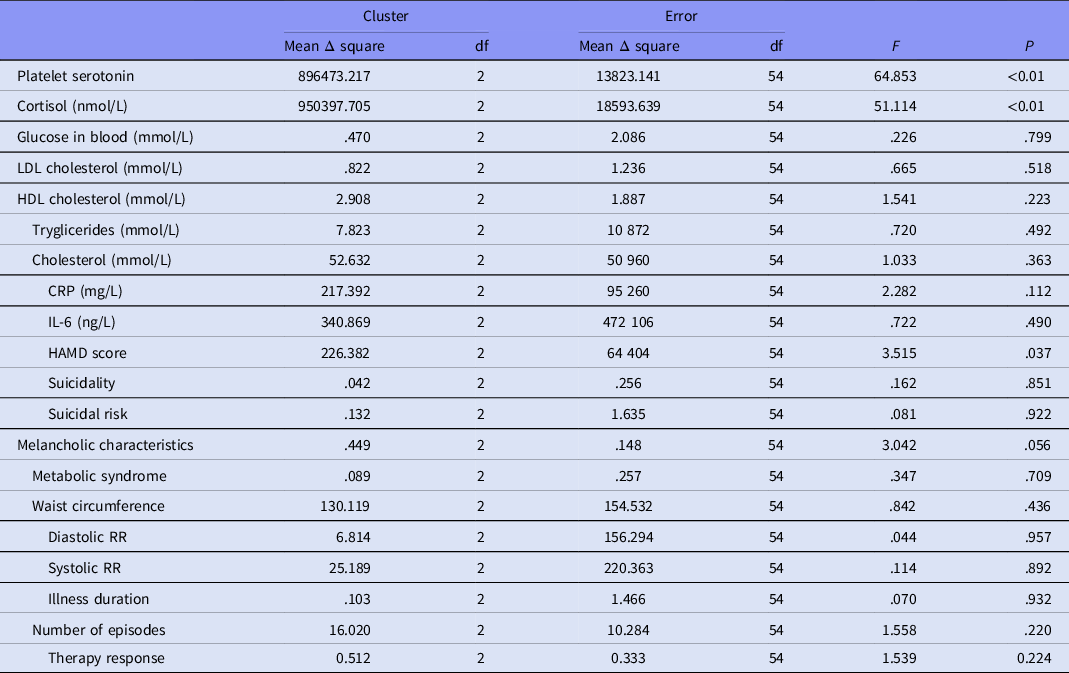
Using cluster analysis, we classified patients with MDD based on the difference in the defined set of variables (laboratory, anthropometric, and clinical characteristics of the depressive disorder) (Table 3). The first cluster of MDD was characterised by a platelet serotonin concentration within the reference values, normal cortisol concentrations, and all other examined variables except elevated IL-6. This subtype is also characterised by a partial but earlier therapeutic response to psychopharmacotherapy. Thus, we called the first cluster an inflammatory subtype of depressive disorder (Table 3). The second cluster or subtype of MDD is characterised by extremely low platelet serotonin concentration, while all of the other variables examined are in the reference values. It is important to note that this cluster, called the serotonin subtype of MDD, also has the highest number of previously experienced episodes of MDD, and according to anamnestic data, it has the best response to psychopharmaceuticals of all groups tested (Table 3). The third cluster of patients with MDD is defined by low platelet serotonin concentration, high cortisol concentration, high glucose concentration, high triglycerides, high CRP concentration, high Hamilton Depression Rating Scale (HAMD) score, high waist circumference values, more episodes of depressive disorder, and the worst therapeutic response to psychiatric drugs of all group’s testes. We called this cluster Combined (Metabolic) Depression Disorder (Table 3).
Analysis of variance for laboratory, anthropometric and clinical parameters of depressive disorder. The table shows that the three clusters (three biologically different subtypes of depressive disorder) differ in the concentrations of platelet serotonin, cortisol, and in the value on the HAMD scale. Values are presented as mean Δ square, while the value p < 0.05 was considered statistically significant

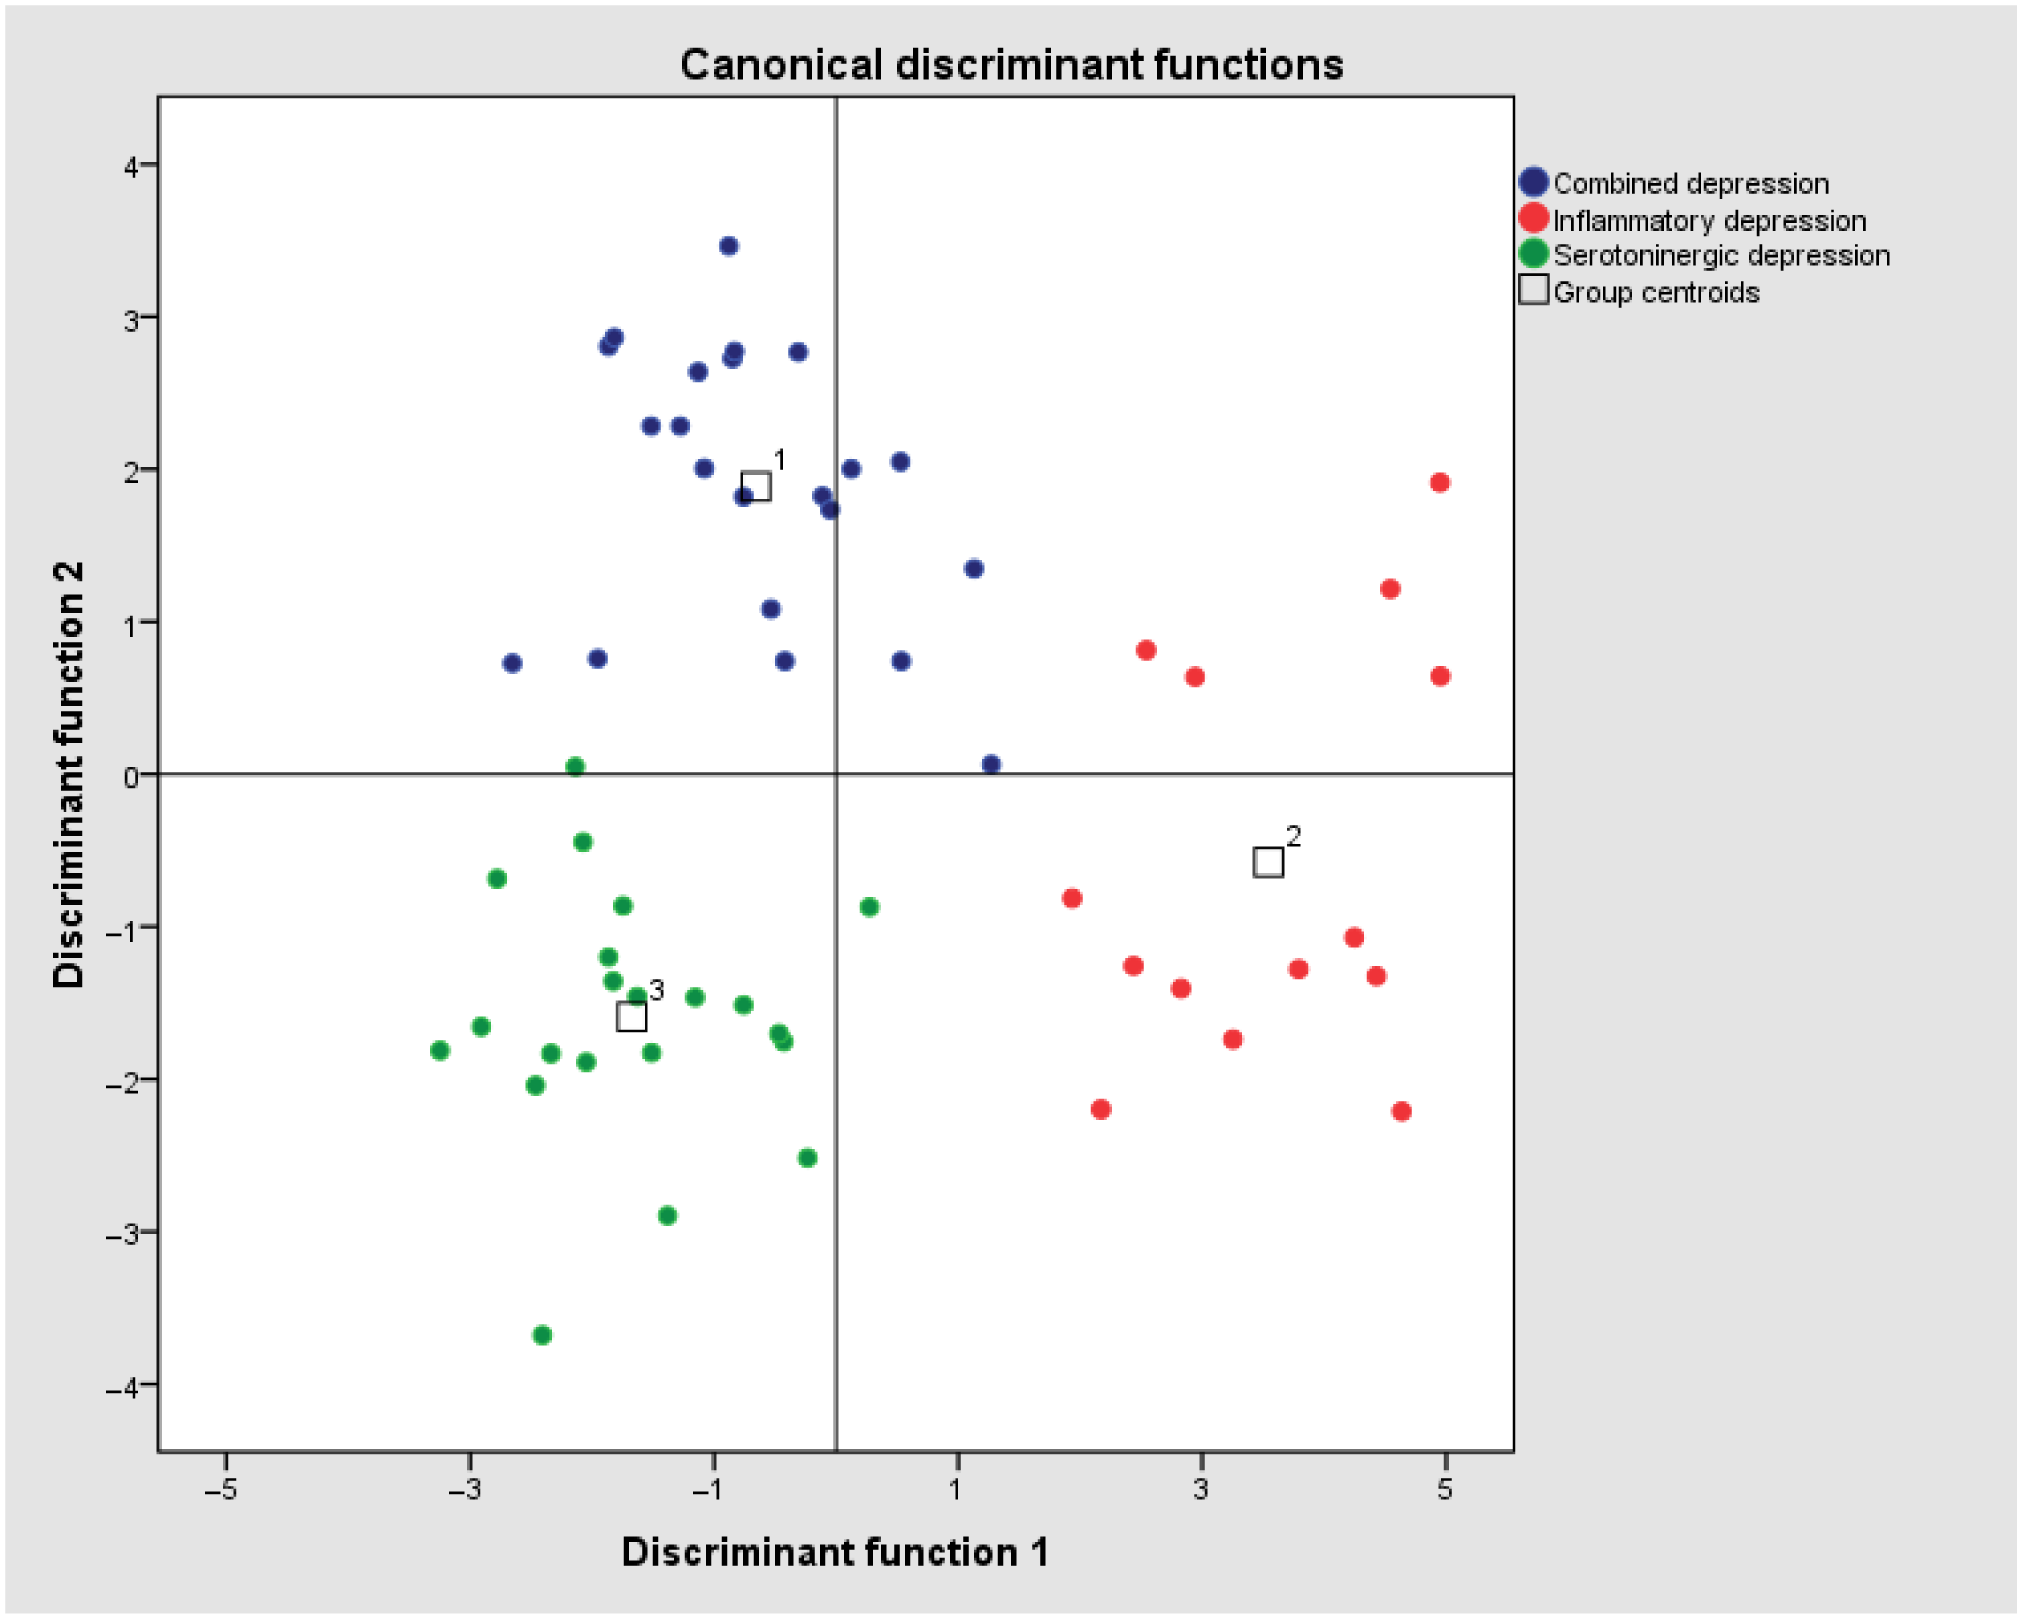
Finally, in the discriminatory analysis, we used the three subtypes of depressive disorder (inflammatory, serotonin, and combined-metabolic depressive disorder) as criterion variables. The predictor variables were laboratory, anthropometric, and clinical indicators, as mentioned above. In the discriminant analysis, we obtained two discriminant functions that were statistically significant (Table 4 in supplementary material, Fig. 1). The first discriminatory function obtained is predominantly described by platelet serotonin, which has a high positive projection on the function obtained (Fig. 1, Table 4 in supplementary material). On the other hand, the other discriminatory function obtained is predominantly described by cortisol, which has a high positive projection on function, and platelet serotonin with a relatively high negative projection on the function obtained (Fig. 1, Table 4 in supplementary material).
Graphical representation of centroids of groups in two-dimensional discrimination space. Discriminant functions as seen in Table 4 in supplementary material, and centroids are as seen in Table 5 in supplementary material. Blue dots represent combined depression, red dots represent Inflammatory depression while green dots represent serotoninergic depression cluster.

Using our model and with the help of defined laboratory, anthropometric, and clinical variables, we can discriminate in a high percentage a specific subtype of MDD. The inflammatory subtype of MDD can be correctly diagnosed with a possibility of 92.9%, the serotonin subtype depressive disorder with a possibility of 90.5%, and the combined metabolic subtype of depressive disorder with 81.8%.
Discussion
Our research was designed to investigate differences in platelet serotonin levels, cortisol, and inflammatory parameters in subjects with MDD and without MetS compared to a phenotypically healthy control group as the available medical literature did not provide any similar studies (Milaneschi et al., Reference Milaneschi, Lamers, Peyrot, Abdellaoui, Willemsen, Hottenga, Jansen, Mbarek, Dehghan, Lu, Boomsma and Penninx2016).
Within the group of MDD patients, the prevalence of MetS was 41.4%. In previously published studies addressing the prevalence of MetS in depressive disorder, the results varied between 3% and 58% (Capuron et al., Reference Capuron, Su, Miller, Bremner, Goldberg, Vogt, Maisano, Jones, Murrah and Vaccarino2008; Dunbar et al., Reference Dunbar, Reddy, Davis-Lameloise, Philpot, Laatikainen, Kilkkinen, Bunker, Best, Vartiainen and Lo2008; Vaccarino et al., Reference Vaccarino, McClure, Johnson, Sheps, Bittner, Rutledge, Shaw, Sopko, Olson and Krantz2008; Hildrum et al., Reference Hildrum, Mykletun, Midthjell, Ismail and Dahl2009; Seppälä et al., Reference Seppälä, Vanhala, Kautiainen, Eriksson, Kampman, Mäntyselkä, Oksa, Ovaskainen, Viikki and Koponen2012). First of all, an insight into the published research shows that different studies have used different diagnostic criteria to diagnose depressive disorder (Mannan et al., Reference Mannan, Mamun, Doi and Clavarino2016). Likewise, different values were used on the rating scales as inclusion criteria (Sjöberg et al., Reference Sjöberg, Karlsson, Atti, Skoog, Fratiglioni and Wang2017). Various criteria were also used to diagnose MetS (NCEP ATP III, Mod NCEP ATP III, IDF, AHA NHBLI 2004, IDF 2006, Mod IDF) (García-Toro et al., Reference García-Toro, Vicens-Pons, Gili, Roca, Serrano-Ripoll, Vives, Leiva, Yáñez, Bennasar-Veny and Oliván-Blázquez2016; Penninx & Lange, Reference Penninx and Lange2018). Compared to our study, there are also noticeable differences between the ages and the gender of the respondents involved. Published studies included subjects up to 90 years of age, or only third-age subjects, which significantly distorts the data obtained because it is a known fact that the prevalence of MetS increases with age (Balkau et al., Reference Balkau, Valensi, Eschwège and Slama2007; Eckel et al., Reference Eckel, Alberti, Grundy and Zimmet2010). This is why we included only respondents aged 18–50 years, thus eliminating the influence of age on the results. On the other hand, with increasing age, platelet serotonin concentrations decrease, and inflammatory parameters increase, leading to false-positive findings (Jernej et al., Reference Jernej, Banović, Cicin-Sain, Hranilović, Balija, Oresković and Folnegović-Smalc2000). Several previous studies indicate that a decrease in serotonin affects the development of certain components of the MetS, especially an increase in waist circumference and an increase in total body weight and serum glucose levels, which can result in the development of insulin resistance (Elhwuegi, Reference Elhwuegi2004; Herrera-Marquez et al., Reference Herrera-Marquez, Hernandez-Rodriguez, Medina-Serrano, Boyzo-Montes de Oca and Manjarrez-Gutierrez2011). Furthermore, previous research has linked a decrease in serotonin to hyperphagia, which can also be a symptom of a depressive disorder and consequently increase body weight and waist circumference (Lucki, Reference Lucki1998). In the context of our study, the fact that individual components of the MetS such as glucose levels and waist circumference have an inversely proportional relationship between serotonin concentration and levels seems to be of particular importance.
In our sample, we evaluated markers of chronic inflammation (Maes, Reference Maes2011; Maes et al., Reference Maes, Kubera, Mihaylova, Geffard, Galecki, Leunis and Berk2013) since they do play an important role in etiopathogenesis of depression. By acting on glucose homeostasis and metabolism as a whole, IL-6 and other inflammatory cytokines affect the serotonergic system. Cytokines can decrease presynaptic 5-HT neurons’ activity by decreasing serotonin synthesis, altering serotonin reuptake from the synaptic cleft, and altering postsynaptic 5-HT receptors (Maes et al., Reference Maes, Leonard, Myint, Kubera and Verkerk2011). Cytokines reduce tryptophan availability by inducing the enzyme indolamine-2,3-dioxygenase, which metabolises tryptophan to kynurenine. Furthermore, cytokines increase serotonin transmission, further depleting reserves in conditions where serotonin’s presynaptic availability is low due to reduced synthesis (Schiepers et al., Reference Schiepers, Wichers and Maes2005). Peripheral activation of the immune system can also affect serotonergic transporters’ positive regulation, leading to depletion of extracellular serotonin and alter the number and sensitivity of postsynaptic serotonergic receptors. MetS is also associated with a long-term increase in proinflammatory cytokines as well as with acute-phase inflammatory proteins such as CRP (Han et al., Reference Han, Sattar, Williams, Gonzalez-Villalpando, Lean and Haffner2002). Although the term obesity-linked metabolic inflammation is mainly linked to peripheral inflammation (Chan et al., Reference Chan, Cathomas and Russo2019), emerging literature suggests that MetS is a possible cause of the inflammation of the central nervous system (CNS), even suggesting that it causes the breakdown of the blood–brain barrier (Chan et al., Reference Chan, Cathomas and Russo2019). These findings underline the ‘cytokine hypothesis of depression’ in which inflammation plays a causative role in MDD progression (Schiepers et al., Reference Schiepers, Wichers and Maes2005). Previous research has shown that MDD is accompanied by reduced antioxidant status and induced oxidative and nitrosative pathways, and MetS are equally associated with altered inflammatory, oxidative, and nitrosative pathways (Maes, Reference Maes2011; Maes et al., Reference Maes, Kubera, Mihaylova, Geffard, Galecki, Leunis and Berk2013). Thus, the possible pathophysiological mechanisms that explain the presence of the MetS in depressive disorder represent a vicious circle in which serotonin, cortisol, and inflammatory cytokines are intertwined and mutually induced. Namely, serotonin’s low activity in the brain of people with depressive disorder is associated with appetite and eating disorders and hypobulia, and consequently, reduced physical activity leads together to weight gain. Adipose tissue secretes inflammatory cytokines, primarily IL-6, which stimulate tryptophan metabolism to kynurenine and result in serotonin deficiency. The depressive disorder continues and deepens, and the vicious circle does not stop.
In our analysis, we obtained three distinct subtypes of depressive disorder. First group of patients with depressive disorder was defined by low platelet serotonin concentration, high cortisol concentration, high glucose concentration, high triglycerides, high CRP concentration, high HAMD score, high waist circumference values, and a larger number of previous episodes, named Combined (metabolic) depressive disorder. Second, the inflammatory subtype is characterised by a concentration of platelet serotonin within the reference values, normal cortisol concentrations, and all other tested variables, except for elevated IL-6 values. The third, serotonin subtype of depressive disorder is characterised by an extremely low platelet serotonin concentration, and all other examined variables are in reference values. Research to date has linked MetS to depressive disorder. Still, it is important to stress that they do not offer a complete answer due to the fact that not all people with MDD also have MetS (Penninx & Lange, Reference Penninx and Lange2018). Equally, research links inflammatory processes (chronic and subacute inflammation) and MDD, but again, this hypothesis cannot explain the etiopathogenesis of depressive disorder in full (Goldberg, Reference Goldberg2011; Majd et al., Reference Majd, Saunders and Engeland2020). In this context, one may think of MetS as a complication of depressive disorder where at one point, multiple homeostatic and interconnected systems are involved, some of those not directly affected by psychopharmaceuticals routinely used in the treatment of the depressive disorder (Elenkov et al., Reference Elenkov, Iezzoni, Daly, Harris and Chrousos2005; Milaneschi et al., Reference Milaneschi, Lamers, Peyrot, Abdellaoui, Willemsen, Hottenga, Jansen, Mbarek, Dehghan, Lu, Boomsma and Penninx2016). Selective serotonin reuptake inhibitors antidepressants are effective in only about one-third of cases (Perlis, Reference Perlis2013). This is probably applicable to the serotonin subtype of depressive disorder obtained in our research.
A limitation of this study is a relatively small sample and the fact that patients were recruited from one Clinical University Hospital. Furthermore, clusters/discriminant functions were not tested on an independent sample and should be replicated. We would also like to stress that this research’s inclusion and exclusion criteria could be both assets and limitations of the study. Participants were excluded if they had any hormonal changes (i.e. menopause, pregnancy) or any other somatic comorbidity or MDD with psychotic symptoms, bipolar disorder (types I or II), and borderline or antisocial personality disorder limits the generalisability of our findings because of the vast diversity of MDD presentations in clinical practice.
Biologically speaking, depressive disorder is not unambiguous, i.e. different biological entities can result in clinical presentations that we today phenomenologically classify as a depressive disorder. Our results show that it is very likely that there is a cascading or temporal overlap of such defined subtypes of depressive disorder. For example, inflammatory or serotonin depressive disorders can ‘grow’ or ‘complicate’ into combined (metabolic) depression. We can also talk about the serotonin–inflammatory continuum of depressive disorder in which serotonin deficiency represents one end, inflammation the central part, and the combination of serotonin deficiency with elevated inflammatory state leads to a pathophysiological metabolic collapse of the depressed patient. We propose three subtypes of depressive disorder that can be considered as three different diseases or a continuum leading to a single clinical picture. These are combined (metabolic) depressive disorder: inflammatory depressive disorder and serotonin depressive disorder. This classification, in addition to the academic contribution, may contribute to change in the clinical approach in the treatment of depression by earlier inclusion of other psychopharmaceuticals and/or other (anti-inflammatory, minocycline, anti-glucocorticoid, beta 3, neurokinin, melatonin) drugs, in specific proportions according to the particular subtype of depressive disorder. Such approaches can undoubtedly be the subject of future research of a prospective nature.
Supplementary material
For supplementary material accompanying this paper visit https://doi.org/10.1017/neu.2021.30
Acknowledgements
AS DK and VP designed the study. VP and AS defined the inclusion and exclusion criteria for each group, checked all groups’ characteristics, and defined the outcome criteria and analytic approaches. DK did the data analyses. JV assisted with data analysis. VP and MdH assisted with the interpretation. AS and JV wrote the paper with input from DK, VP, and MdH. All authors approved the final form of the manuscript.
Financial support
This study was funded by the grant of the Croatian Ministry of science, education, and sport (MZOŠ, 134-0000000-3372). The study’s funder had no role in study design, data collection, data analysis, data interpretation, or writing of the manuscript. AS, DK, and VP had full access to all the data in the study, and the corresponding author had final responsibility for the decision to submit for publication.
Conflict of interest
The authors have no conflicts of interest to declare.