Implications
An accurate evaluation of the forage energy value is crucial to formulate diets that meet the energy requirements of ruminants, to maximise animal performances and reduce nutrient losses into the environment. Dynamic models to evaluate the energy value of forages require a large number of variables, some of them being poorly repeatable, time-consuming and expensive. The principal component analysis (PCA) allows to convert the original variables into a few latent components without much loss of information. In the current paper, the PCA was used to cluster forages in specific populations and predict their calculated energy content.
Introduction
Nowadays, more than 50% of dairy cows, producing about 70% of Italy's milk, are in the Po Valley of Northern Italy. Whole-plant corn, alfalfa and cool-season crops, either as silage or hay, are among the main forages fed to dairy cattle in this area and represent from 30% to 80% of the dietary dry matter (DM). A multi-year rotation consisting of alfalfa, corn and wheat crops is a frequent farming system. However, annual double crops, such as Italian ryegrass–corn or barley/triticale–sorghum crops, represent opportunities for maximising forage yield.
Forages are extremely variable in chemical composition, digestibility and intake potential (Oba and Allen, Reference Oba and Allen1999; Cherney, Reference Cherney2000). Therefore, an accurate and rapid estimate of these parameters is critical to formulate diets that meet animal energy requirements (De Boever et al., Reference De Boever, Cottyn, De Brabander, Vanacker and Boucqué1996; Weiss, Reference Weiss1998; Aguiar et al., Reference Aguiar, Tedeschi, Rouquette, McCuistion, Ortega-Santos, Anderson, DeLaney and Moore2011). Historically, the energy content of forages was estimated using empirical single-component equations based on specific nutrients such as NDF, ADF or crude fibre (Mertens, Reference Mertens1992; Rotz et al., Reference Rotz, Mertens, Buckmaster, Allen and Harrison1999; Ferreira and Mertens, Reference Ferreira and Mertens2005). A summative approach was adopted by dynamic nutritional models (Sniffen et al., Reference Sniffen, O'Connor, Van Soest, Fox and Russell1992; National Research Council (NRC), 2001; Robinson et al., Reference Robinson, Givens and Getachew2004) to estimate the net energy for lactation (NEL) content of forage on the basis of their total digestible nutrient (TDN) values and considering the level of intake of animals (Weiss et al., Reference Weiss, Conrad and St. Pierre1992; Weiss, Reference Weiss1998). The empirical and summative approaches differ mainly in the number of parameters required to estimate NEL. The former is based on a single laboratory determination and specific equations are used for each forage type, resulting in different regression coefficients for the same predictor (Mertens, Reference Mertens1992). In contrast, in the summative approach, a unique equation is used to estimate the NEL of different feeds, but a large number of parameters are needed. A major disadvantage of complex models is the large number of laboratory parameters, with some being poorly repeatable, time-consuming and expensive (Cherney, Reference Cherney2000; Spanghero et al., Reference Spanghero, Berzaghi, Fortina, Masoero, Rapetti, Zanfi, Tassone, Gallo, Colombini and Ferlito2010). In addition to chemical parameters, biological parameters such as in situ rumen NDF degradation characteristics have been proposed to properly evaluate forages used in dairy cow diets (Van Amburgh et al., Reference Van Amburgh, Van Soest, Robertson and Knaus2003; Robinson et al., Reference Robinson, Givens and Getachew2004; Krämer et al., Reference Krämer, Weisbjerg, Lund, Jensen and Pedersen2012). In particular, it has been proved that biological measurements can be useful to improve the prediction of in vivo nutrient digestibility and the energy values of forages (De Boever et al., Reference De Boever, Cottyn, De Brabander, Vanacker and Boucqué1996; Robinson et al., Reference Robinson, Givens and Getachew2004).
Therefore, a viable reduction process of parameters, at the same time capable of classifying forages and properly predicting their energy content, could be useful to address this issue (Aguiar et al., Reference Aguiar, Tedeschi, Rouquette, McCuistion, Ortega-Santos, Anderson, DeLaney and Moore2011). However, many parameters in a data set with a large number of chemical/biological measurements are correlated, and the use of correlated parameters in a prediction equation often results in a non-robust model. With principal component analysis (PCA), it is possible to convert the original variables into a small number of principal components (PC), which are not correlated (O'Rourke et al., Reference O'Rourke, Hatcher and Stepanski2005; Stevens, Reference Stevens2009).
The aims of the current experiment were to use PCA, on the one hand, to characterise forage populations and, on the other, to reduce the number of variables to those useful for obtaining a rapid and accurate prediction of the calculated energy value.
Material and methods
A set of 180 forages were randomly collected from different locations of the Po Valley, Northern Italy, in the 2009 to 2010 harvest seasons. Samples collected were: 47 alfalfa (including first alfalfa cutting) hays, 26 grass hays (i.e. cool-season annual and perennial grass forages), 52 corn silages, 35 small grain silages and 20 forage sorghum silages.
Sampling procedure
The forages were sampled by trained people. In particular, hays from small square, large square or large round bales and silages from wrapped bales were identified and collected from at least three bales randomly selected. The silages in the bunkers were sampled at least 3 weeks after ensiling and from different sites (i.e. bottom, middle and top) of freshly cut face. Samples were taken with a cylindrical probe (35 × 5 cm; Quas Franco, Spilimbergo, Pordenone, Italy), and at least three probes were pooled in a single bag and mixed thoroughly. Samples were sent to a laboratory within 24 h for analysis.
Chemical analysis
The whole sample was dried (60°C in a ventilated oven until constant weight), ground through a 1-mm screen using a laboratory mill (Thomas-Wiley, Arthur H. Thomas Co., Philadelphia, PA, USA) and stored until analysis. All samples were assayed in duplicate. The DM was determined by gravimetric loss of free water by heating at 105°C for 3 h (Association of Official Analytical Chemists (AOAC), 1995, method 945.15); ash was determined as gravimetric residue after incineration at 550°C for 2 h (AOAC, 1995, method 942.05) and ether extract (EE) was obtained following the method 920.29 of AOAC (1995). The CP (N × 6.25) was determined using the Kjeldahl method (AOAC, 1995, method 984.13). The soluble fraction of CP (expressed on a CP basis) was determined according to Licitra et al. (Reference Licitra, Hernandez and Van Soest1996). The NDF, ADF and ADL were determined using the AnkomII Fiber Analyzer (Ankom Technology Corporation, Fairport, NY, USA). The NDF analyses utilised a neutral detergent solution containing sodium sulphite and a heat stable amylase (activity = 17 400 Liquefon units/ml, Ankom Technology). The NDF, ADF and ADL contents were corrected for the residual ash content. The neutral (i.e. NDICP) and acid (i.e. ADICP) detergent-insoluble CP fractions were determined as residual nitrogen of Ankom fibre bags (Van Soest et al., Reference Van Soest, Robertson and Lewis1991). Starch was measured by polarimetry (Polax 2L, Atago®, Tokyo, Japan) according to European Community official method of analysis (EC, 1999). The non-fibre carbohydrates (NFC) were calculated as: 100 − (CP + ash + EE + (NDF − NDICP)).
In situ digestible and indigestible NDF (iNDF) determinations
The digestibility of NDF (dNDF) was measured in situ by incubating nylon bags in the rumen of two cannulated dry cows for 12, 24, 48 and 288 h (Spanghero et al., Reference Spanghero, Berzaghi, Fortina, Masoero, Rapetti, Zanfi, Tassone, Gallo, Colombini and Ferlito2010). Animal care was in accordance with the EC Council Directive guidelines for animals used for experimental and other scientific purposes (EC, 1986). The cows were daily fed 10 kg DM of a total mixed ration daily consisting of alfalfa hay, ryegrass hay, corn silage and concentrate (i.e. 300, 300, 300 and 100 g/kg DM, respectively) in two portions at 0800 and 1800 h. The diet contained 120 g CP and 550 g NDF/kg DM.
The rate of NDF digestion (kd, h−1) was calculated from the undigestible fractions at different time points using a first-order model (Mertens, Reference Mertens1993b) and assuming a constant lag time of 3 h (Van Amburg et al., Reference Van Amburgh, Van Soest, Robertson and Knaus2003). The undigestible fraction after 288 h of incubation was considered as the iNDF.
Net energy calculations
The energy content of forages was calculated using equations (1) –(4) of NRC (2001) for the truly digestible (td, g/100 g DM) NFC, tdCP, td fatty acid (FA) and tdNDF determinations. The FA content of forages can be estimated as (EE − 1):
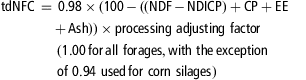 $$\,\,\!\!\matrix { {\rm{tdNFC}}\: = \:0.98\times (100\:{\rm{ - }}\:(({\rm{NDF}}\:{\rm{ - }}\:{\rm{NDICP}}) + {\rm{CP}} + {\rm{EE}}\: \cr \quad\ \ \ + \:{\rm{Ash}}))\times {\rm{processing}} \ {\rm{adjusting \ factor}}\ \cr \ \ \ \ \ \ \ \ (1.00\,{\rm{for}}\,{\rm{all}}\ {\rm{forages,}}\,{\rm{with}}\ {\rm{the}}\,{\rm{exception}}\ \cr \,\!\quad\quad\quad\quad\quad{\rm{of}}\ 0.94\ {\rm{used}}\,{\rm{for}}\ {\rm{corn}}\ {\rm{silages}}) \,\quad\quad\quad\quad\quad(1)\end{}$$
 $${\rm{tdCP}} = {\rm{CP}}\:\times \:{{{\rm{e}}}^{({\rm{ - }}1.2\:\times \:({\rm{ADICP}}/{\rm{CP}}))}} $$
 $$ {\rm{tdFA}} = {\rm{FA}}\,({\rm{if}}\,{\rm{EE}}\, \less \,1,\,{\rm{then}}\,{\rm{FA}}\: = \:0) $$
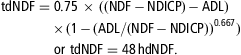 $$ \matrix { {\rm{tdNDF}} = 0.75\:\times \:(({\rm{NDF}}\:{\rm{ - }}\:{\rm{NDICP}})\:{\rm{ - }}\:{\rm{ADL}})\:\cr \ \quad\quad\quad\quad\times \:(1\:{\rm{ - }}\:{{({\rm{ADL}}/({\rm{NDF}}\:{\rm{ - }}\:{\rm{NDICP}}))}^{0.667}} ) \\ {\rm{or}}\ {\rm{tdNDF}} = 48\:{\rm{h dNDF}}{\rm{.}}<! \\ >\end{} $$
Two values for digestible energy at maintenance (DE1x) were estimated for each tested forage using equation (5) of NRC (2001): the first (i.e. DE1x-Lig) was based only on chemical parameters, whereas the second (i.e. DE1x-48 h) was based on both chemical parameters and dNDF evaluated in situ at 48 h incubation.
 $$ \ \ \, {({\rm{D}}{{{\rm{E}}}_{1{\rm{x}}}},\,{\rm{Mcal}}/{\rm{kg}}) = &({\rm{tdNFC}}/100)\:\times \:4.2\: + \:({\rm{tdCP}}/100) \cr &\!\times 5.6 + ({\rm{tdFA}}/100) \times {}9.4\: \cr &\!+ ({\rm{tdNDF}}/100) \times 4.2 - 0.3 \ \ \ \ \ \ \,(5)$$
Thereafter, applying equation (6) (i.e. discount for diet containing 74% of TDN1x and intake level of three times maintenance level of intake), equations (7)–(9), two values for NEL three times maintenance (i.e. NEL3x-Lig and NEL3x-48 h) were estimated from DE1x-Lig and DE1x-48 h, respectively:
 $$\ \ \, {{\rm{Discount}} = & (({\rm{TD}}{{{\rm{N}}}_{1{\rm{x}}}}\ {\rm{of}}\ {\rm{diet}}\:{\rm{ - }}\,((0.18\times {\rm{TD}}{{{\rm{N}}}_{1{\rm{x}}}}\ {\rm{of}}\ {\rm{diet}})\,\cr &{\rm{ - }}\,10.3)\times 2)/{\rm{TD}}{{{\rm{N}}}_{1{\rm{x}}}}\ {\rm{of}}\ {\rm{diet}}) \ \ \ \ \ \ \ \ \ \ \ \ \ \ \ (6) $$
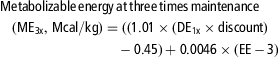 $$\ \ { {\rm{Metabolizable}}\,{\rm{energy}}\,{\rm{at}}\,{\rm{three}}\,{\rm{times}}\,{\rm{maintenance}}\,\cr &\!\!\!\!\!\!\!\!\!\!\!\!\!\!\!\!\!\!\!\!\!\!\!\!\!\!\!\!\!\!\!\!\!\!\!\!\!\!\!\!\!\!\!\!\!\!\!\!\!\!\!\!\!\!\!\!\!\!\!\!\!\!\!\!\!\!\!\!\!\!\!\!\!\!\!\!\!\!\!\!\!\!\!\!\!\!\!\!\!\!\!\!\!\!\!\!\!\!\!\!\!\!\!\!\!\!({\rm{M}}{{{\rm{E}}}_{3{\rm{x}}}},\,{\rm{Mcal}}/{\rm{kg}}) = ((1.01\times ({\rm{D}}{{{\rm{E}}}_{1{\rm{x}}}} \times {\rm{discount}})\:\cr & \!\!\!\!\!\!\!\!\!\!\!\!\!\!\!\!\!\!\!\!\!\!\!\!\!\!\!\!\!\!\!\!\!\!\!\!\!\!\!\!\!\!\!\!\!\!\!\!\!\!\!\!\!\!\!\!\!\!\!\!{\rm{ - }}\:0.45) + 0.0046 \times ({\rm{EE}}\:{\rm{ - }}\:3) \ \ \ $$
 $$\!\!\!\!\!\!{\rm{if}}\ {\rm{EE}}\: \less \:3,\:{\rm{N}}{{{\rm{E}}}_{{\rm{L}}3{\rm{x}}}}\,({\rm{Mcal}}/{\rm{kg}}) = (0.703 \times {\rm{M}}{{{\rm{E}}}_{3{\rm{x}}}})\:{\rm{ - }}\:0.19$$
 $$\displaylines{ & {\rm{if}}\ {\rm{EE}}\: \great \:3,\,{\rm{N}}{{{\rm{E}}}_{{\rm{L}}3{\rm{x}}}}\,({\rm{Mcal}}/{\rm{kg}}) = (0.703 \times {\rm{M}}{{{\rm{E}}}_{3{\rm{x}}}})\:{\rm{ - }}\:0.19\: \cr & \quad+ (((0.097 \times {\rm{M}}{{{\rm{E}}}_{3{\rm{x}}}} + 0.19)/97) \times ({\rm{EE}}\:{\rm{ - }}\:3)) \ \ \ \ \ \ \ \ \ \,$$
Statistical analysis
Data were analysed as a completely randomised design using the GLM procedure of Statistical Analytical System (SAS, 2003) and according to the model described below
 $$ {{Y}_{ij}}\: = \:\mu \: + \:{{\alpha }_i}\: + \:{{e}_{ij}} $$
where Yij is the dependent variable on the j th subject assigned to forage class i (i.e. alfalfa hay, grass hay, corn silage, small grain silage and sorghum silage), μ is the overall mean, αi is the fixed effect of forage class (i = 1 to 5) and eij is the residual error. The minimum significant difference (MSD) was generated from Tukey's test at P < 0.05 and it was used for comparison among means.
A PCA was performed using the FACTOR procedure of SAS (2003). The PRIN method with Kaiser's criterion (i.e. eigenvalue >1.0; Stevens, Reference Stevens2009) and the orthogonal Varimax rotation (ROTATE option) were used to extract latent constructs. This procedure generated loading (correlations between common latent factors and original variables) vectors. The forages were characterised for their position on the first two rotated extracted components. Then, a hierarchical cluster analysis was performed using the unweighted pair group mean with the arithmetic averages (UPGMA) method by the CLUSTER procedure of SAS (2003) to confirm population differentiation. The CORR procedure of SAS (2003) was used to study simple relationships between the rotated extracted components and the two NEL values (i.e. NEL3x-Lig and NEL3x-48 h). The variables with loading vectors of more than 0.50 were retained and interpreted to obtain a forage subject-based score (FS) characterising each tested forage. In particular, the threshold value to retain variables was obtained by multiplying the critical value of a correlation coefficient at α = 0.01 for a two-tailed test (i.e. 0.2) by 2.5 (Stevens, Reference Stevens2009). The NEL values were regressed on FS with the REG procedure of SAS (2003).
Results
Chemical composition, NDF digestibility, iNDF and energy evaluations of forages
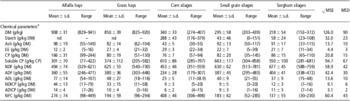
The range in chemical composition of the analysed samples could be considered typical for each forage class (Table 1). In particular, the average forage CP contents ranged from 76 in corn silages to 166 g/kg DM in alfalfa hays, with the soluble fraction higher in silages than in hays (MSD = 67 g/kg CP, P < 0.05). The average ash content was over 80 g/kg DM for all forages, except for corn silages. The ash, EE and CP intra-forage coefficients of variation (CVs) were generally lower than 25%, except for the CVs of EE in small grain (i.e. 32%) and sorghum silages (i.e. 33%).
Chemical parameters of alfalfa hays (n = 47), grass hays (n = 26), corn silage (n = 52), small grain silages (n = 35) and sorghum silages (n = 20)

DM = dry matter; nd = not determined; EE = ether extract; ADICP = acid detergent insoluble CP; NDICP = neutral detergent insoluble CP; NFC = non-fibre carbohydrate.
P-value of the model (one-way ANOVA and post hoc Tukey's test) <0.05 for all parameters analysed.
As expected, grass hays, small grain and sorghum silages were characterised by higher (MSD = 42 g/kg DM, P < 0.05) NDF mean values than corn silages and alfalfa hays. The corn silages had the lowest ADF and ADL mean values (MSD = 30 and 10 g/kg DM, P < 0.05). The CV associated with NDICP ranged from 25% to 56%, respectively, for sorghum and small grain silages. The ADICP intra-forage CVs were more homogenous among forage classes and ranged from 27% to 33%, respectively, for sorghum and small grain silages.
The NFC contents differed among forages (MSD = 43 g/kg DM, P < 0.05); the lowest CV was measured in corn silages (i.e. 11%), whereas the highest was measured for sorghum silages (i.e. 40%).
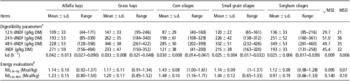
Forages had a different degradability of NDF at each time of rumen incubation (P < 0.05; Table 2). In addition, the CV (calculated on all tested forages) decreases with the increase in rumen incubation time, being 31.9%, 26.2%, 23.0% and 9.1% for 12, 24, 48 and 288 h dNDF, respectively.
Digestibility parameters and energy evaluations of alfalfa hays (n = 47), grass hays (n = 26), corn silage (n = 52), small grain silages (n = 35) and sorghum silages (n = 20)

dNDF = digestible NDF; DM = dry matter; iNDF = indigestible NDF; kd = rate of NDF degradability.
P-value of the model (one-way ANOVA and post hoc Tukey's test) <0.05 for all parameters analysed.
adNDF evaluated after 12, 24 and 48 h of in situ rumen incubations (12 h, 24 h or 48 h dNDF; respectively).
bNet energy for lactation values estimated according to National Research Council (2001) and based either on chemical parameters (NEL3x-Lig) or both chemical parameters and 48 h dNDF (NEL3x-48 h).
The iNDF differed among forages (MSD = 32 g/kg DM, P < 0.05), with the lowest mean value measured in corn silages and the highest in alfalfa hays. The highest forage mean kd (MSD = 0.006 h−1, P < 0.05) was calculated for alfalfa hays, whereas the lowest average values were obtained for small grain and sorghum silages.
The forage mean NEL-Lig was higher (MSD = 0.07 Mcal/kg, P < 0.05) for corn silage than for other forages. The inclusion of 48 h dNDF reduced numerically the NEL-48 h in small grain and sorghum silages and increased the energy values of corn silages, alfalfa and grass hays. The CVs associated with NEL-Lig ranged from 6.0% to 9.7% for corn silages and grass hays, respectively. The CVs calculated for NEL-48 h were more variable among forage classes, ranging from 7% to 20% for corn and sorghum silages, respectively.
Multivariate analysis
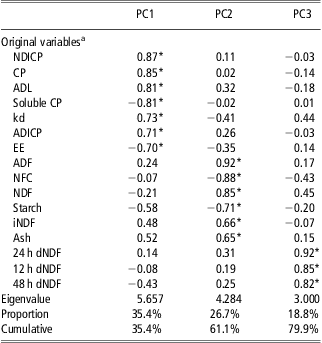
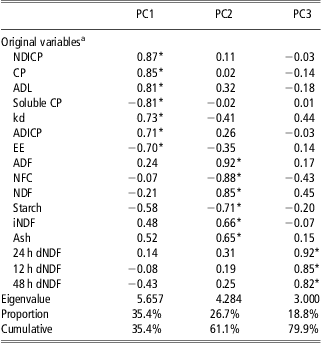
The Kaiser measure of sampling adequacy was equal to 0.71 and exceeded the threshold value of 0.60 (Stevens, Reference Stevens2009). Therefore, the data set was considered suitable for PCA (Cerny and Kaiser, Reference Cerny and Kaiser1977). As a matter of fact, three components were retained from PCA, explaining 79.9% of the total variability of original data (Table 3). The loading vectors associated with the original variables for each component are also reported.
Loading vectors of original variables on Varimax rotated extracted PC as estimated by multivariate analysis
PC = principal components; NDICP = neutral detergent insoluble CP; kd = rate of NDF degradability; ADICP = acid detergent insoluble CP; EE = ether extract; NFC = non-fibre carbohydrate; iNDF = indigestible NDF; dNDF = digestible NDF.
*Variables loaded on extracted components (i.e. loading vectors higher than 0.50).
adNDF evaluated after 12, 24 and 48 h of in situ rumen incubations (12 h, 24 h or 48 h dNDF, respectively).
The variables having the greater weight on component 1 were NDICP, CP, ADL, kd, ADICP, EE and soluble CP. The ADF, NDF, iNDF, ash, starch and NFC loaded on PC2, whereas the three in situ dNDF evaluations (i.e. 12, 24 and 48 h dNDF) loaded on PC3.
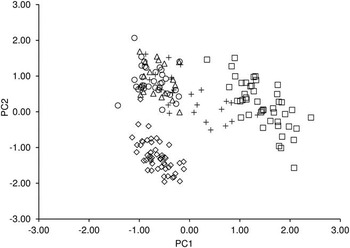
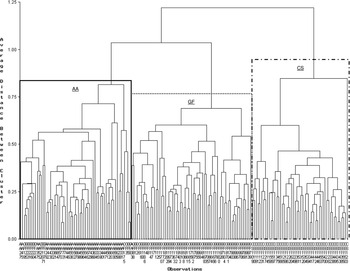
A two-dimensional plot characterised each sample for their position on PC1 and PC2 (Figure 1). The plot allows for the identification of the three main populations: corn silage, alfalfa hay and a generic population of so-called ‘grasses’ consisting of grass hays, small grain and sorghum silages. Similarly, three clusters were obtained by cluster analysis (Figure 2). A cluster was exclusively made by corn silages, whereas the other two clusters were mainly constituted by grasses and alfalfa hays.
Plot of first (X-axis) and second (Y-axis) rotated (Varimax rotation technique) extracted principal components (PC) estimated by multivariate analysis. Symbols are ‘+’ grass hays, ‘□’ alfalfa hays, ‘○’ small grain silages, ‘◊’ corn silages and ‘Δ’ sorghum silages.

Dendrogram by cluster analysis showing the average distance between forages belonging to alfalfa, corn and grass populations (AA, CS and GF, respectively).

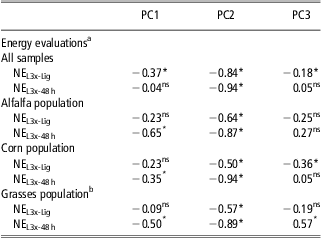
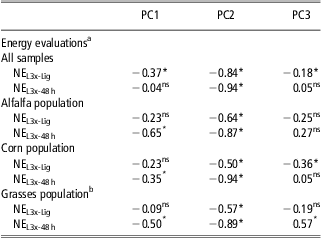
In Table 4, the correlation coefficients between the two NEL values and the three main PCs are presented. Considering all samples, NEL3x-Lig was correlated (P < 0.05) to all three components, with the highest coefficient for PC2. NEL3x-48 h was only correlated to PC2 (r = −0.94; P < 0.05). Similarly, PC2 was highly correlated with both NEL3x-Lig and NEL3x-48 h when analysis was carried out within forage populations. However, significant (P < 0.05) correlations were also observed between NEL3x-48 h and PC1, with higher correlation coefficients observed for alfalfa and grasses (r = −0.65 and r = −0.50, respectively) than for corn populations (r = 0.35). PC3 was related (P < 0.05) to NEL3x-Lig in the corn population and to NEL3x-48 h in grasses.
Pearson coefficients of correlation between Varimax rotated extracted PC and energy evaluations in all samples (n = 180) or alfalfa (n = 47), corn (n = 52) and grasses (n = 81) populations
PC = principal components; ns = not significant.
*P < 0.05.
aNet energy for lactation values estimated according to National Research Council (2001) and based either on chemical parameters (NEL3x-Lig) or both chemical parameters and 48 h dNDF (NEL3x-48 h).
bThe grasses population consisted of grass hays (n = 26), small grain silages (n = 35) and sorghum silages (n = 20).
The FS were calculated using loadings (Table 3) associated with the variables with the greatest weight on PC2, these being ash, starch, NDF and iNDF (scoring factors of 0.112, −0.141, 0.227 and 0.170, respectively).
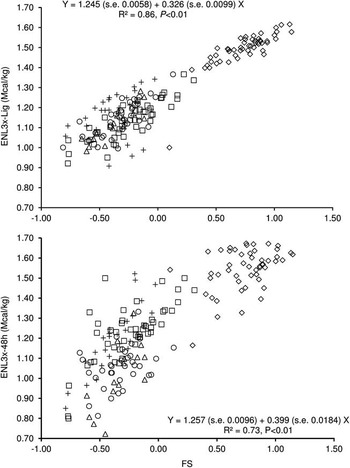
The highest (P < 0.05) FS was obtained for corn silages (i.e. 0.75 ± 0.21), whereas the lowest (P < 0.05) was obtained for grass hays, sorghum and small grain silages (i.e. −0.37 ± 0.20, −0.36 ± 0.17 and −0.34 ± 0.20, respectively). The alfalfa hays were characterised with an intermediate FS value (i.e. −0.24 ± 0.26). The relationships between FS and NEL evaluations are shown in Figure 3. The highest coefficient of determination (i.e. R 2 = 0.86, P < 0.05) and the lowest standard errors of intercept (i.e. 0.0058) and slope (i.e. 0.0130) were obtained when ENL3x-Lig was regressed on FS. Moreover, FS accounted for 73% of the variation of ENL3x-48 h when analysis was carried out on all data.
Regression of energy evaluations (Y-axis), estimated according to National Research Council (NRC, 2001) and based either on chemical parameters or both chemical parameters and 48 h digestible NDF (NEL3x-Lig and NEL3x-48 h, respectively), on forage subject scores (FS, X-axis). Symbols are ‘+'grass hays, ‘□’ alfalfa hays, ‘○’ small grain silages, ‘◊’ corn silages, ‘Δ’ sorghum silages.

Discussion
Chemical composition, NDF digestibility, iNDF and energy evaluations of forages
In general, both mean and standard deviations of chemical parameters could be considered similar to those reported by the NRC (2001) for specific forage classes. However, some differences related mainly to structural carbohydrates (i.e. NDF, ADF and ADL) and CP contents were observed, suggesting that the tested forages were presumably harvested from a mid to an advanced stage of maturity. These differences were not observed for corn silages, having a numerically lower ADF when compared with NRC (2001) ‘normal’ corn silages.
The 48 h in situ assay is the time suggested by NRC (2001) as an alternative to calculate the tdNDF value and, being less affected by both lag time and rate of degradation than earlier incubation times (Mertens, Reference Mertens1992; Spanghero et al., Reference Spanghero, Berzaghi, Fortina, Masoero, Rapetti, Zanfi, Tassone, Gallo, Colombini and Ferlito2010), it could be used to compare different forages. However, some authors evaluated the opportunity to reduce the length of the rumen incubation to 30, 24 h or even shorter (Ferreira and Mertens, Reference Ferreira and Mertens2005; Spanghero et al., Reference Spanghero, Berzaghi, Fortina, Masoero, Rapetti, Zanfi, Tassone, Gallo, Colombini and Ferlito2010; Tagliapietra et al., Reference Tagliapietra, Cattani, Hansen, Hindrichsen, Bailoni and Schiavon2011). Despite an increased data variability (Spanghero et al., Reference Spanghero, Berzaghi, Fortina, Masoero, Rapetti, Zanfi, Tassone, Gallo, Colombini and Ferlito2010), a reduced rumen incubation time could better describe the real NDF degradation dynamic in the rumen of high-producing dairy cows at high levels of intake (Goeser and Combs, Reference Goeser and Combs2009; Tagliapietra et al., Reference Tagliapietra, Cattani, Hansen, Hindrichsen, Bailoni and Schiavon2011).
The forages were also characterised by iNDF after 288 h of rumen incubation. Its importance was highlighted by Mertens (Reference Mertens1993a), suggesting that ‘the estimation of indigestible fraction is not a mathematical or modelling contrivance, but is a critical biological principle’ needed to estimate the potentially available degradable NDF pool. A way to rapidly estimate the iNDF is based on the concept that lignin represents the first factor limiting NDF digestibility and it is highly correlated to the iNDF fraction (Weiss, Reference Weiss1998; Ferreira and Mertens, Reference Ferreira and Mertens2005; Vieira et al., Reference Vieira, Campos, Silva, Tedeschi and Tamy2012). Currently, the Cornell Net Carbohydrate and Protein System (CNCPS) nutritional model uses a lignin content that is 2.4 times lignin content of NDF to calculate the iNDF (Sniffen et al., Reference Sniffen, O'Connor, Van Soest, Fox and Russell1992; Vieira et al., Reference Vieira, Campos, Silva, Tedeschi and Tamy2012), whereas iNDF is not considered by Dairy NRC (2001). This simple equation was originally based on long-term (60 to 90 days) methane yield on some waste materials, and then tested on several forages by Traxler et al. (Reference Traxler, Fox, Van Soest, Pell, Lascano, Lanna, Moore, Lana, Vèlez and Flores1998). As reported by these authors, the equation was able to correctly predict iNDF of the different forages.
Recently, some authors (Krämer et al., Reference Krämer, Weisbjerg and Lund2010; Krämer et al., Reference Krämer, Weisbjerg, Lund, Jensen and Pedersen2012; Vieira et al., Reference Vieira, Campos, Silva, Tedeschi and Tamy2012) reported that the use of a constant coefficient could result in an inaccurate estimate of the iNDF among different forages. In particular, Krämer et al. (Reference Krämer, Weisbjerg and Lund2010) observed variable iNDF/ADL ratios among forages, ranging from 1.8 to 3.6 in grass hays and red clover, respectively. Our results support the idea that the use of a fixed factor for different forages could result in deviating iNDF estimates.
In addition, the rate of NDF digestion (i.e. kd) in the rumen could be useful to discriminate between forage quality (Van Amburgh et al., Reference Van Amburgh, Van Soest, Robertson and Knaus2003). A higher kd (P < 0.05) was observed in alfalfa hays compared with other forages, in accordance with Mertens (Reference Mertens1993b) reporting that alfalfa had a more rapid rate of NDF digestion than other forages, but to a lower extent, showing a fibre digestion plateau at a lower level. For corn silages, Van Amburgh et al. (Reference Van Amburgh, Van Soest, Robertson and Knaus2003) reported the kd of NDF of 21 samples (three were brown midrib hybrids), estimated with multiple time point calculations (i.e. from 6 to 36 h of rumen incubation) and variable lag time, ranging from 0.035 to 0.071 h−1. In our model, the 48 h dNDF value was included and this value, being near the inflection point of the degradation curve in the slow pool of neutral detergent residue, could be associated with a reduction of kd (Mertens, Reference Mertens1993b; Ferreira and Mertens, Reference Ferreira and Mertens2005).
Referring to energy evaluations, different authors have debated on which of these approaches could be considered the most accurate (Robinson et al., Reference Robinson, Givens and Getachew2004; Tagliapietra et al., Reference Tagliapietra, Cattani, Hansen, Hindrichsen, Bailoni and Schiavon2011). Our data are inadequate to evaluate the methods of calculating NEL. However, we observed some discrepancies between the two tested methods (i.e. NEL3x-Lig and NEL3x-48 h) in calculating the NEL of different forages. In particular, the average NEL3x-48 h was slightly higher than NEL3x-Lig in corn silages (3%), alfalfa (8%) and grass hays (3%). In contrast, when NEL was evaluated in small grain and sorghum silages, numerically lower values were obtained for NEL3x-48 h with respect to NEL3x-Lig (i.e. −9% in small grain silages and −13% in sorghum silages). In addition, the use of 48 h dNDF to compute NEL calculation numerically increased the variability and range of variation of energy evaluation of forage classes.
Multivariate analysis
The forages were classified for 17 parameters, either required by the different models for NEL calculation of feeds or recommended to properly rank the forage quality. The multivariate analysis is an interesting statistical approach used to analyse inter-relationships between a large number of parameters and explain them in terms of their common dimensions (i.e. latent component). As described by Desnoyers et al. (Reference Desnoyers, Giger-Reverdin, Sauvant and Duvaux-Ponter2011), the approach condenses the information of original variables into a new and smaller set of latent factors while minimising the loss of information. To simplify the interpretation of results from PCA, a Varimax rotation of axes was carried out (Abdi, Reference Abdi2003; Stevens, Reference Stevens2009).
Up to now, the multivariate analysis has had only limited use in agricultural research, particularly in feed evaluation. In the past, linear regression analysis based on both chemical and biological (i.e. in vitro rumen fluid or enzymatic digestibility) parameters was used to predict the energy value of feeds and forages (Givens et al., Reference Givens, Everington and Adamson1989; De Boever et al., Reference De Boever, Cottyn, De Brabander, Vanacker and Boucqué1996). More recently, some authors used multivariate analysis techniques to extract latent variables linked to the milk yield and lactation persistency of dairy cows (Macciotta et al., Reference Macciotta, Vicario and Cappio-Bonino2006), to study the influence of quality parameters on the methanogenic potential of different forages (Jayanegara et al., Reference Jayanegara, Wina, Soliva, Marquardt, Kreuzer and Leiber2011) or the between-goat variability in feeding behaviour (Desnoyers et al., Reference Desnoyers, Giger-Reverdin, Sauvant and Duvaux-Ponter2011).
The PCA allowed the characterisation of each sample for its position on extracted components, and the affiliation of single forage to a specific population was visually defined. Thus, in our database, three main populations were identified by the first two constructs: corn silage, alfalfa hay and ‘grasses’, the latter made up of grass hays, small grain and sorghum silages. In particular, PC1 defined two populations: alfalfa and Graminaceae forages. However, a partial overlap between poor-quality alfalfa hays and grass hays was observed, probably because the alfalfa population was composed of either alfalfa or alfalfa/grass (i.e. first alfalfa cutting) hays. PC2 seemed more selective in differentiating the Graminaceae population between corn silage and grasses. No additional populations were identified by PC3, suggesting that it was not as critical as the previous PCs in population differentiation.
A cluster analysis was run on all forages to confirm the results obtained by PCA. As shown in Figure 2, three clusters were identified. In particular, all the corn silages were grouped into one cluster, whereas some forages classified as grasses (16.7%) were included in the alfalfa cluster, confirming the observations discussed above.
Another application of PCA analysis is to narrow down the number of variables to those mainly related to a specific parameter of interest (i.e. NEL content of forages). In this context, it should be mentioned that the computation of NEL values was done by using some parameters having an important weight on PCs. The PC2 was highly correlated to NEL and it included ash, NFC, starch, NDF, ADF and iNDF. Even if other extracted factors explained a significant amount of total variation, their coefficients of correlation with NEL ranged from low to zero. Thus, only variables loading on this component were retained to obtain the FS of each tested forage. The NFC was removed by FS estimate because it is calculated from other analytical determinations (i.e. CP, EE, ash, NDF and NDICP). In addition, the remaining selected variables were correlated with each other (Supplementary Table S1) with very high coefficients of correlation measured for NDF v. ADF and starch v. ash (r = 0.82 and r = −0.82, respectively; P < 0.05). Starch is routinely measured on corn silage and it could be useful as a discriminating measurement. Even if ash was highly correlated to starch, it was retained because it could be extremely valuable in specific forages because of its dilution effect on energy value (e.g. high soil contamination), whereas the NDF rather than ADF was retained in FS calculation to avoid an additional analytical (i.e. acid detergent treatment) step to obtain a value that is correlated to NDF (De Boever et al., Reference De Boever, Cottyn, De Brabander, Vanacker and Boucqué1996).
Therefore, the original parameters retained to calculate FS were ash, starch, NDF and iNDF. Even if this approach may not be completely perfect as not all the original variables were used to compute the factor score (O'Rourke et al., Reference O'Rourke, Hatcher and Stepanski2005), the adopted solution is reasonable from a practical point of view too. In particular, the approach allowed for a limited number (i.e. three in hays or four in silages) of parameters used in FS calculation, thus resulting in a less expensive and time-consuming preliminary quality forage evaluation.
Both NEL evaluations (Y-axis) were related to FS (X-axis), with a higher relationship observed for NEL3x−Lig (i.e. R 2 = −0.86, P < 0.05) than for NEL3x−48h (i.e. R 2 = −0.73, P < 0.05). In our condition, the high coefficients of determination supported the idea that the FS resulting from the PCA of the complete database was able to differentiate between and within forage classes. Lower coefficients of determination and higher regression bias were observed when the number of variables was reduced.
When relationships between FS and NEL evaluations were ascertained within populations (i.e. corn silage, alfalfa hay and grasses), coefficients of determination from 0.54 to 0.89 were measured (P < 0.05). However, coefficients of determination of 0.37 and 0.45 (P < 0.05) were calculated between NEL3x-48 h and FS in grasses and corn silage populations, respectively. A possible explanation could be related to the reduced number of samples and the close range of variation of measurements, as well as the variability measured in 48 h dNDF.
The results obtained through the PCA on the current database confirmed that the use of biological measurement other than chemical parameters could be useful to better discriminate between poor- and high-quality forages (Givens et al., Reference Givens, Everington and Adamson1989; De Boever et al., Reference De Boever, Cottyn, De Brabander, Vanacker and Boucqué1996; Weiss, Reference Weiss1998). In our experimental condition, the use of iNDF, instead of other biological measurements (i.e. 12, 24, 48 dNDF or kd), was critical for forage characterisation, suggesting that the extent of fibre digestion is useful for characterising forage quality (Mertens, Reference Mertens1993a; Weiss, Reference Weiss1998). However, the methods currently adopted to measure iNDF (i.e. 288 h of rumen incubation) are troublesome and rely on the use of fistulated animals (Krämer et al., Reference Krämer, Weisbjerg, Lund, Jensen and Pedersen2012). Other methodological approaches, such as in vitro enzymatic or gas production techniques, could represent valid and attractive alternatives to the in situ determination of iNDF (De Boever et al., Reference De Boever, Cottyn, De Brabander, Vanacker and Boucqué1996; Aguiar et al., Reference Aguiar, Tedeschi, Rouquette, McCuistion, Ortega-Santos, Anderson, DeLaney and Moore2011). Alternatively, the development of a specific near-infrared spectroscopy (NIRS) calibration curve could be used to predict the iNDF of forages (Krämer et al., Reference Krämer, Weisbjerg, Lund, Jensen and Pedersen2012). In particular, NIRS measurements have been successfully used to predict fibre digestibility, iNDF, energy content and voluntary intake of forages (De Boever et al., Reference De Boever, Cottyn, De Brabander, Vanacker and Boucqué1996; Lundberg et al., Reference Lundberg, Hoffman, Bauman and Berzaghi2004; Andueza et al., Reference Andueza, Picard, Jestin, Andrieu and Baumont2011; Krämer et al., Reference Krämer, Weisbjerg, Lund, Jensen and Pedersen2012).
In conclusion, the PCA applied on the current data set allowed for the detection of three latent constructs associated with tested forages, such as chemical components (i.e. protein fractions, EE and lignin), carbohydrate and their indigestible fraction or NDF digestibility. Furthermore, this approach allowed for a development of a synthetic FS on the basis of a reduced number of variables (i.e. ash, starch, NDF and iNDF) capable of differentiating between high- and poor-quality forage both among and within forage populations. However, the findings obtained through PCA analysis should be reproduced over a larger database collected over a wider range of years to confirm actual observation.
Acknowledgements
The authors thank Sara Bruschi for her invaluable help in laboratory analysis. Financial support was provided by the AGROSCENARI project ‘Scenari di adattamento dell'agricoltura italiana ai cambiamenti climatici’ of MIPAAF (Ministero delle politiche agricole alimentari e forestali – Italy) and by the PRIN project no. 2007P8JMWJ of MIUR (Ministry of Education, University and Research – Italy).
Supplementary materials
For supplementary material referred to in this article, please visit http://dx.doi.org/doi:10.1017/S1751731112002467