INTRODUCTION
Current knowledge of Quaternary glacial onset, extent, and associated climatic parameters on remote subantarctic islands and in the wider Southern Ocean is poorly constrained, primarily because data collection in this mostly unpopulated and harsh environment is logistically difficult. A better understanding of past climatic changes, particularly from the Pliocene to the present, is needed for paleoclimate reconstructions that are used as input to projections for global climate systems and ice sheet distributions (Lamy et al., Reference Lamy, Kilian, Arz, Francois, Kaiser, Prange and Steinke2010; Hodgson et al., Reference Hodgson, Graham, Roberts, Bentley, Cofaigh, Verleyen, Vyverman, Jomelli, Favier and Brunstein2014). Descriptions, interpretations, and classifications of glaciated landforms such as fjords and buried incised valleys (Piper et al., Reference Piper, Letson, De Iure and Barrie1983; Huuse and Lykke-Andersen, Reference Huuse and Lykke-Andersen2000; Kluiving et al., Reference Kluiving, Bosch, Ebbing, Mesdag and Westerhoff2003; Praeg, Reference Praeg2003; Ahmad et al., Reference Ahmad, Schmitt, Rokosh and Pawlowicz2009; Hjelstuen et al., Reference Hjelstuen, Haflidason, Sejrup and Lyså2009; Jordan, Reference Jordan2010; Stewart et al., Reference Stewart, Lonergan and Hampson2013), which are based on Northern Hemisphere observations, can equally be used to inform research in the Southern Hemisphere. Although the combined volume of subantarctic and maritime glacial ice during the last glacial maximum (LGM) is insignificant in relation to global ice mass, subantarctic and maritime ice masses are quick to respond to rapid regional warming (Gordon et al., Reference Gordon, Haynes and Hubbard2008; Cook et al., Reference Cook, Poncet, Cooper, Herbert and Christie2010). They provide a sensitive indicator of the link between Southern Hemisphere climate and ice sheet stability (Hodgson et al., Reference Hodgson, Graham, Roberts, Bentley, Cofaigh, Verleyen, Vyverman, Jomelli, Favier and Brunstein2014).
At subantarctic latitudes, prevailing westerly winds, highly variable weather, and violent storms are the norm. Islands in the Southern Ocean are distinguished by their sparse and isolated nature. These islands are governed by intense oceanic climates that are tightly coupled with the Southern Hemisphere westerly wind belt (SHWW) between 35° and 60°S (De Lisle, Reference De Lisle1965; McGlone et al., Reference McGlone, Wilmshurst and Wiser2000; Varma et al., Reference Varma, Prange, Merkel, Kleinen, Lohmann, Pfeiffer, Renssen, Wagner, Wagner and Schulz2012). Deep water up-welling in the Southern Ocean, driven by the westerlies, exerts a critical influence on global ocean circulation and global climate through the subsequent release or drawdown of CO2 (Toggweiler and Samuels, Reference Toggweiler and Samuels1995; Rahmstorf and England, Reference Rahmstorf and England1997). Due to this oceanic-atmospheric relationship, subantarctic islands are among the first to be affected by regional warming and climate fluctuations (Gordon et al., Reference Gordon, Haynes and Hubbard2008; Cook et al., Reference Cook, Poncet, Cooper, Herbert and Christie2010), thereby providing geological archives of Southern Ocean climate fluctuations at these latitudes.
Geophysical investigations of sedimentary records near these islands contribute to answering questions about local and global glaciation and deglaciation history, relative climate pacing, and terrestrial habitats during glacial periods. Incised paleovalley systems imaged by such data can provide detailed archives of ancient depositional environments, climate, and sea-level change in coastal regions (Dalrymple et al., Reference Dalrymple, Boyd, Zaitlin, Dalrymple, Boyd and Zaitlin1994). Hodgson et al. (Reference Hodgson, Graham, Roberts, Bentley, Cofaigh, Verleyen, Vyverman, Jomelli, Favier and Brunstein2014) endeavoured to constrain the extent and timing of the LGM at numerous subantarctic localities using terrestrial and submarine evidence to provide localised constraints on ice sheet reconstructions. They proposed a six-category classification scheme for subantarctic and maritime Antarctic islands based on ice extent at the LGM, glacial history, and climate and topographic components that influence ice behaviour (Fig. 1). Their work revealed a lack of constraints on subantarctic glaciation. Specifically highlighted was the need for more geophysical and sedimentological investigations to facilitate imagery and dating of submarine glacial features.
(color online) Auckland Islands location in the Southern Ocean. Oceanic fronts labelled with colored lines. Subantarctic and maritime Antarctic Islands classifications from Hodgson et al. (Reference Hodgson, Graham, Roberts, Bentley, Cofaigh, Verleyen, Vyverman, Jomelli, Favier and Brunstein2014) are: Type I, islands that accumulated little or no LGM ice; Type II, islands with a limited LGM ice extent but evidence of extensive earlier continental shelf glaciations; Type III, seamounts and volcanoes unlikely to have accumulated significant LGM ice cover; Type IV, islands on shallow shelves with both terrestrial and submarine evidence of LGM (and/or earlier) ice expansion; Type V, islands north of the Antarctic Polar Front with terrestrial evidence of LGM ice expansion; and Type VI, islands with no data.

In this paper, we map a system of branching, incised valleys on the eastern shelf of the Auckland Islands. At this location, we observe regionally interpretable stratigraphic sequences in subsurface data, with little or no seafloor expression. The value of these incised and subsequently infilled valleys is their potential to provide high-resolution records of climate and sea-level change. Our data allow for detailed interpretations of late Quaternary glaciation, sedimentary processes, and associated paleoclimate parameters by examining the changes in morphology of the eastern coastal region of the Auckland Islands through the last glacial cycle. Results will inform future sampling expeditions.
Auckland Islands setting
The Auckland Islands (51°44′S, 166°06′E) are located around 465 km south of New Zealand's South Island (Fig. 1 and 2), on the western margin of the Campbell Plateau – an expansive region of thinned continental crust with a basement of plutonic granitoid intrusions and low-grade quartzose metasedimentary rocks (Adams, Reference Adams1962; Denison and Coombs, Reference Denison and Coombs1977; Beggs et al., Reference Beggs, Challis and Cook1990; Quilty, Reference Quilty2007). This windswept, uninhabited island group, including the largest of New Zealand's subantarctic islands, is made up of the eroded remnants of two Miocene shield volcanoes with an emergent landmass of about 625 km2 that erupted onto granitic continental basement and Cenozoic sedimentary units, and were then subsequently excavated by marine, fluvial, and glacial erosion (Gamble and Adams, Reference Gamble and Adams1985; Ritchie and Turnbull, Reference Ritchie and Turnbull1985; Scott and Turnbull, Reference Scott and Turnbull2019). Carnley Harbour Volcano to the south is dated between 37 and 19 Ma (Hoernle et al., Reference Hoernle, White, van den Bogaard, Hauff, Coombs, Werner, Timm, Garbe-Schönberg, Reay and Cooper2006), while the younger Ross Volcano to the northwest has flows dated between 19.2 and 15.7 Ma (Denison and Coombs, Reference Denison and Coombs1977).
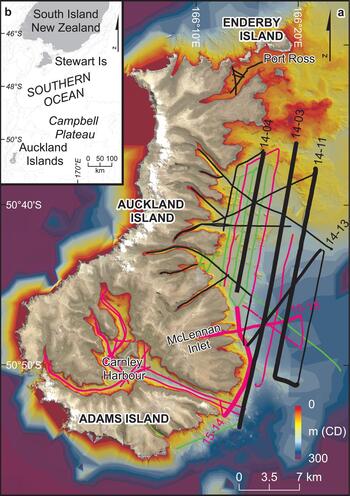
(a) Auckland Islands data coverage. (b) Inset location map shows location relative to New Zealand. Seismic lines are color-coded by year of collection (black, 2014; pink, 2015; green, 2016). Bold named lines are discussed in this manuscript. Aerial photo of islands (Kiwimage, see Acknowledgments) is merged with bathymetric data from the local shelf (LINZ, see Acknowledgments). Higher-quality modern multibeam depth data along the east coast show detailed features in the bathymetry while older, sparse, low-quality data give only a general indication the seabed terrain elsewhere. (For interpretation of the references to color in this figure legend, the reader is referred to the web version of this article.)

The western flank of the islands has been subjected to persistent westerly winds and surface ocean currents with ongoing erosion forming continuous cliffs several hundred metres high. In contrast, the leeward eastern side of the islands preserves numerous terrestrial glacial features, first reported by Speight and Finlayson (Reference Speight and Finlayson1909). Imposing, deeply cut U-shaped valleys, fjords, and inlets that mostly trend west to east dominate the eastern side of the islands, suggestive of extensive Pleistocene glaciation spreading radially from the two volcanic centres (Hodgson et al., Reference Hodgson, Graham, Roberts, Bentley, Cofaigh, Verleyen, Vyverman, Jomelli, Favier and Brunstein2014; Quilty, Reference Quilty2007). Limited observations are available to constrain timing of glacial periods on the island; however, the extent of ice during the last glacial period (80–18 ka) was probably minimal (McGlone et al., Reference McGlone, Wilmshurst and Wiser2000; McGlone, Reference McGlone2002; Rainsley et al., Reference Rainsley, Turney, Golledge, Wilmshurst, McGlone, Hogg and Li2019). The islands were classified “Type V” by Hodgson et al. (Reference Hodgson, Graham, Roberts, Bentley, Cofaigh, Verleyen, Vyverman, Jomelli, Favier and Brunstein2014), i.e., islands north of the Antarctic Polar Front with terrestrial evidence of LGM ice expansion. Hanging valleys, moraine-dammed lakes (such as Hinemoa and Tutanekai), and high-altitude cirques are prevalent features. Additionally, the leeward east coast of the islands abuts a relatively wide shelf that preserves a stratigraphic record of Quaternary depositional environments. This distinctive seafloor geological record makes the Auckland Islands ideal for constraining paleoclimate and ice extent at mid-high southern latitudes during the Quaternary.
The Auckland Islands lie within the transition from the relatively warm waters of the Subtropical Convergence in the north to the cooler waters of the Antarctic Convergence in the south and are subjected to a year-round extreme oceanic climate (Fig. 1). This zone between oceanic fronts creates large, mid-latitude atmospheric depressions that form every five to six days (Streten, Reference Streten1988), resulting in incessant westerly wind flows, heavy seas, and moderate to high precipitation with over 300 days of rain expected per annum (De Lisle, Reference De Lisle1965). The position and intensity of the wind belt varies over a range of timescales (Varma et al., Reference Varma, Prange, Merkel, Kleinen, Lohmann, Pfeiffer, Renssen, Wagner, Wagner and Schulz2012; Browne et al., Reference Browne, Moy, Riesselman, Neil, Curtin, Gorman and Wilson2017). During the winter, the wind belt extends northward with decreasing wind intensities at the core, whereas during summer the belt contracts and the core wind intensifies. These variations are a function of changing sea-surface temperatures (SSTs) between seasons (Lamy et al., Reference Lamy, Kilian, Arz, Francois, Kaiser, Prange and Steinke2010). Over longer timescales (multi-centennial to glacial-interglacial), shifts are observed in both wind speed and precipitation (Markgraf et al., Reference Markgraf, Dodson, Kershaw, McGlone and Nicholls1992; Lamy et al., Reference Lamy, Hebbeln, Röhl and Wefer2001; Lamy et al., Reference Lamy, Kilian, Arz, Francois, Kaiser, Prange and Steinke2010). These long-term changes have primarily been influenced by changes in incoming solar radiation related to variability in the orbital cycles of the Earth around the Sun (Milankovitch, Reference Milankovitch1941). Marine sediment cores from the Campbell Plateau and Campbell Rise show a rising trend in SSTs from 18–11 ka (Fenner et al., Reference Fenner, Carter and Stewart1992; Weaver et al., Reference Weaver, Carter and Neil1998; Nelson et al., Reference Nelson, Hendy, Neil, Hendy and Weaver2000; McGlone, Reference McGlone2002). SSTs in the Southern Hemisphere during the LGM were several degrees lower than present-day with the Subantarctic Front extending at least 5° northwards, although still south of the Auckland Islands (Nelson et al., Reference Nelson, Cooke, Hendy and Cuthbertson1993; Nelson et al., Reference Nelson, Hendy, Neil, Hendy and Weaver2000). Sea ice extending from expanded Antarctic ice sheets was in close proximity to the island group (Fraser et al., Reference Fraser, Nikula, Spencer and Waters2009).
Extensive but incomplete Pleistocene glaciation in the Auckland Islands has been postulated (Fleming et al., Reference Fleming, Mildenhall and Moar1976; McGlone, Reference McGlone2002; Quilty, Reference Quilty2007) to feature radial drainage patterns centred around the former Oligocene/Miocene shield volcanoes (Hodgson et al., Reference Hodgson, Graham, Roberts, Bentley, Cofaigh, Verleyen, Vyverman, Jomelli, Favier and Brunstein2014). However, the extent of the emergent landmass and ice cover, the timing of de-glaciations during the Quaternary, and the role of tectonic uplift or subsidence (Summerhayes, Reference Summerhayes1967), remain poorly constrained. Geomorphological modelling tied to a number of terrestrial datasets suggests that ice cover during the last glacial period was minimal (Rainsley et al., Reference Rainsley, Turney, Golledge, Wilmshurst, McGlone, Hogg and Li2019). That said, peak LGM ice extent on the Auckland Islands is interpreted between 26.5 and 19 ka. Minimum deglaciation timing from radiocarbon dates in the north of Auckland Island at ~18.5 ka correlates with glacial retreat on mainland New Zealand (Suggate, Reference Suggate1990; McGlone, Reference McGlone2002). This 7500-yr interval (26.5–19 ka) correlates with the last global sea-level low stand (Clark et al., Reference Clark, Dyke, Shakun, Carlson, Clark, Wohlfarth, Mitrovica, Hostetler and McCabe2009).
Offshore constraints including glacial geomorphology, assessments of previously exposed low-stand landmasses, and glacial/postglacial sedimentary sequences are now required to advance our understanding of glacial history at the Auckland Islands. Assessments of the infill stratigraphy in the fjords and offshore buried valley systems can lead to the development of high-resolution records of depositional environments and past sea-level elevations. Such records are critical for understanding climate and glacial cycling in the Southern Hemisphere during the Quaternary, as well as assessing global responses to modern-day climate fluctuations (Bergstrom and Chown, Reference Bergstrom and Chown1999; McGlone et al., Reference McGlone, Wilmshurst and Wiser2000; McGlone, Reference McGlone2002; Hodgson et al., Reference Hodgson, Graham, Roberts, Bentley, Cofaigh, Verleyen, Vyverman, Jomelli, Favier and Brunstein2014). Interpreting the glacial history of the Auckland Islands is a critical step for resolving subantarctic and wider Southern Ocean climate dynamics on glacial/interglacial timescales.
Marine geophysical investigations of the Auckland Islands
Prior to the work reported here, there were no submarine constraints on Quaternary glaciation in the Auckland Islands. Geomorphologic seabed analysis undertaken by Tidey and Hulbe (Reference Tidey and Hulbe2018) indicated many surficial areas of interest that would benefit from complementary sub-seabed investigations.
In contrast to seismic imaging at corresponding Northern Hemisphere latitudes (e.g., Farmer and Freeland, Reference Farmer and Freeland1983), geophysical data in the Southern Hemisphere, especially at maritime and subantarctic localities, are sparse. Prior to 2014, topographic and bathymetric data in the Auckland Islands were compiled from low-resolution, low-accuracy elevation models and sparse depth soundings. For example, Chart NZ 2862 (Land Information New Zealand [LINZ]/New Zealand Hydrographic Authority, 2005) contains no depth data in some fjords and inlets (e.g., Chambres, Granger, McLennan, and Deep inlets and Fly Harbour). The charted offshore bathymetry showed a gentle descent on the eastern shelf towards the shelf break, which contrasts starkly with the highly varied, incised topography of the exposed Auckland Islands landmass. Our new data contribute to a limited, but growing, number of offshore seismic investigations of this nature in the subantarctic (e.g., Hodgson et al., Reference Hodgson, Graham, Roberts, Bentley, Cofaigh, Verleyen, Vyverman, Jomelli, Favier and Brunstein2014).
Three recent expeditions to the eastern shelf and fjords of the Auckland Islands have collected high-frequency seismic reflection data to complement seafloor coring from the University of Otago's research vessel Polaris II. These data provide a means to image subsurface bedrock morphologies and associated stratigraphic infill deposits. The transects (totalling over 1200 km in length), have focussed on characterising isolated fjord basins along the east coast of Auckland and Adams islands (Figure 2). The first of the expeditions, 14PL001, in 2014 identified an extensive system of incised and infilled valleys extending at least 15 km from the modern-day shoreline out onto the eastern shelf. The characterisation of this paleovalley system was supplemented by additional surveying during expeditions 15PL001 and 16PL119 in 2015 and 2016. Bathymetric data complement the subsurface seismic component of this work through identification and correlation of topographical features on the seafloor. The use of such data is now standard practise for characterising localities that were recently glaciated, inferring previous glacial flow extents and processes based on glacial geomorphology and textural seabed attributes. High-resolution multibeam bathymetric maps over large areas of the seafloor in several subantarctic localities have been effectively used to evaluate ice extent and associated processes using geomorphological evidence (Graham et al., Reference Graham, Fretwell, Larter, Hodgson, Wilson, Tate and Morris2008; Hodgson et al., Reference Hodgson, Graham, Roberts, Bentley, Cofaigh, Verleyen, Vyverman, Jomelli, Favier and Brunstein2014; Tidey and Hulbe, Reference Tidey and Hulbe2018).
METHODS
Seismic data acquisition and processing
In total, 26 offshore transects running mostly parallel to the eastern coastline were collected with a 1.5–2 km spacing. These were tied with 12 seismic lines perpendicular to the coast, extending out from the fjords. Transects within the fjords had spacings ranging from roughly 100 m to 1 km in wider inlets. We used a Ferranti electroacoustic “boomer” source (with a central frequency of ~300 Hz) and a Geometrics 24-channel MicroEel hydrophone array with a 75-m-long active section, linked to Geometrics acquisition software and shipboard Global Navigation Satellite System (GNSS) hardware. The boomer was set to trigger at 3.10 s, with an approximate collection speed of 4 knots and a hydrophone array separation of 3.125 m.
Processing of the seismic data was undertaken using the GLOBE Claritas analysis package (Ravens, Reference Ravens2001). SEG-D formatted field data were converted to the industry-standard SEG-Y format (Barry et al., Reference Barry, Cavers and Kneale1975) and merged with GNSS positional information. The data were sorted into common midpoint (CMP) gathers with a CMP spacing of 3.125 m, resulting in a nominal fold of 12 for all seismic lines. CMP binning was applied by defining the geometrical configuration of the towed seismic equipment and the onboard GNSS antenna. Course corrections and sea state regularly resulted in slight changes to this geometry including feathering of the hydrophone streamer and drifting of the boomer source position. The offsets between the source and the receivers were adjusted to account for these changes. To accomplish this, the direct water-wave arrival time at each receiver was measured for each shot, then the velocity of sound in water (set to be 1500 m/s) was used to determine the offset distance between the source and each receiver (Crutchley et al., Reference Crutchley, Berndt, Klaeschen and Masson2011). This correction greatly improved the quality of stacked images.
A 100-200-1000-1250 Hz trapezoidal bandpass filter was applied followed by the application of automatic gain with a sliding 200 ms window. Velocity analysis was undertaken primarily using a combination of common velocity stacks and common velocity gathers to modify an initially constant 1500 m/s model. These laterally varying velocities were then used to correct the CMP gathers for normal moveout; data segments with more than 70% stretch were muted, and the gathers were stacked. Finally, the stacking velocity functions were converted to interval velocities using the Dix equation at 5 m/s intervals, smoothed and used to migrate the stacked sections using a finite-difference migration routine.
Bathymetric data
High-resolution multibeam bathymetric data were collected with a Kongsberg EM2040C along the eastern coast and fjords of the Auckland Islands for LINZ in 2014 and 2015. Originally collected as multiple-use datasets for nautical chart updates and New Zealand Department of Conservation research purposes, the datasets are now publicly available (see Acknowledgments).
Data integration
Data were imported into Leapfrog Geo and Arc GIS ArcMap for 3-D seismic and bathymetric modelling and visualisation of the eastern fjords, offshore shelf, and buried fjord system. Depth conversions for seismic interpretations in this paper have been calculated assuming water velocities of 1500 m/s and sediment velocities of 1630 m/s.
Observations and Interpretations
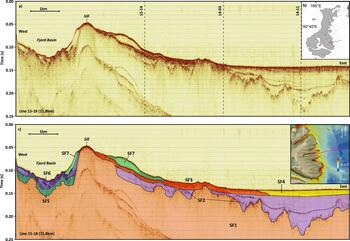
To provide a basis for a stratigraphic interpretation, we identify seismic facies expressed in McLennan Inlet and elsewhere on the eastern shelf of the Auckland Islands (Fig. 2 and 3). McLennan Inlet is the deepest coastal inlet in the Auckland Islands. It exhibits a classic fjord profile with a shallow (~38 m deep) entrance sill on the seaward side of the fjord, progressing into an extensive back basin with a maximum depth of >100 m. It stretches 4.4 km in an east-west orientation and is ~500 m wide. At the head of this steep-sided fjord, two hanging valleys feed the main valley (Fig. 3d). In Figure 3 we use the extensive basin and clearly defined sill of McLennan Inlet to demonstrate our eastern shelf seismic interpretation. In most seismic lines, the present-day seafloor can be readily interpreted as a strong continuous reflection. The multibeam bathymetry shows smooth regions where sediment has accumulated and rougher areas where the seafloor is rocky. Below sediment-covered parts of the seafloor, laterally continuous reflections are observed from within sedimentary packages, often with considerable detail that can provide a basis for interpretations of sediment accumulation history. At the base of these sedimentary packages, strong but discontinuous reflections are interpreted to correspond to the top of basement rocks with limited internal reflectivity.
(color online) Line 15-18: McLennan Inlet and Eastern Shelf transect (11.8 km). This transect transitions from a fjord setting in the west to a shelf setting in the east, resulting in a wide range of observable facies. (a) Unannotated seismic reflection data with dashed lines showing intersections of transects in Figure 4. (b) Location of transect. (c) Annotated line with seismic facies allocation based on seismic data variations (see text for descriptions; dashed line within SF2 corresponds to LGM erosion surface). (d) Transect on bathymetry.

Line 15-18 originates at the head of McLennan Inlet (Fig. 2 and 3) and extends over 11.8 km east onto the shelf. Seven seismic facies have been defined along the line that vary spatially and that can be separated into two distinct environments: an enclosed fjord basin and a seaward facing shelf (Fig. 3). Seismic facies 1 (SF1) is presumed to correspond to the volcanic basement of the Auckland Islands. Deep depressions within the body of the fjord are shown, particularly seaward where the top of SF1 is observed as deep as 185 m below modern sea level. Overlying SF1, SF2 is a semi-transparent, unconformable facies with laterally continuous, draped internal reflections. Some horizons are well-defined and are present over several kilometres, extending oceanward of the sill. SF3 and SF4 overlie SF2 seaward of the entrance sills. SF3 is closer to shore and exhibits strong internally parallel reflections. SF4 occurs further offshore where it appears to be incised into the underlying SF2 (and SF3) units; internal reflections within SF4 onlap onto an underlying truncated surface. Inside McLennan Inlet, SF5 sits unconformably over SF1, but the basement–sediment interface is poorly imaged here. Much of SF5 is chaotic and unstructured, but some semi-continuous reflections are observed. SF6 is defined by semi-transparent stratigraphic packages, with some weak continuous internal reflections. SF7 is a distinct unit that appears to drape over the underlying units at the top of the entrance sill where it forms the present-day seafloor in places.
Extending offshore from McLennan Inlet, three coast-parallel (north-south oriented) seismic lines tie McLennan Inlet line 15-18 and provide cross sectional views of the paleovalley system (Fig. 4). Running roughly 1 km offshore, line 15-14 (Fig. 4a), shows the offshore paleovalley continuations of three fjords: Waterfall, McLennan, and Worth inlets. The seismic data suggest that the valleys are each incised into bedrock (SF1) along this transect and contain up to 70 m of sediments (SF2, SF3, and SF4). A modern 20- to 30-m-thick drift deposit (SF7) is observed centred on the McLennan Inlet paleovalley; this sediment drift is also observed in line 15-18 (Fig. 3). Roughly 3.5 km offshore, line 14-03 (Fig. 4c) crosses the same three paleovalleys, showing a progression towards deeper, more irregularly eroded bedrock surfaces with well-defined internal reflections within the stratigraphic package (SF2). Along this seismic line, the basement ridges between the paleovalleys are buried by the modern shelf. The infill sequences and basement ridges are overlain by a regular, laterally continuous package (SF3). Roughly 6.5 km offshore, Line 14-11 (Fig. 4d) shows an irregularly eroded basement surface, but the general pattern consisting of three main paleovalleys separated by basement ridges can still be interpreted. The seismic data show that the basement ridges are buried by older sediments (SF2) that are observed to drape over the sides of the paleovalleys, indicating a low-energy depositional setting similar to what might be seen in a lake or flooded isolated embayment. These offshore infill sequences (SF2) are also overlain by a regular, laterally continuous package (SF4).
(color online) Excerpts from shore-parallel seismic lines: inshore to offshore. These lines demonstrate the relationship between valley morphology and proximity to the coast, and highlight the difficulty in following the thalweg of a particular paleochannel with this dataset. Seismic facies as defined in text; LGM erosion surface. (a) 15-14. (b) Location of lines color-coded by year of acquisition. (c) 14-03. (d) 14-11. These three lines intersect McLennan Inlet line (15-18 in Figure 3, dashed intersection with each line is shown).

In addition to the erosional unconformity that marks the base of the channels incised into the basement units (i.e., the top of SF1), there is evidence within SF2 of other regional unconformities. These are marked by reflective horizons, which may erosively truncate underlying strata or be overlain by onlapping reflections. In particular, note the distinct widespread reflection that cuts through the middle of SF2 in Figures 3 and 4 with a maximum depth of 190 ms (~140 m below sea level). The depth and widespread occurrence of this surface suggest that it is the LGM erosion surface, and that the sediments above it have been deposited during the transgression that has occurred since the LGM.
Interpretation of the seismic data has been extended out to all available lines on the eastern shelf to map paleochannel topography. This provides some constraints in assessing low-stand drainage patterns in the region (Fig. 5). The sediment–bedrock interface is observed to deepen progressively to the south and southeast, which correlates with the absence of clear seismic evidence of valleys in the north. Central and southern shelf drainage models show that the majority of incised valleys flowed southeast, probably into the Carnley Sea Valley. Tracking continuous thalwegs within this dataset is difficult due to the highly irregular, possibly anastomosing nature of the buried valleys and spatial spread of the seismic lines. However, the interpretation provides an indicative regional view of the ancient flow paths in the main erosional channels. Seismic lines 14-03, 14-04, and 14-13 are shown here with a map of the interpreted positions of low-stand thalwegs that have subsequently been infilled (Fig. 5).
(color online) (a) Eastern shelf paleochannel interpretation from entire dataset. Incised valley directions are based on seismic data and seafloor bathymetry: thick, dashed lines represent likely main valley flow, while thinner, dashed lines show probable smaller channels. Shown with Auckland Islands terrestrial contours (20 m), seafloor bathymetry, and select seismic lines. (b–d) Eastern-shelf seismic transects showing buried valleys: (b) 14-04; (c) 14-03; and (d) 14-13.

DISCUSSION
History of erosion and sedimentation in the Auckland Islands paleovalley system
The incised valley morphologies imaged on the eastern shelf of the Auckland Islands suggest an origin that extends back through multiple glacial cycles in the Quaternary. Glacial features observed above sea level on the modern landmass of the Auckland Islands (e.g., cirques, U-shaped valleys, and fjords; Fig. 1) suggest that glacial periods earlier in the Pleistocene must have been more widespread than during the LGM. Ice caps centred at high-elevations above the present-day locations of Carnley Harbour and Disappointment Island (Quilty, Reference Quilty2007) would have sourced erosive glaciers that carved valleys on the sides of the ancient volcanoes. Over multiple glacial periods, much of the original volcanic mass of the islands was transported downhill by glacial and fluvial transport processes. At lower elevations and greater distances from the mountain capping glaciers, valley incision continued through fluvial processes. This change in the style of erosion (from broadly U-shaped, smooth glacial to multiple-channelled, more V-shaped fluvial) manifests in an increased ruggedness of the basal erosional surface with offshore distance (Fig. 4 and 5).
The configuration and architecture of the incised channels imaged here (Fig. 5) suggests that the region was repeatedly eroded by glaciofluvial and fluvial forcing during deglaciation phases. This is consistent with experimental studies undertaken by Shepherd and Schumm (Reference Shepherd and Schumm1974), which modelled fluvial incision into simulated bedrock. Our seismic evidence shows that this continues to depths at least as great as 185 m below modern sea level (e.g., Fig. 3 and 4)—considerably lower than expected LGM low-stand sea levels of ~125 m below modern sea level (Lambeck and Chappell, Reference Lambeck and Chappell2001). Although evidence of earlier glacial periods will have been overprinted by subsequent ice advances, sediments deposited in the deepest distal parts of offshore paleovalleys may contain archives of multiple glacial periods.
Periods of glacial retreat at the Auckland Islands would have resulted in the incised valleys (Fig. 4 and 5) becoming glacial sluiceways that were eroded by fluvial processes and gravity flows as ice masses on the islands melted and then accumulated sediment as sea level rose. Schumm and Ethridge (Reference Schumm, Ethridge, Dalrymple, Boyd and Zaitlin1994) explain the evolution of an incised valley from initial channel incision through to widening by lateral migration and valley wall failure, and subsequent flooding and sedimentary infill. As sea levels rose during interglacial periods, eroded valleys would progress to either enclosed lakes or fjords, and then to paleolakes or paleofjords as sediments filled in the basins. Sediments deposited in lakes or fjords are interpreted within the paleovalleys imaged by the seismic data (SF2 in Fig. 3 and 4).
The widespread, draped, infilled stratigraphic patterns (SF2) observed overlying eroded bedrock (SF1) within the seismic data (Fig. 3 and 4) are consistent with lake and fjord depositional environments (Syvitski et al., Reference Syvitski, Burrell and Skei1987). However due to the complexity and irregularity of incised valley systems (Schumm and Ethridge, Reference Schumm, Ethridge, Dalrymple, Boyd and Zaitlin1994; Zaitlin et al., Reference Zaitlin, Dalrymple, Boyd, Dalrymple, Boyd and Zaitlin1994), it is difficult to differentiate a lacustrine (requiring isolation of the system from the ocean) from a quiet marginal marine/brackish setting (in communication with the ocean) in the 2-D seismic images. These draped sequences are stratigraphically punctuated by strong, laterally continuous reflections that onlap onto bedrock valley walls and/or underlying sediments as part of postglacial transgressive phases (e.g., strong reflections within SF2 in Fig. 3 and 4). As mentioned previously, these reflections are interpreted to be regional unconformities that represent periods of limited erosion or non-deposition during low stands that enabled the preservation of sedimentary strata deposited during earlier depositional periods. The shallowest of these distinct, regional unconformity reflections is interpreted to correspond to the LGM erosion surface (Fig. 3 and 4).
Close inspection of the seismic data in Figures 3 to 5 shows that several erosional surfaces can be interpreted within the channel infill strata over scales >1 km. This suggests that a number of transgressive/regressive cycles have occurred during the infill of the channels. The erosional surfaces are succeeded by further draped reflections (e.g., strong reflections within SF2 in Fig. 3 and 4) representing multiple sedimentation events and suggesting multiple transgressions of sea level along this section of coast. The sedimentary response to alternating periods of aggradation and erosion is known to produce abrupt lateral and vertical facies changes where younger units occupy channels eroded into older facies (Zaitlin et al., Reference Zaitlin, Dalrymple, Boyd, Dalrymple, Boyd and Zaitlin1994). There is no direct evidence within the incised valley stratigraphy of re-advancing glacial ice (i.e., repeat erosive events). However, this does not preclude advancing ice events at higher elevations.
Seismic facies 3 and 4 (SF3 and SF4; Fig. 3 and 4) differ from the underlying sequences by being dominated by mostly horizontal reflections. This suggests that the deposition of these layers occurred in a higher-energy environment. Although widespread, these seismic facies are limited to the shallowest part of the paleovalley fill and appear to have a thickness of <10 m. Their widespread nature, spanning multiple paleovalley basins, suggests that they were laid down in a more open, probably marine, setting.
A general deepening in maximum paleovalley depth is observed to the southeast, roughly in alignment with present-day bathymetry (Fig. 5). There is a general absence of incised valleys in northern sectors of the seismic data which contrasts with valleys observed on more distal transects in the south. The south-southeast valley trajectory aligns with the Carnley Sea Valley to the south (Fig. 5), into which the majority of the incised valleys probably drain. Even though the eastern shelf has a high data density, the spatial sampling of the highly irregular, anastomosing, incised valleys is insufficient for detailed 3-D mapping. However, the thalwegs (localised maximum depths) of channels can be linked to propose a reasonable drainage pattern for the region (Fig. 5).
LGM ice extent on the Auckland Islands
Early reconnaissance of terrestrial glacial features suggested that the Auckland Islands were extensively glaciated during the last glacial period with coastal fjords being ice-filled (Wright, Reference Wright1967; Fleming et al., Reference Fleming, Mildenhall and Moar1976; Quilty, Reference Quilty2007). However, glacial ice at the LGM at the Auckland Islands was almost certainly confined to the footprints of previous glaciations and was far less extensive than the earlier ice advances that formed the fjords. We found no seafloor evidence of glacial advances during the LGM beyond the confines of the fjord basins. That said, the presence of ice within the fjord basins at the LGM is supported by limited seafloor moraine deposits and low volumes of sedimentation relative to what would be expected if there had been no fjord ice advance during this period. For example, some fjord basins (e.g., McLennan Inlet; Fig. 3) reach >100 m water depth with <25 m of sediment (SF5 and SF6) overlying bedrock, and most of that being interpreted as Holocene sedimentation (SF6). If ice had not been present in this fjord during the LGM, we surmise that sedimentary infill would have been greater (cf. Dlabola et al., Reference Dlabola, Wilson, Gorman, Riesselman and Moy2015). This evidence allows us to reclassify the Auckland Islands as Type IV subantarctic islands—islands on shallow shelves with both terrestrial and marine evidence of LGM (and/or earlier) ice expansion (Hodgson et al., Reference Hodgson, Graham, Roberts, Bentley, Cofaigh, Verleyen, Vyverman, Jomelli, Favier and Brunstein2014; Tidey and Hulbe, Reference Tidey and Hulbe2018).
Ice advance and retreat in subantarctic islands can be affected by altitude, temperature, insolation, moisture availability, and terrestrial morphology (Hodgson et al., Reference Hodgson, Graham, Roberts, Bentley, Cofaigh, Verleyen, Vyverman, Jomelli, Favier and Brunstein2014). In comparison to mainland New Zealand, where LGM ice cover was extensive over much of the mountainous areas of the South Island (46–42°S) and particular localities in the North Island (38–40°S; Barrell, Reference Barrell, Ehlers, Gibbard and Hughes2011), the Auckland Islands had limited ice extent during the LGM despite being farther south. This difference mainly results from (1) the topographical control of the glacial equilibrium line altitude required to grow and maintain glacial ice and (2) latitudinal changes in climate (Porter, Reference Porter1975; Hodgson et al., Reference Hodgson, Graham, Roberts, Bentley, Cofaigh, Verleyen, Vyverman, Jomelli, Favier and Brunstein2014; Hoffman et al., Reference Hoffman, Fountain and Liston2016). Other subantarctic islands such as South Georgia (54°S) and the Kerguelen Islands (49°S) also show limited ice expansion at the LGM compared to earlier Pleistocene glaciations (Graham et al., Reference Graham, Fretwell, Larter, Hodgson, Wilson, Tate and Morris2008; Hodgson et al., Reference Hodgson, Graham, Roberts, Bentley, Cofaigh, Verleyen, Vyverman, Jomelli, Favier and Brunstein2014). These islands, all of which are extinct volcanoes, experienced significant erosion during earlier Pleistocene glaciations that resulted in reduced elevations and subdued topographical features that detrimentally affected more recent ice development. Additionally, during the LGM, these islands all experienced moisture deprivation as a result of advancing, proximal sea ice (Bentley et al., Reference Bentley, Evans, Fogwill, Hansom, Sugden and Kubik2007; Fraser et al., Reference Fraser, Nikula, Spencer and Waters2009) and a northward shift in the SHWW with a corresponding drop in moisture supply from subtropical air masses. This subsequently intensified evaporation and sublimation rates at maritime and subantarctic localities.
Due to the highly incised nature of the Auckland Island fjords, there are numerous morphological controls that allowed for the development of paleolakes and the deposition of associated lacustrine sediments during interglacial periods (Fig. 2). All fjords that exhibit over-deepened basins and entrance sills (buried or exposed; e.g., Fly, Hanfield, McLennan, and Norman inlets, Port Ross and Carnley Harbour) would have supported paleolake environments at eustatic sea-level low stands. Terrestrial inputs within these lacustrine deposits provide high-resolution paleoclimate proxies, and are a wider research objective (e.g., Browne et al., Reference Browne, Moy, Riesselman, Neil, Curtin, Gorman and Wilson2017) beyond the scope of this paper. Furthermore, much of the present-day eastern shelf of the Auckland Islands would have been a coastal plain during glacial periods (Fig. 5). As sea levels rose, the incised valleys mapped across this plain would have been inundated, most likely forming coastal sounds. The seismic data suggest that the infilling of these protected sounds would have occurred in a low-energy environment leading to the preservation of well-laminated draping strata.
CONCLUSIONS
The seismic and seafloor bathymetry data collected off the east coast of the Auckland Islands provide a record of multiple cycles of glacially controlled erosion and sedimentation through the Quaternary. Many of the fjords along this coast exhibit classic glaciated profiles with over-deepened back basins that were erosive and ice bearing during the last glacial period. These basins contain thin stratigraphic packages interpreted to have been deposited following the retreat of glaciers at the end of the last glacial period. The basins progress outward to shallow entrance sills with little or no sedimentation (Syvitski et al., Reference Syvitski, Burrell and Skei1987).
However, even though seafloor evidence of LGM ice expansion confirms the Auckland Islands as Type IV subantarctic islands (Hodgson et al., Reference Hodgson, Graham, Roberts, Bentley, Cofaigh, Verleyen, Vyverman, Jomelli, Favier and Brunstein2014), the results presented here are not supportive of an LGM ice advance onto the exposed low-stand eastern shelf of the island group. In contrast, seismic transects collected outside the fjords on the eastern shelf reveal an extensive, intricate, incised valley system that originates from the present-day terrestrial glacial valleys and fjords. The stratigraphy of these offshore flooded valleys contrasts that of the modern fjord systems, with extensive stratigraphic sequences filling the incised valleys on the shelf. Within the infill sediments of the incised valleys, a distinct subhorizontal reflection corresponding to widespread erosion or non-deposition at the LGM is identified. The stratigraphic units imaged beneath the LGM unconformity contain sediments sourced from past glacial periods.
Evaluations of coastal fjords and associated offshore valleys—particularly with regard to the infill stratigraphy controlled by sea-level transgressions—can help to identify locations where lacustrine or estuarine deposits may occur in isolation from open marine processes. Such low-energy deposits, if sampled directly through drilling and coring, can be rich archives of fine terrestrial sediments that provide environmental, climatic, and tectonic records of local and regional changes (e.g., Gierlowski-Kordesch and Kelts, Reference Gierlowski-Kordesch and Kelts2006) that can be used in local and global climate modelling.
ACKNOWLEDGMENTS
We thank the crew of the University of Otago's RV Polaris II (Steve Little, Bill Dixon, Warren Wilson, Evan Kenton, and Steve King) for their efforts in data collection during three cruises to the subantarctic. We also thank numerous other field assistants and students. Hamish Bowman and Bob Dagg provided excellent field and lab technical assistance. Data acquisition on these cruises was funded by the University of Otago and the Sir Peter Blake Trust. Bathymetric data collection was funded by Land Information New Zealand (LINZ). Academic software licences were used for seismic data processing (GLOBE Claritas), seismic interpretation (IHS Markit's Kingdom and Leapfrog Geo), and bathymetric analyses (CARIS HIPS & SIPS 9.0 and Arc GIS 10.3.1). Bathymetric data in this paper are held by LINZ and are licensed for reuse under CC BY 4.0 (contact: customersupport@linz.govt.nz). Aerial photography: Kiwimage, includes copyrighted material of DigitalGlobe, Inc., all rights reserved. Figures created must not be used for navigation. This research did not receive any specific grant from funding agencies in the public, commercial, or not-for-profit sectors.