I. INTRODUCTION
Nanocrystalline (nc) metals having grain sizes less than 100 nm have been found to have unique physical and mechanical properties which, in some cases, are far superior to their coarser-grained counterparts. Due to their small grain size, there exists a large driving force for microstructural coarsening through the removal of the excess grain boundary area. Many face-centered cubic (FCC) metals have been reported to exhibit grain growth temperatures at low temperatures.Reference Ames, Markmann, Karos, Michels, Tschope and Birringer1–Reference Taylor, Omotoso, Wiskel, Mitlin and Burrell5 Pure nanocrystalline nickel (nc Ni), for instance, has been shown to undergo grain growth at temperatures as low as 200 °C.Reference Sharma, Varshney, Bidaye and Chakravartty6 At 420 °C, Hibbard et al.Reference Hibbard, McCrea, Palumbo, Aust and Erb7 reported the rapid coarsening of nc Ni from 20 nm to 60 μm in just 5 days time, and there are numerous reports indicating this low temperature susceptibility to thermally induced coarsening. The collective temperature range for the grain growth onset in nc nickel is 200–400 °C.Reference Sharma, Varshney, Bidaye and Chakravartty6–Reference Thuvander, Abraham, Cerezo and Smith11 This temperature range is too low to exploit the high strength and high-temperature oxidation and corrosion resistance nc Ni is expected to provide. Despite this drawback, it is possible to design a nc microstructure that is more resistant to thermally induced grain growth. In general, the alloying of Ni with a second element has proven useful in reducing the growth rate and/or increasing the grain growth temperature over that of pure, nc Ni. Examples showing a low-to-moderate increase include, nickel-iron (Ni-Fe),Reference Thuvander, Abraham, Cerezo and Smith11–Reference Ebrahimi and Li13 nickel-phosphorus (Ni-P),Reference Kobayashi and Kashikura14–Reference Farber, Cadel, Menand, Schmitz and Kirchheim16 nickel-cobalt (Ni-Co),Reference Hibbard, Aust and Erb17 and nickel-tungsten (Ni-W).Reference Detor and Schuh18 Explanations have attributed the increased stability to the Zener pinning of grain boundaries by precipitated secondary phases and solute segregation effects, such as, solute drag and the thermodynamic reduction of effective grain boundary energy. In this study, we report a dramatic increase in thermally stability for nc Ni. Specifically, nc Ni with a mean grain size below 100 nm was maintained after annealing at 900 °C for 1 h. Additionally, an ultrafine-grained microstructure was maintained at temperatures as high as 1100 °C, representing a homologous temperature of 80% the melting point of pure Ni. Increases in thermal stability of this magnitude have not yet been reported for nc Ni.
II. EXPERIMENTAL PROCEDURES
Based on previous theoretical works by the authors, yttrium (Y) was selected for the purpose of preventing thermally induced grain growth in nc Ni by grain boundary segregation of Y solute.Reference Darling, VanLeeuwen, Semones, Koch, Scattergood, Kecskes and Mathaudhu19, Reference Atwater and Darling20 The concepts for alloy selection in this thermodynamic stabilization approach were reported by the authors and experimentally demonstrated in iron-zirconium (Fe-Zr) prepared by room temperature mechanical alloying. The Fe-Zr system exhibits high stabilityReference Darling, VanLeeuwen, Semones, Koch, Scattergood, Kecskes and Mathaudhu19, Reference Darling, Chan, Wong, Semones, Scattergood and Koch21, Reference Darling, VanLeeuwen, Scattergood and Koch22 and the same was expected for nickel-yttrium (Ni-Y), based on thermodynamic systems stability calculations. In this study, high-energy cryogenic mechanical alloying was used to produce the nanostructured Ni-Y alloyed powders with an average particle size of 50–300 μm. This was accomplished by loading hardened steel vials with the appropriate weights of Ni and Y powders (∼−325 mesh, 98.5–99.95% purity, Alpha Aesar, Ward Hill, MA) to obtain the desired compositions of Ni with 1, 5, and 10 at.% Y. The ball-to-powder mass ratio was maintained at 10:1 for a total powder charge of 5 g. 440C stainless steel balls were used for the milling media. Prior to milling, the vials were sealed in an argon atmosphere (O2< 1 ppm) using a Viton o-ring. Mechanical alloying in a single-vial shaker mill, model No. SPEX 8000M (Metuchen, NJ) was then performed at liquid nitrogen temperatures −196 °C for 8 h. Liquid nitrogen milling was accomplished by placing the vial in a thick nylon sleeve modified to allow placement into the high-energy mill as well as to allow the inflow and outflow of liquid nitrogen.
Small tablets were made by uniaxially cold pressing the as-milled powder at 3.5 GPa in a 3-mm diameter tungsten carbide die. These samples, along with loose powders, were subsequently annealed under an atmosphere of argon with 2% hydrogen (Ar 2% H2) for 1 h at various temperatures. XRD of the ball-milled and annealed powders and compacts were performed with a (XRD; Rigaku make, The Woodlands, TX) x-ray diffractometer, using Cu Kα(λ = 0.1542 nm) radiation. Crystallite size of the as-milled and heat-treated samples were estimated using the Scherrer formula. Due to instrumental broadening, the cutoff for accurate grain size measurements is ∼40 nm. For grain sizes reported larger than this value, it must be assumed that the actual grain size is much larger than the reported value. Vickers microhardness tests were performed on compacted and polished samples using a 25 g load for 15 s. The chemical composition was determined by inert gas fusion (IGF). IGF of the as-milled powders indicated a maximum accumulation of 0.009 at.% O and 0.433 at.% N due to the cryomilling process. Additionally, <1 at.% Cr and 2–3 at.% Fe, contamination from the milling media were detected via energy-dispersive spectroscopy (EDS). Transmission electron microscopy (TEM) samples were prepared on the annealed tablets using a (model No. FEI Quanta 200 3D, Hillsboro, OR) dual beam microscope. Samples were prepared for both in situ focused ion bean contrast channeling imaging (FIBCCI) and for H-bar lift out of samples for TEM. Extracted samples were examined in a (TEM. Hitachi model No. HF2000, Dallas, TX).
III. RESULTS AND DISCUSSION
Cryogenic milling resulted in the exposure of the milled powders to small amounts of nitrogen (N2), resulting in the in situ formation of yttrium nitride (YN) from the Y elemental powder. This was only possible through contamination with liquid nitrogen, during the milling process. Nitrogen contamination is believed to be the result of differential contraction between the polymeric o-ring and the steel vial resulting in breaking of the hermetic seal and, allowing nitrogen to enter the vial during extended milling times (8 h).
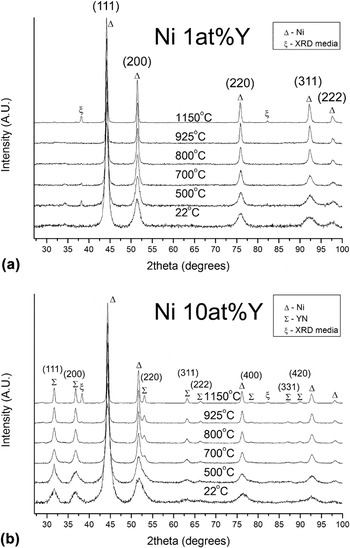
Figures 1(a) and 1(b) depict the x-ray diffraction (XRD) patterns for Ni with 1 and 10 at.% Y at room temperature and after isochronal annealing at various temperatures. The exposure of Y to N2 during milling resulted in the development of nanoscale YN particles having an average as-milled particle size of 6 nm. XRD analysis further shows, that increasing the Y concentration leads to an increased YN phase content, it being the greatest for 10 at.%Y. Prominent YN peaks were also observed in the 5 at.% Y sample, for which the data are not shown. It is assumed that for the 1 at.% Y, that YN also formed, but due to the small particle size and/or phase content, it was not detected by XRD analysis. The average matrix grain size for all alloys produced, i.e., 1,5, and 10 at.% was measured to be ∼6.5 nm. The magnitude of the internal lattice strain (not shown) was found to be compositionally dependent, having higher values for samples containing a larger YN content. The measured lattice strain decreased over the entire annealing temperature range. Annealing at 1100 °C ultimately resulted in a negligible amount of retained strain for all alloys. Additionally, it was found that annealing also resulted in a decrease in the peak width and a corresponding increase in the peak intensity, characteristic of an increase in mean grain or particle size for the Ni and YN phases respectively.
XRD patterns (a) Ni with 1 at.% Y, and (b) 10 at.% Y versus isochronal annealing temperature.

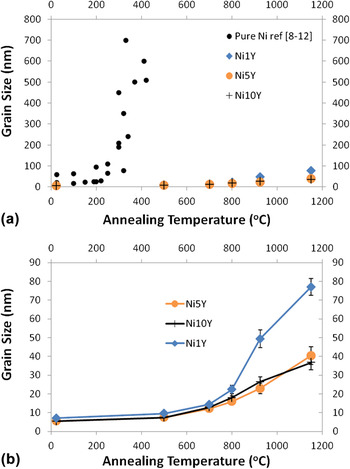
Figures 2(a) and 2(b) show the grain size after isochronal annealing for 1, 5, and 10 at.% Y. The grain size was measured by XRD line broadening analysis after annealing at the same temperatures presented in Fig. 1. Additionally, for comparison, published grain growth data for pure nc NiReference Sharma, Varshney, Bidaye and Chakravartty6–Reference Thuvander, Abraham, Cerezo and Smith11 is included in Fig. 2(a). Pure nc Ni has been shown, through differential scanning calorimetry (DSC) measurements, to exhibit grain growth over a wide range of temperatures. This range is approximated from the published literature to be between 200–300 °C.Reference Sharma, Varshney, Bidaye and Chakravartty6–Reference Thuvander, Abraham, Cerezo and Smith11 When examining the effects of annealing temperature on grain growth in the Y-stabilized alloys, a much lower rate of grain growth is observed; the onset temperature of 800 °C [Fig. 2(b)] is more than twice that obtained for the pure Ni. The grain size for all alloys up to 800 °C was found to be similar, at which point the average between the alloys was calculated to be 18.7 nm having a deviation of ±3 nm. In comparison to the literature data for pure Ni,Reference Sharma, Varshney, Bidaye and Chakravartty6–Reference Thuvander, Abraham, Cerezo and Smith11 the output from a nonlinear regression estimates that at the same temperature, pure Ni would have an average grain size of 15–20 μm. Higher annealing temperatures, (i.e., those greater than 800 °C), indicate that, the average grain size of the stabilized alloys was dependent on the Y content. In this study, the smaller grain size of the stabilized samples can be attributed directly to kinetic pinning of grain boundaries by YN particle formation, as evidenced by XRD analysis. Note that this method of stabilization is different from the method of grain boundary energy reduction, which is thermodynamic in nature.Reference Koch, Scattergood, Darling and Semones23
Grain size versus composition and isochronal annealing temperature, (a) comparative graph of nanocrystalline Ni from literature and NiY alloys. (b) NiY data plotted in (a) on an enlarged scale revealing the growth trends of Ni with 1, 5, and 10 at.%Y.

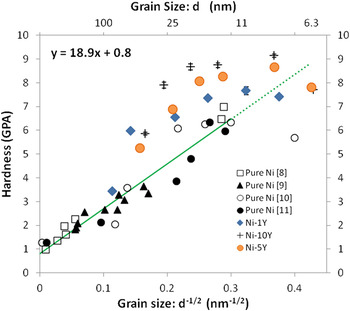
Figure 3 is the Hall-Petch plot for the Y-stabilized samples, including reference data for pure nc Ni.Reference Erb24–Reference Schuh, Nieh and Yamasaki28 As shown, the Ni-Y samples do not follow the linear trend exhibited by the reference data. An explanation for the observed deviation can be given by noting that, in this study, the change in grain size for the Ni-Y samples is a direct result of annealing, and not achieved in the as-processed state. This is an important observation as the hardening mechanisms for the Ni-Y samples are controlled by a balance between the natural tendency of the grain size to increase and the concurrent precipitation and growth of the YN phase. Therefore, there will be both a Hall-Petch contribution to the hardness as well as precipitation strengthening. The pronounced effect YN phase formation has on hardening is apparent in the vertical separation between the stabilized samples where the relative hardness increases with the Y content. Also, at the smallest grain sizes there appears to be a softening effect. Softening, or an inverse Hall-Petch behavior, has been observed in Ni and Ni alloys for very small grain sizes (e.g., <15 nm).Reference Schuh, Nieh and Iwasaki29, Reference Volpp, Goring, Kuschke and Arzt30 The hardening mechanisms responsible for the increase in strength are typically attributed to dislocation motion,Reference Conrad and Narayan31 but simulations have found limited dislocation activity below 10 nm grain sizes.Reference Schiøtz, Tolla and Jacobsen32 This indicates the mechanism for deformation has changed. The cause for this is commonly attributed to mechanisms such as grain boundary slidingReference Hahn, Mondal and Padmanabhan33 that has been found by simulation in nanocrystalline copper (nc Cu),Reference Schiøtz, Tolla and Jacobsen32, Reference Schiotz, Vegge, Tolla and Jacobsen34 or dislocation interaction with grain boundaries.Reference Scattergood and Koch35, Reference Lu and Sui36
Hall-Petch plot versus composition, including published data from the literature for pure Ni.

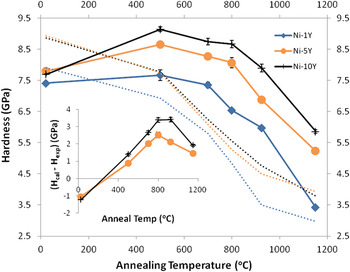
To further investigate the hardening effect of YN in nc Ni, a plot of the Vickers microhardness as a function of annealing temperature was constructed (see Fig. 4). Although the Y addition does increase the hardness by a small amount, the as-milled hardness for the Ni-Y alloys and pure Ni are similar. Whatever hardening does occur is attributed to the increased volume fraction of YN precipitates present and the slightly reduced grain size in the as-milled state. The Ni-Y alloys exhibit a well-defined increase in hardness after annealing above 530 °C; the anneal hardening effect is proportional to the Y content. Again, this may be attributed to the increased formation of YN, as these values of hardness are higher than those of pure nc Ni. After annealing about 530 °C, all Ni-Y alloys exhibit a decrease in hardness. The hardness is staggered by composition over the entire temperature range tested. At 800 °C the hardness of all of the alloys is equal to or greater than the hardness of the as-milled pure nc Ni. After annealing at 1150 °C, the hardness of the Ni 1 at.% Y is 3.5 GPa, which is comparable to the hardness exhibited by fine or ultra fine grained Ni and Ni alloys.Reference Hughes, Smith, Pande, Johnson and Armstrong26 In contrast, the hardness exhibited by the 5 and 10 at.% Y alloys are highly elevated, likely as a result of the increased dispersion of the YN phase.
Microhardness versus composition and isochronal annealing temperature. Dotted lines indicate the calculated Hall-Petch hardness using constants for pure Ni. Inset gives the difference in hardness between the experimental measurement and the Hall-Petch estimate at the various temperatures tested. The excess hardness is attributed to YN particle strengthening.

By taking the measured grain size as a function of temperature for the Ni-Y samples and the slope of the Hall-Petch plot for pure nc Ni (from Fig. 3), the dotted lines in Fig. 4 were constructed. As the Hall-Petch relationship for pure Ni in Fig. 3 is entirely based on grain size, these lines would represent the hardness of the Y-stabilized samples without the added effect of the YN precipitates. By taking the hardness difference between the solid and dotted lines and plotting it versus temperature, the result will give the hardness increase due to the presence of YN precipitates at each annealing temperature. This is provided in the inset of Fig. 4 for the 5 and 10 at.% Y samples. The plots are similar to traditional precipitation hardening diagrams, indicating extensive hardening followed by overaging, which occurs at temperatures greater than 800 °C. Due to the limited nitrogen contamination, it is not unreasonable to expect that in the as-milled case a significant solute hardening effect, occurs which is proportional to the Y content. However, the solute hardening may be masked by the observed grain size softening effect, giving rise to the negative values for the inset to Fig. 4.
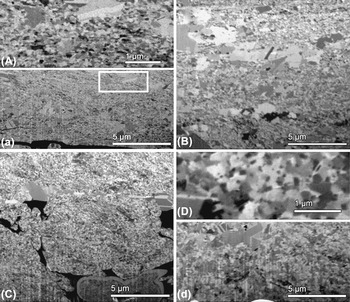
To better understand the nature of the additive hardening effect, microscopy was performed on microstructures annealed at high temperature. Figure 5 displays FIBCCI micrographs of the Ni 1 and 5 at.% Y samples, isochronally annealed at various temperatures. Ion channeling gives rise to orientation-specific contrast, as grains with different orientations appear as different shades of gray. Figures 5(A)–5(a) and Fig. 5(B) are images of Ni 1 at% Y at 800 and 925 °C. Figures 5(A) and 5(a) (high and low magnifications, respectively) show that the microstructure of Ni 1 at.% Y at 800 °C is mainly composed of nc grains 75 nm in diameter with a few isolated regions of abnormally grown grains containing twins. The white box in Fig. 5(a) indicates the enlarged region shown in Fig. 5(A). At 925 °C, in Fig. 5(B), the mean grain size of the sample (excluding the abnormally grown grains) has increased to 150 nm, along with the observation of increased number of abnormally grown grains. This is also consistent with the observed decrease in aforementioned hardness trends. Furthermore, it can be assumed, despite the limitations of XRD analysis, that at 1150 °C, for Ni-Y, only a small percentage, if any, of the microstructure remains nc. Figure 5(C) shows that the microstructure of Ni 5 at.% Y at 925 °C is mainly composed of a fine nc grain structure and, more importantly, the presence of abnormal grain growth is considerably less than that observed in Ni 1 at.% Y at 925 °C. Figures 5(D) and 5(d), are high and low magnification images, respectively, which display the microstructure of Ni 5 at.% Y at 1100 °C, a temperature which corresponds to 80% of the melting point of Ni. Here again the fraction of abnormally grown grains has increased with annealing temperature, however, the majority of the microstructure remains ultrafine with an average grain size of about 500 nm. Higher magnification FIBICC micrographs at 1150 °C revealed the presence of nanosize grain boundary precipitates, about 100 nm in diameter.
Focused ion beam channeling contrast imaging (FIBCCI) micrographs (A–a) Ni with 1 at.% Y annealed at 800 °C, corresponding to high and low magnifications respectively; (B) Ni with 1 at.% Y annealed at 925 °C. (C) Ni with 5 at.% Y annealed at 925 °C; (D–d) Ni with 5 at.% Y annealed at 1100 °C, corresponding to high and low magnifications, respectively.

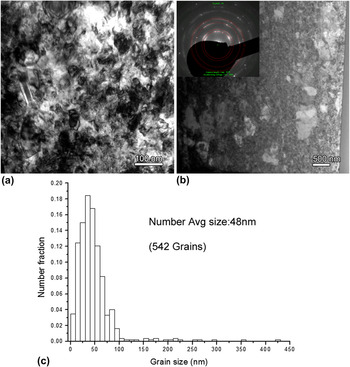
Figures 6(a) and 6(b) are high and low magnification bright field TEM images of Ni 1 at.% Y after annealing at 800 °C, respectively. Abnormally grown grains are indicated in Fig. 6(b) by white arrows; their distribution is similar to that observed in Figs. 5(A) and 5(B). The corresponding number for average grain size distribution after measuring of over 500 grains is given Fig. 6(c). The determined average grain size of 48 nm is greater than the estimation of 20 nm at 800 °C by XRD. This discrepancy is associated with residual lattice strain, and after annealing at 800 °C, is most likely related to strain induced by YN formation rather than from other sources. It is expected that elevated densities of point and liner defects due to processing have been reduced during annealing at such a high homologous temperatures (62% of the melting temperature). Despite the errors associated with Scherrer estimations of grain size, line broadening does agree qualitatively with those trends observed using FIB and TEM.
(a–b) High and low magnification bright field TEM images of Ni with 1 at.% Y annealed at 800 °C, respectively. (c) Gives the number average grain size, and distribution.

The TEM images provide a high-resolution view of the grain size distributions. It is clear from the TEM images that while the abnormal grains represent only a small percentage of the number fraction, they constitute a significant volume fraction. In fact at 800 °C, over 33% of the volume has an average grain size greater than 150 nm with 16% of the total volume fraction being greater than 350 nm. Although these larger grains play a role in reducing the hardness of the matrix, given the complicated microstructural evolution (nano and abnormal grain growth and nano YN formation) it is difficult to ascertain what the exact magnitude of this reduction is. The calculated Hall-Petch lines in Fig. 4 assume that the entire microstructure consists of nanoscale grains and ignores the volume fraction of much larger grains. The result is an underestimation in magnitude of the hardening produced by the formation of YN (see inset in Fig. 4).
Our previous investigations have established that the addition of solutes which segregate to grain boundaries in nc metals can result in a thermodynamically stabilized microstructure, thus preventing grain growth at high temperatures.Reference Darling, VanLeeuwen, Semones, Koch, Scattergood, Kecskes and Mathaudhu19, Reference Darling, Chan, Wong, Semones, Scattergood and Koch21, Reference Darling, VanLeeuwen, Scattergood and Koch22 In this experimental study for nc Ni, it was hypothesized that a Y solute species would be a potent thermodynamically stabilizing agent. The unforeseen contamination with nitrogen during mechanical alloying trapped the Y solute by incorporating it as a dispersed nano scale YN phase, which instead kinetically pinned the existing nano- or microstructure during high temperature annealing. These results indicate that the in situ formation of a finely dispersed YN phase can prevent the coarsening of nc Ni. Such improvements in thermal stability can facilitate powder consolidation in addition to opening the high temperature oxidation/corrosion application regime for nc nickel.
IV. CONCLUSIONS
High energy cryogenic mechanical alloying of 1, 5, or 10 at.% Y with Ni resulted in a kinetically stabilized nc Ni-Y alloy. Our experiments have demonstrated that, with increasing Y content, Ni can be stabilized to retain a nc substructure. However, in addition to hardening expected from conventional Hall-Petch grain size reduction, characterization revealed that an inadvertent contamination with nitrogen during the milling process caused the formation of YN precipitates, which resulted in an additional nonlinear hardening effect. To discern the role of these precipitates, the as-milled powder was subjected to isochronal annealing treatment, up to 1100 °C, with the maximum hardening effect being observed at 800 °C. The combined linear (from Hall-Petch) and nonlinear (from kinetic Zener-like pinning) resulted in significant hardening. Results reveal that kinetic pinning is effective in retaining a nanostructure to relatively high temperatures.
ACKNOWLEDGMENT
The authors would like to acknowledge the National Science Foundation (NSF) for funding this research under grant DMR-0504286.