


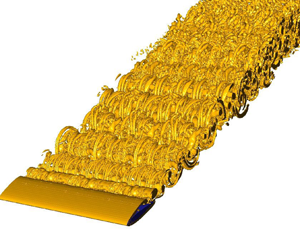





1. Introduction
Recently there has been renewed interest in flows around hydrofoils/airfoils at low Reynolds numbers ( $ {\textit {Re}}$) due to their increasing scientific relevance to fluid dynamics and their practical importance to emerging engineering applications. These include applications such as micro air vehicles and unmanned aerial vehicles, and bio-inspired studies such as the flight of smaller birds and insects like hummingbirds and fruit flies or honeybees, with Reynolds numbers in the order of
 $10^{2}-10^{4}$ (Kang & Shyy Reference Kang and Shyy2013). In this low
 $ {\textit {Re}}$ regime, the flow field over the airfoil and in the wake shows surprising complexity as it undergoes a variety of transitions to distinctly different flow states with small changes to the governing parameters. Studying these transitions is essential from both fundamental and engineering points of view as they directly affect the fluid forces acting on the airfoil.
The non-dimensional governing parameters for the present problem of two-dimensional (2-D) incompressible flow around a stationary airfoil can be categorised as two geometric parameters: the relative thickness and camber of the airfoil profile; and two flow parameters: the Reynolds number,  $ {\textit {Re}} = U_\infty C/\nu$, based on the free-stream velocity
 $U_{\infty }$, chord length
 $C$ and kinematic viscosity
 $\nu$; and the angle of attack,
 $\alpha$, to the oncoming flow. This study focuses on the flow over a NACA0012 airfoil at Reynolds numbers
 $ {\textit {Re}} \leq 5000$, and angles of attack
 $0 \leq \alpha \leq 20^\circ$. We have chosen this range of
 $\alpha$ as it extends from below to well beyond stall, and also note that the transition from 2-D to three-dimensional (3-D) flow occurs within this range.
1.1. Transitions in the wake or near the surface of the airfoil
As indicated above, as the angle of attack or Reynolds number is increased from small values, the flow around an airfoil or in its wake experiences different flow phenomena/transitions that have been observed both qualitatively and quantitatively. Transitions have been recorded previously through both experimental and numerical investigations, and are discussed below. For consistency with the current study, this reviewed literature focuses mainly on the range  $ {\textit {Re}}\leq 5000$.
Huang & Lin (Reference Huang and Lin1995) studied various wake flow transitions of a NACA0012 airfoil at  $ {\textit {Re}}=3195$ as
 $\alpha$ was varied between
 $0^\circ$ and
 $90^\circ$ using smoke-wire visualisation. Later extending this investigation, Huang et al. (Reference Huang, Wu, Jeng and Chen2001) used particle image velocimetry (PIV) to identify five different near-surface/near-wake flow regimes dependent on
 $\alpha$ and
 $ {\textit {Re}}$, namely: (i) attached flow, (ii) trailing-edge vortex, (iii) separation vortex, (iv) leading-edge vortex (LEV) and (v) bluff-body effect, for a NACA0012 airfoil covering
 $500 \leq {\textit {Re}} \leq 2500$ and
 $0^\circ \leq \alpha \leq 90^\circ$. For a similar range of
 $\alpha$, Alam et al. (Reference Alam, Zhou, Yang, Guo and Mi2010) studied the NACA0012 near-wake characteristics at
 $ {\textit {Re}}=5300$ using laser-induced fluorescence flow visualisation. Perhaps unsurprisingly, they observed that the suction-side boundary layer initially separates at the trailing edge for lower angles of attack, and with increasing
 $\alpha$ (
 $\alpha <10^\circ$) the point of separation moves gradually towards the leading edge.
A detailed 2-D numerical investigation was performed by Kurtulus (Reference Kurtulus2016), identifying a variety of wake transitions of NACA0002 and NACA0012 airfoils at  $ {\textit {Re}}=1000$. The angle of attack was varied over the full range
 $0^\circ \leq \alpha \leq 180^\circ$. Five different modes were observed, namely: (i) a continuous vortex-sheet mode, (ii) alternating vortex-shedding mode, (iii) alternating vortex-pair shedding mode, (iv) alternating single vortex with vortex-pair shedding mode and (v) bluff-body vortex-shedding mode. These were categorised according to the wake vorticity pattern, the amplitude spectrum of the lift coefficient, aerodynamic force coefficients and the longitudinal and lateral vortex spacings. In the present study we have also observed a similar categorisation of wake transitions and discuss them in detail in § 3. Rossi et al. (Reference Rossi, Colagrossi, Oger and Le Touzé2018) also studied the flow transitions of a NACA0010 airfoil using a vortex particle method. However, compared with the study of Kurtulus (Reference Kurtulus2016), their investigation was at a fixed
 $\alpha =30^\circ$ while
 $ {\textit {Re}}$ was varied between 100 and 3000. Recently, Deng, Sun & Shao (Reference Deng, Sun and Shao2019) performed 2-D simulations to study unsteady flow separation around a NACA0015 airfoil at five different angles of attack,
 $\alpha =10^\circ,12.5^\circ,15^\circ,17.5^\circ \ \text {and}\ 20^\circ$, with
 $ {\textit {Re}}$ varying from 100 to 1300. For
 $\alpha =10^\circ \text { and }12.5^\circ$, they observed a maximum of four different branches in the
 $St{-}Re$ relationship. In contrast, for higher angles (
 $\alpha =15^\circ,17.5^\circ,20^\circ$), they did not observe any jumps in the relationship. To the knowledge of the authors, there are no further experimental and numerical studies discussing wake transitions of NACA airfoils for Reynolds numbers in the range
 $2000 \leq {\textit {Re}} \leq 5000$.
1.2. Prediction of the onset of three dimensionality in wakes
A landmark numerical investigation into predicting 3-D wake transition in a circular cylinder wake was undertaken by Barkley & Henderson (Reference Barkley and Henderson1996). Using Floquet stability analysis, they accurately predicted the critical Reynolds number for 3-D transition,  $ {\textit {Re}}_{3D}$, along with the corresponding spanwise wavelength,
 $\lambda$. They also reproduced the symmetries of different unstable wake modes. Their predictions matched well with the experimental results of Williamson (Reference Williamson1988b, Reference Williamson1996a). The first instability mode, mode A, was predicted to first become unstable at
 $ {\textit {Re}}_{3D}\approx 190$ with a spanwise wavelength of four cylinder diameters. The second unstable mode, mode B, was predicted to emerge at
 $ {\textit {Re}}_{3D,2}\approx 260$ with a spanwise wavelength of 0.8 times the cylinder diameter. However, the predicted
 $ {\textit {Re}}_{3D,2}$ for mode B was somewhat higher than
 $ {\textit {Re}}_{3D,2}\approx 230\unicode{x2013}240$ obtained from experimental observations (Williamson Reference Williamson1988b; Miller & Williamson Reference Miller and Williamson1994) and direct numerical simulations (Thompson, Hourigan & Sheridan Reference Thompson, Hourigan and Sheridan1996). The difference in
 $ {\textit {Re}}_{3D,2}$ is due to the prior onset and saturation of mode A, which substantially changes the 2-D base flow for the Floquet stability analysis. Following on from the work of Barkley & Henderson (Reference Barkley and Henderson1996), various stability analyses have been performed for different geometries and flow conditions. These include studies on elliptical cylinders (Thompson et al. Reference Thompson, Radi, Rao, Sheridan and Hourigan2014), toroids (Sheard, Thompson & Hourigan Reference Sheard, Thompson and Hourigan2003), oscillating or rotating circular cylinders (Leontini, Thompson & Hourigan Reference Leontini, Thompson and Hourigan2007; Rao et al. Reference Rao, Leontini, Thompson and Hourigan2013), normal, inclined or rounded edge square cylinders (Robichaux, Balachandar & Vanka Reference Robichaux, Balachandar and Vanka1999; Sheard Reference Sheard2011; Park & Yang Reference Park and Yang2016) and normal, inclined or elliptical leading-edge flat plates (Julien, Ortiz & Chomaz Reference Julien, Ortiz and Chomaz2004; Ryan, Thompson & Hourigan Reference Ryan, Thompson and Hourigan2005; Yang et al. Reference Yang, Pettersen, Andersson and Narasimhamurthy2013).
Concerning stability analysis of an airfoil wake, fewer studies have been reported discussing the role of the various governing parameters (discussed above) on the onset of wake three-dimensionality. Meneghini et al. (Reference Meneghini, Carmo, Tsiloufas, Gioria and Aranha2011) investigated the significance of one of these flow parameters,  $ {\textit {Re}}$, for a NACA0012 airfoil at fixed
 $\alpha =20^\circ$ for
 $400\leq {\textit {Re}} \leq 1000$. They noticed that the flow becomes three-dimensionally unstable at a critical
 $ {\textit {Re}}_{3D}=456$ through a subharmonic mode (mode C) of wavelength
 $\lambda /C=0.57$. Further, they observed an unstable quasi-periodic mode, (mode QP) of wavelength
 $\lambda /C=2.1$ for
 $ {\textit {Re}} > 580$. Similarly, Deng, Sun & Shao (Reference Deng, Sun and Shao2017) studied the effect of varying the Reynolds number on the wake of a NACA0015 airfoil fixed at four different angles of attack:
 $\alpha =12.5^\circ,15^\circ,17.5^\circ,20^\circ$, for
 $ {\textit {Re}}$ in the range
 $460\leq Re\leq 1800$. They observed the subharmonic mode C as the only unstable 3-D mode for
 $\alpha =12.5^\circ$ and
 $15^\circ$. In contrast, four different unstable modes: mode A, mode QP, and two subharmonic modes of different wavelengths, were observed for
 $\alpha =17.5^\circ$ and
 $20^\circ$. He et al. (Reference He, Gioria, Pérez and Theofilis2017) studied the effect of both the geometric parameters by comparing the wakes of three airfoils NACA0009, NACA0015, and NACA4415, at a fixed
 $\alpha =20^\circ$ and
 $ {\textit {Re}}$ in the range
 $ {\textit {Re}} < 600$. They observed transition Reynolds numbers of
 $ {\textit {Re}}_{3D}=442, 474,$ and
 $435$ for NACA0009, NACA0015, and NACA4415 profiles, respectively.
1.3. The focus of the present work
Considering this literature, there is ample motivation to revisit the problem of studying 2-D and 3-D wake transitions of a NACA0012 airfoil as  $\alpha$ is increased, covering the moderate Reynolds number range:
 $500 \leq {\textit {Re}} \leq 5000$. The present study is divided into two sections. First, in § 3, we study 2-D flow transitions as a function of
 $\alpha$ and
 $ {\textit {Re}}$. These transitions are categorised based on qualitative and quantitative features, including time-instantaneous vortex structure and non-dimensional frequency
 $ {\textit {St}}$ (defined in § 3). Through this analysis, we are able to regenerate similar 2-D wake patterns found in the lower Reynolds number study of Kurtulus (Reference Kurtulus2016), but noting the complexity increases as the Reynolds number is increased. These results include categorising different wake structures as: a continuous vortex-sheet mode; an alternating vortex-shedding mode; and an alternating vortex-pair shedding mode. However, beyond the earlier analysis, and because of the increased
 $ {\textit {Re}}$ range, we further categorise the alternating vortex-pair shedding mode into three sub-classes. In § 4, these 2-D transitions are correlated with changes to the time-averaged lift and drag coefficients. In addition, the predicted 2-D lift and drag coefficients are also compared with the direct measurements from water-channel experiments. Second, in § 5, we determine 2-D to 3-D flow transitions through Floquet stability analysis. The above literature indicates that the earlier studies were mainly focused on documenting flow transitions for fixed angles of attack, and for Reynolds numbers considerably lower than the current study. However, the focus here is on varying angle of attack, noting its effect on flow transitions and physical phenomena such as the onset of stall. Thus, one of the primary aims of this paper is to elucidate the effect of increasing the angle of attack on the development of three-dimensionality in a NACA0012 airfoil wake and to map this behaviour as a function of Reynolds number.
We seek to address the following questions. What are the different quantitative (in terms of shedding frequency) and qualitative (in terms of wake structure) transitions occurring in the wake of an airfoil with increasing  $\alpha$ to beyond the stall angle? How well do the time-averaged coefficients obtained from the 2-D simulations match those of water-channel experiments? At a fixed
 $ {\textit {Re}}$, what is the minimum angle of attack at which the flow becomes two-dimensionally unstable? With increasing
 $\alpha$, what different 3-D instability modes appear, and how do they affect the saturated wake state. These questions are addressed by performing 2-D and 3-D direct simulations, measuring forces in the water-channel-based experiments, and undertaking Floquet stability analysis on pre-transition base flows.
2. Methodology
2.1. Experimental apparatus
Experiments investigating the flow over a stationary airfoil were conducted in the free-surface recirculating water-channel facility of the Fluids Laboratory for Aeronautical and Industrial Research (FLAIR) at Monash University, Australia. The facility has a test section of  $4000 \times 600 \times 800$ mm
 $^3$, with the free-stream turbulence intensity measuring
 ${\sim} 1$ %. Details of the water-channel test facility can be found in Zhao et al. (Reference Zhao, Leontini, Jacono and Sheridan2014).
The schematic of the experimental set-up is shown in figure 1. A rigid NACA0012 airfoil was manufactured from an aluminium plate with a span/immersed length of 300 mm and a chord length of 30 mm, providing an aspect ratio  $AR=10$. The angle made by the airfoil chord with the incoming fluid flow direction is known as the angle of attack,
 $\alpha$. In experiments,
 $\alpha$ was varied over
 $0^\circ \unicode{x2013}20^\circ$ using a stepper motor (model LV172; Parker Hannifin, USA) attached at the airfoil top. The stepper motor was controlled using a micro-stepping drive (model E-DC) with a resolution of 25 000 steps per revolution and a Parker 6K2 motion controller. Details of the motor mechanism can be found in the studies of flow-induced vibration of rotating cylinders by Zhao et al. (Reference Zhao, Lo Jacono, Sheridan, Hourigan and Thompson2018) and Wong et al. (Reference Wong, Zhao, Lo Jacono, Thompson and Sheridan2017, Reference Wong, Zhao, Lo Jacono, Thompson and Sheridan2018). The airfoil coupled with the stepper motor was attached to a force sensor that was mounted vertically. An end-conditioning platform technique was used to minimise end effects and promote parallel vortex shedding. The platform had a top plate of dimension
 $595 \times 600 \times 10$ mm
 $^{3}$ with a
 $1:4$ semi-elliptical leading edge and was 165 mm deep, providing a small gap of 1 mm between the airfoil and the top of the platform plate. The streamwise (drag) and transverse (lift) force components acting on the airfoil were measured using a high-precision six-axis force sensor (Mini40, ATI-IA, USA) with an accuracy of 5 mN (see Sareen et al. Reference Sareen, Zhao, Lo Jacono, Sheridan, Hourigan and Thompson2018; Zhao, Thompson & Hourigan Reference Zhao, Thompson and Hourigan2022).
Side-view schematic of the present experimental set-up.

2.2. Two-dimensional base flow
For the present problem of flow around a NACA0012 airfoil at different angles of attack, the governing equations are the continuity and the incompressible Navier–Stokes equations. In non-dimensionalised form, these are given by
 \begin{gather} \text{Continuity}:\ \boldsymbol{\nabla} \boldsymbol{\cdot} \boldsymbol{U}=0,\end{gather}
 \begin{gather} \text{Momentum}:\ \frac{\partial\boldsymbol{U}}{\partial t}+\boldsymbol{\nabla} \boldsymbol{\cdot} (\boldsymbol{U}\boldsymbol{U})={-}\boldsymbol{\nabla} P+\frac{1}{Re}{\nabla}^{2}\boldsymbol{U},\end{gather}
where  $\boldsymbol {U}(\equiv \boldsymbol {u}/U_{\infty },U_{\infty }$ is the free-stream velocity) is the non-dimensional velocity vector and
 $P(\equiv p/\rho U_{\infty }^{2},\rho$ is the density of the surrounding fluid
 $)$ is the non-dimensional pressure.
The above equations are discretised in space using a nodal spectral-element method. The general method is described in detail by Karniadakis & Sherwin (Reference Karniadakis and Sherwin2005) and the current implementation has been successfully applied to related problems (e.g. Thompson et al. Reference Thompson, Hourigan and Sheridan1996; Thompson, Leweke & Provansal Reference Thompson, Leweke and Provansal2001a; Thompson, Leweke & Williamson Reference Thompson, Leweke and Williamson2001b; Ryan et al. Reference Ryan, Thompson and Hourigan2005; Leontini et al. Reference Leontini, Thompson and Hourigan2007). The in-house spectral-element code, in essence, is based on the Galerkin finite-element method in which the solution variables are approximated using high-order interpolating Lagrangian-polynomial shape functions. The node points coincide with the Gauss–Lobatto–Legendre quadrature points within each element, which leads to efficient and accurate evaluation of the weighted-residual integrals involved in setting up the discretised equations.
The resulting set of ordinary differential equations for the nodal values were integrated in time using a second-order accurate three-step time-splitting method, which allows different integration schemes for the different linear and nonlinear terms. The nonlinear advection term is integrated explicitly by using a third-order Adams–Bashforth method. The diffusion substep is treated implicitly using the  $\theta$ modification of the Crank–Nicholson scheme. Finally, the pressure field was evaluated implicitly by forming a Poisson equation (formed by taking the divergence of the equation for the pressure substep) and enforcing continuity at the end of the time step. More details on the three-step time-splitting method are given in Karniadakis, Israeli & Orszag (Reference Karniadakis, Israeli and Orszag1991) and Thompson et al. (Reference Thompson, Hourigan and Sheridan1996).
For the 3-D simulations, given the cylindrical geometry, the  $z$ (spanwise) dependence of the solution variables is expressed as a complex Fourier series (Karniadakis & Triantafyllou Reference Karniadakis and Triantafyllou1992). This allows decoupling of the equations for each Fourier mode. In turn, this enables the implicit pressure and diffusion substeps to be treated as a sequence of 2-D matrix problems, involving sparse-matrix-vector multiplies for each time step after the initial inversion step.
Finally, 2-D steady flows were evaluated using a penalty-based version of a spectral-element implementation that reduces the computational requirements by first eliminating the pressure from the discretised system (see, e.g. Zienkiewicz Reference Zienkiewicz1977). This has been previously applied successfully to a number of related studies (e.g. Jones, Hourigan & Thompson Reference Jones, Hourigan and Thompson2015; Rao et al. Reference Rao, Leontini, Thompson and Hourigan2017).
2.3. Floquet stability analysis
Two-dimensional base flows are used to determine the onset of three dimensionality in the flows past inclined NACA0012 airfoils by using Floquet stability analysis. Basically, this analysis determines a periodic base flow's linear stability to 3-D disturbances as a function of spanwise wavelength,  $\lambda$, and governing parameters
 $(\alpha \text { or }Re)$. If any of the eigenmodes corresponding to any spanwise wavelength have a positive growth rate, then the base flow is unstable to 3-D disturbances; this indicates the onset of three dimensionality in the wake. The basic explanation of the methodology used for the current study can be found in Iooss & Joseph (Reference Iooss and Joseph2014). The successful implementation of the methodology has already been verified for various geometries and flow conditions: Thompson et al. (Reference Thompson, Leweke and Williamson2001b), Sheard et al. (Reference Sheard, Thompson and Hourigan2003), Ryan et al. (Reference Ryan, Thompson and Hourigan2005), Leontini et al. (Reference Leontini, Thompson and Hourigan2007) and Rao et al. (Reference Rao, Leontini, Thompson and Hourigan2013).
In overview the methodology is as follows. The governing equations for the perturbation fields are formed by assuming the velocity and pressure fields are the sum of their periodic base state and 3-D perturbations, given by
 \begin{equation} \left. \begin{gathered} U(x,y,z,t)=\bar{u}(x,y,t)+u{'}(x,y,z,t),\\ V(x,y,z,t)=\bar{v}(x,y,t)+v{'}(x,y,z,t),\\ W(x,y,z,t)=w{'}(x,y,z,t),\\ P(x,y,z,t)=\bar{p}(x,y,t)+p{'}(x,y,z,t), \end{gathered} \right\} \end{equation}
where  $u,v$ and
 $w$ are the components of the velocity field in the
 $x, y$ and
 $z$ directions, respectively, and
 $p$ is the kinematic pressure field. Variables with overbars correspond to the 2-D base flow, whereas, the superscript
 $(')$ denotes the 3-D perturbation field of the same base-flow field.
Substituting the above relations into (2.2), subtracting from the original equation (describing the base flow) and then linearising leads to the equation governing the evolution of the perturbation velocity and pressure fields, given by
 \begin{equation} \frac{\partial u{'}}{\partial t}+\bar{u} \boldsymbol{\cdot} \boldsymbol{\nabla} u{'}+u{'} \boldsymbol{\cdot} \boldsymbol{\nabla}\bar{u}={-}\boldsymbol{\nabla} p{'}+\nu{\nabla}^{2}u{'}. \end{equation}
Because the equation is linear with constant coefficients in  $z$, the spanwise dependence is sinusoidal and the solution is just the summation of these (spanwise) Fourier modes. In particular, the solution can be constructed as
 $(u',v',w',p')\rightarrow (\cos (2{\rm \pi} z/\lambda )u',\cos (2{\rm \pi} z/\lambda )v',\sin (2{\rm \pi} z/\lambda )w',\cos (2{\rm \pi} z/\lambda )p')$ (see Barkley & Henderson Reference Barkley and Henderson1996), noting the dependence of the dashed variables is reduced to
 $(x,y,t)$, and
 $\lambda$ is the spanwise wavelength of the Floquet mode.
According to Floquet theory, perturbations should grow or decay exponentially from one period to another. Thus, the perturbation fields should satisfy the relationship
 \begin{equation} r{'}(x,y,t+T)=\exp(\sigma T)r{'}(x,y,t), \end{equation}
where  $r{'}$ represents any of the perturbation fields (
 $u{'},v{'},w{'}$ or
 $p{'}$),
 $t$ is time and
 $T$ is the time period of the base flow. The exponential coefficient
 $\exp (\sigma T$) is known as the Floquet multiplier
 $\mu$ and its magnitude determines the onset of three dimensionality in the flow field. If
 $|\mu |>1$, the above equation shows that the perturbation field grows exponentially from one period to another. Hence, the flow field is linearly unstable to 3-D instability for the particular spanwise wavelength, indicating the onset of three dimensionality in the flow. Also, note that the above equation is an eigenvalue problem. Thus, multiple solutions or Floquet modes may exist for a particular streamwise wavelength. However, the fastest growing mode is of most interest and corresponds to the one with the largest magnitude of the Floquet multiplier.
For the numerical implementation of the above scheme, the following steps are undertaken. Initially, a random perturbation field for a selected streamwise wavelength is taken and integrated forward in time along with the base-flow field. Note that the temporal integration and spatial discretisation used for the perturbation field are the same as those used for the base flow. At the end of the base-flow period  $T$, the resulting perturbation field is normalized by its amplitude. Here, the amplitude is calculated by taking the L2 norm of the same perturbation field. This newly formed perturbation field is then reintegrated in time along with the base flow and again renormalised for the next step. After many iterations, the perturbation field is left with only the fastest growing mode, and we observe a constant or periodic Floquet multiplier of this dominant mode. The trend of the resulting Floquet multiplier (constant or periodic) also indicates the kind of 3-D instability. For instance, for a circular cylinder, the constant Floquet multipliers represent those instability modes with a period that is either the same as the base flow (mode A and mode B) or a multiple of the base flow (i.e. mode C). In contrast, if the Floquet multiplier is periodic, this corresponds to those instability modes whose period is incommensurate with the base-flow period (i.e. quasi-periodic modes often identified as mode QP). The Floquet multiplier for these modes is a complex variable in which the imaginary component is responsible for the sinusoidal variation in the perturbation field, and, thus, the L2 norm oscillates in time. Hence, the magnitude of the Floquet multiplier for these modes can be calculated using a Krylov subspace (essentially a collection of saved perturbation fields) and Arnoldi decomposition to determine the dominant modes (Barkley & Henderson Reference Barkley and Henderson1996; Blackburn & Lopez Reference Blackburn and Lopez2003). In that case, the perturbation fields are not normalised each iteration. The magnitude of Floquet multiplier also indicates the type of 3-D instability. As summarised by Sheard, Fitzgerald & Ryan (Reference Sheard, Fitzgerald and Ryan2009), positive Floquet multipliers represent synchronous modes, i.e. mode A and mode B, negative Floquet multipliers indicate subharmonic modes, and complex Floquet multipliers indicate quasi-periodic modes as the fastest growing instabilities. However, in the present study both the magnitude of the Floquet multiplier and the type of spatio-temporal symmetry of the wake perturbation fields are considered for proper identification of the modes.
2.4. Computational details
The computational domain and the boundary conditions for simulating the flow past an inclined airfoil are illustrated in figure 2. The computational domain lengths are non-dimensionalised by the chord length of the airfoil. The leading edge of the airfoil is placed at origin (0,0), with the front and side boundaries at  $24C$, while the rear boundary is at
 $8C$ downstream. Thus, the maximum lateral blockage is maintained under
 $0.4\,\%$, ensuring that the flow field is largely unaffected by the proximity of the side boundaries. For generating the base flow, the boundary conditions are as follows. The front and side boundaries are assigned a constant velocity
 $(U=1)$ in the streamwise direction, and the outlet boundary is set to have constant pressure and zero normal velocity component derivatives. The airfoil is rigid with a no-slip condition applied at its surface and a high-order pressure boundary condition is also applied there (Karniadakis et al. Reference Karniadakis, Israeli and Orszag1991). For generating the 3-D perturbation fields,
 $u^{'},v^{'},w^{'}$ were set to zero at all boundaries except the outlet where a zero normal velocity gradient condition is imposed.
Non-dimensional computational set-up for the present problem.

The numerical method used for the present study has already been applied successfully to various stability problems (Thompson et al. Reference Thompson, Leweke and Williamson2001b; Sheard et al. Reference Sheard, Thompson and Hourigan2003; Ryan et al. Reference Ryan, Thompson and Hourigan2005; Leontini et al. Reference Leontini, Thompson and Hourigan2007; Rao et al. Reference Rao, Leontini, Thompson and Hourigan2013). However, a further validation study was conducted against a recent Floquet analysis of a NACA0015 airfoil by Deng et al. (Reference Deng, Sun and Shao2017) and is presented in figure 3(a). The figure shows excellent agreement for the Floquet multiplier variation with wavenumber  $(\beta =2{\rm \pi} C/\lambda )$ for the airfoil wake at
 $ {\textit {Re}}=500$ and
 $\alpha =20^\circ$. Further validation was undertaken to examine the prediction of different Floquet modes for particular
 $\alpha, \lambda$ and
 $ {\textit {Re}}$. For
 $\alpha =20^\circ$ and
 $ {\textit {Re}}=740$, Deng et al. (Reference Deng, Sun and Shao2017) found three instability modes: mode A, a quasi-periodic mode (QP) and a subharmonic mode (C) at
 $\lambda =6.28C$,
 $2.09C$ and
 $0.785C$, respectively. The same modes are observed from the present analysis and are shown in figures 3(b), 3(c) and 3(d), respectively, but noting the colourmap is different from that of Deng et al. (Reference Deng, Sun and Shao2017). Figure 3(b) shows that the period of mode A is equal to that of the base flow (period
 $= \tau = 1.0T$ with
 $T$ the base-flow period), figure 3(c) shows that the period of mode QP is approximately ten times that of the base-flow period
 $\tau \simeq 10.0T$, and figure 3(d) shows that the period for the subharmonic (mode C) is twice that of the base-flow period
 $\tau =2.0T$. Further discussion on the characteristics of each of these modes is provided in § 6.
Validation study comparing (a) the variation of the modulus of the Floquet multiplier,  $|\mu |$, with wavenumber (
 $\beta =2{\rm \pi} C/\lambda$) at
 $\alpha =20^\circ$ and
 $ {\textit {Re}}=500$; (b) instability mode A at
 $\alpha =20^\circ$,
 $\lambda =6.28C$ and
 $ {\textit {Re}}=740$; (c) instability mode QP at
 $\alpha =20^\circ$,
 $\lambda =2.09C$ and
 $ {\textit {Re}}=740$; and (d) instability mode C at
 $\alpha =20^\circ$,
 $\lambda =0.785C$ and
 $ {\textit {Re}}=740$ compared with images from Deng et al. (Reference Deng, Sun and Shao2017). Note that the perturbation fields are illustrated through spanwise perturbation vorticity with the wake vortices highlighted by solid black lines. Slight differences between similar images are likely due to different contour levels and phase in the shedding cycle.

Along with the validation study, a grid independence or spatial resolution study was also carried out by performing a p-type resolution study. In this study, the order ( $n-1$) of the tensor-product Lagrangian-polynomial interpolants within each element was varied by changing the number of internal nodes within each element:
 $n \times n = 3 \times 3$,
 $4 \times 4$ and
 $5\times 5$. The study was performed at
 $\alpha =8^\circ$ and
 $ {\textit {Re}}=5000$, which corresponds to the highest
 $\alpha$ and
 $ {\textit {Re}}$ at which the linear Floquet stability analysis was conducted in subsequent computations. The time-varying drag force
 $(F_{x})$ and the modulus of the largest Floquet multiplier
 $|\mu |$ were measured and are compared in figures 4(a) and 4(b), respectively, for different polynomial orders. The
 $n\times n = 3\times 3$ Floquet multiplier predictions were not close to the higher-order results and are not shown. The figures show that the difference between measured values for
 $n\times n = 4\times 4$ and
 $5\times 5$ is not significant – an approximately 2 % difference in the value of the Floquet multiplier at the preferred spanwise wavelength. Thus, third-order (
 $n\times n = 4\times 4$) interpolating Lagrangian polynomials were used for all the simulations discussed below, noting that the
 $5\times 5$ grid simulations are very expensive to run given the finest of the mesh used and the number of simulations required.
Grid independence studies comparing the (a) time-varying drag force ( $F_{x}$) and (b) modulus of the largest Floquet multiplier (
 $|\mu |$) for
 $n \times n = 4\times 4$ and
 $5 \times 5$, at
 $\alpha =8^\circ$ and
 $ {\textit {Re}}=5000$.

3. Various 2-D transitions in the wake of an airfoil
Prior to investigating 3-D wake transitions, it is necessary to determine the underlying periodic base-flow states. For the flow over a circular cylinder, it is well known that with increasing Reynolds number  $ {\textit {Re}}$, the flow undergoes a supercritical Hopf bifurcation from 2-D steady to 2-D oscillatory (periodic) flow. The bifurcation occurs at a critical
 $ {\textit {Re}}\approx 46$, and for a range of
 $ {\textit {Re}}$ above this bifurcation, the 2-D wake is laminar and time periodic with a unique relation between
 $ {\textit {Re}}$ and
 $St$ – that wake is known as a Bénard–von Kármán (BvK) vortex street. The relationship breaks with a discontinuity at
 $ {\textit {Re}}\approx 188$, which indicates the critical point for the emergence of three dimensionality in the flow (Williamson Reference Williamson1988b,Reference Williamsona; Barkley & Henderson Reference Barkley and Henderson1996; Williamson Reference Williamson1996a).
In the present work, figure 5(a) shows a similar supercritical Hopf bifurcation from 2-D steady to 2-D oscillatory (periodic) flow for a stationary hydrofoil with increasing  $\alpha$ for
 $ {\textit {Re}}$ in the range
 $500$–
 $5000$. This is achieved here by undertaking linear stability analysis on the steady flow solution and results are verified by performing 2-D unsteady simulations and water-channel PIV experiments. Note that the PIV experiments were performed only for
 $ {\textit {Re}} = 2000$ and 5000, whereas 2-D unsteady simulations were performed for all the
 $\alpha$ and
 $ {\textit {Re}}$ considered in the study. The figure shows the variation of growth rate
 $\sigma$ with increasing
 $\alpha$ for a discrete set of
 $ {\textit {Re}}$. Here
 $\sigma = 0$ indicates a supercritical Hopf bifurcation to 2-D periodic flow. The critical
 $\alpha$ at which this transition occurs is termed here as
 $\alpha _1$, and the figure shows that
 $\alpha _1$ decreases with increasing
 $ {\textit {Re}}$. The corresponding variation of
 $\alpha _1$ with
 $ {\textit {Re}}$ is shown in figure 5(b) and the relationship is given by
 \begin{equation} \alpha_1 {\sim} {\textit{Re}}^{{-}0.65}. \end{equation}
(a) Onset of vortex shedding as a function of angle of attack and Reynolds number determined by linear stability analysis of steady base flows. The figure plots growth rate,  $\sigma$, against angle of attack, spanning Reynolds numbers in the range [500, 5000]. (b) Variation of critical
 $\alpha _1$ (at which supercritical Hopf bifurcation occurs) with
 $ {\textit {Re}}$. Also shown are selected transition values for other NACA airfoils of the same series, overlaid with dashed lines denoting indicative variations.

For the attack angles  $\alpha > \alpha _1$, figure 6 shows the variation of non-dimensional shedding frequency (Strouhal number
 $St$) with increasing
 $\alpha$ for a range of
 $ {\textit {Re}}$. For a stationary airfoil, the Strouhal number is defined as
 $St=fC/U_{\infty }$, where
 $f$ is the fundamental wake frequency of the flow, determined from the dominant spectral peak of the fast Fourier transform of the lift trace. For all
 $ {\textit {Re}}$, the figure shows that
 $St$ generally decreases with an increasing
 $\alpha$; however, there are some sudden drops and discontinuities in these curves. Here, a discontinuity represents aperiodicity in the flow at corresponding
 $\alpha$ and
 $ {\textit {Re}}$, and can be seen for
 $ {\textit {Re}} \geq 2000$. For example, for
 $ {\textit {Re}} = 2000$, figure 6 shows a sudden drop at
 $\alpha _2 = 11^\circ$ after which the flow becomes aperiodic for a narrow range of
 $11.5^\circ \leq \alpha \leq 13.0^\circ$, before it again returns to be periodic at
 $\alpha _{3}=13.5^\circ$, and remains so for higher angles. For
 $ {\textit {Re}} = 3000$, the curve is discontinuous at both intermediate angles of attack (
 $\alpha = 11^\circ$) and higher angles of attack (
 $\alpha \geq 15^\circ$). Thus, two periodic zones are separated by an aperiodic zone for
 $ {\textit {Re}} = 2000$ and 3000. In contrast, for
 $ {\textit {Re}} = 4000$ and 5000, the curve remains continuous and breaks only at higher angles of attack (
 $\alpha \geq 14^\circ$), indicating the onset of aperiodicity only at higher angles. However, two distinct drops in
 $St$ can be seen at
 $\alpha _2 = 8^\circ$ and
 $\alpha _3 = 10^\circ$ for
 $ {\textit {Re}} = 4000$, which reduce to
 $\alpha _2 = 7.5^\circ$ and
 $\alpha _3 = 9^\circ$ for
 $ {\textit {Re}} = 5000$, respectively. Thus, after the supercritical Hopf bifurcation, the present results show no bifurcations for
 $ {\textit {Re}} \leq 1000$, two additional bifurcations for
 $ {\textit {Re}} \leq 3000$ and three additional bifurcations for
 $ {\textit {Re}} > 3000$ with increasing
 $\alpha$ in the range
 $0^\circ$–
 $20^\circ$. These bifurcations are due to wake transitions and are discussed below. The present trend of decreasing
 $St$ with increasing
 $\alpha$ matches experimental results on a NACA0012 airfoil by Huang et al. (Reference Huang, Wu, Jeng and Chen2001). Furthermore, the Strouhal number for
 $\alpha =10^\circ$ at
 $ {\textit {Re}}=1000$ and 5000 matches well with the other numerical predictions for the same parameters given by Mittal & Tezduyar (Reference Mittal and Tezduyar1994), as shown in figure 6.
Compilation of results showing how non-dimensional shedding frequency,  $St$, varies with angle of attack,
 $\alpha$, as the Reynolds number is varied. The discontinuity in the curves of
 $ {\textit {Re}} \geq 2000$ represents aperiodic flow at the corresponding range of
 $\alpha$.

The wake patterns of the above-discussed cases are identified and categorised according to the results obtained by Kurtulus (Reference Kurtulus2016) for a NACA0012 airfoil at  $ {\textit {Re}}=1000$, and later by Rossi et al. (Reference Rossi, Colagrossi, Oger and Le Touzé2018) for a NACA0010 airfoil at a fixed
 $\alpha =30^\circ$ and
 $ {\textit {Re}}$ in the range
 $100\leq Re\leq 3000$. The wake modes are the continuous vortex-sheet mode, alternating vortex-shedding mode and alternating vortex-pair shedding mode. However, in the present study we further subcategorised the alternating vortex-pair shedding mode into four types: leftward alternating vortex-pair shedding mode, neutral alternating vortex-pair shedding mode, rightward alternating vortex-pair shedding mode and chaotic alternating vortex-pair shedding mode, based on both the qualitative (lateral deviation and arrangement of vortices in the street) and quantitative (
 $St{-}\alpha$ relationship and time-averaged force coefficients) results. These different wake structures are marked in figure 7(a) as a regime wake map. The corresponding instantaneous and time-averaged vorticity plots, providing examples of each of these regimes, are presented in figure 7(b–f). Note that the categorisation is based on the analysis within four chord lengths downstream of the airfoil. However, in some cases at least, the wake evolves different characteristics further downstream.
(a) Wake regime map in the  $\alpha {-}Re$ parameter space, representing the three different wake regimes associated with an inclined airfoil, (b–g) various time-instantaneous and time-averaged wake patterns observed in the study. Red and blue colours shows negative (CW) and positive (CCW) streamwise vorticity, respectively. (b) Continuous vortex-sheet mode,
 $\alpha = 5.0^{\circ }$,
 $Re = 2000$. (c) Alternating vortex-shedding mode,
 $\alpha = 9.0^{\circ }$,
 $Re = 2000$. (d) Leftward alternating vortex-pair shedding mode,
 $\alpha = 11.0^{\circ }$,
 $Re = 2000$. (e) Neutral alternating vortex-pair shedding mode,
 $\alpha = 8.0^{\circ }$,
 $Re = 5000$. ( f) Rightward alternating vortex-pair shedding mode,
 $\alpha = 9.0^{\circ }$,
 $Re = 5000$. (g) Chaotic alternating vortex-pair shedding mode,
 $\alpha = 15.0^{\circ }$,
 $Re = 5000$.

With increasing  $\alpha$ from
 $0^\circ$, the regime wake map of figure 7(a) shows that the wake is initially in a continuous vortex-sheet mode for all the Reynolds numbers. Figure 7(b) shows that the wake in this mode is characterized by two opposite-sign vortex sheets attached to the airfoil and has similar time-instantaneous and time-averaged vorticity contours. With an increase in
 $\alpha$ to the critical value of
 $\alpha _{1}$, the regime wake map shows the first transition, where the wake transitions to an alternating vortex-shedding mode. The alternating vortex-shedding wake is similar to the BvK vortex street, with the only difference lying in the lateral leftward deviation of the vortices and the mean flow from the airfoil centreline, as shown in figure 7(c). The reason for this deviation is associated with the orientation of the airfoil's leading edge to the incoming free-stream flow. The time-instantaneous vorticity plot of figure 7(c) shows that the inclination of the leading edge causes the clockwise (CW) LEV to roll up and evolve into a larger vortex. In contrast, the counterclockwise (CCW) trailing-edge vortex is forced to wrap around towards the suction side of the airfoil. Thus, the shed CW and CCW vortices stretch unevenly, resulting in leftward asymmetry in the street.
With a further increase in  $\alpha$ to the critical value of
 $\alpha _{2}$, the regime wake map shows the next transition occurs to the alternating vortex-pair shedding mode. Unlike single vortices, paired vortices possess the characteristic of generating a local induced velocity on each other. These induced velocities result in the lateral deviation of the pair from its mean path. The direction of lateral deviation depends on the orientation of vortices within the dipole. In the present study we subcategorised the alternating vortex-pair shedding mode into four different kinds based on the lateral deviation and arrangement of the vortex cores in the wake. The first is termed the leftward alternating vortex-pair shedding street, which occurs at critical
 $\alpha _{2}$ and
 $ {\textit {Re}}=2000$, and is shown in figure 7(d). The figure shows that the pairing occurs far downstream of the airfoil and the CCW vortex is the leading vortex of the pair. Thus, the pair induces local velocities in the leftward lateral direction, resulting in leftward deviation of the paired vortex cores and the mean flow. Note that the leftward deviation of vortices is not very distinguishable for two reasons: (i) the deviation occurs in the same direction of the natural path of the vortices; and (ii) the relative distance between the vortices of the pair is large, which according to the Biot–Savart law results in smaller induced velocities and, thus, a smaller deviation of the vortex cores.
The neutral alternating vortex-pair shedding street is the second kind of paired vortex street observed in the wake beyond  $\alpha _{2}$ for
 $ {\textit {Re}} \geq 3000$ and
 $\alpha _{3}$ for
 $ {\textit {Re}}=2000$. The characteristics of this wake are depicted in figure 7(e). These include the pairing of vortices in the far wake, similar to the leftward alternating vortex-pair shedding street. However, the leading vortex of the pair is CW. Thus, the pair generates locally induced velocities in the rightward direction, bringing the vortex cores and the mean flow almost in line with the airfoil centreline. The third kind is termed the rightward alternating vortex-pair shedding street, which we observed for
 $ {\textit {Re}} \geq 3000$ beyond
 $\alpha _{3}$. The wake structure has its unique characteristics of possessing a constant shedding frequency with increasing
 $\alpha$, as discussed above and shown in figure 6. Further characteristic wakes are illustrated in figure 7( f). The figure shows that the vortex pair forms at the surface (suction side) of the airfoil. The formation of the vortex pair closer to the surface is due to both the high
 $ {\textit {Re}}$ and
 $\alpha$, generating a strong negative pressure on the airfoil suction side. This strong negative pressure causes the CCW tip vortex to roll up and form a pair with the oncoming CW LEV. In this newly formed vortex pair, the figure shows that the CW vortex is the leading vortex, which results in the rightward deviation of the vortex cores.
Finally, the chaotic alternating vortex-pair shedding street is the fourth kind of paired vortex street observed for those cases where the periodicity of the vortex shedding is lost, as discussed above and shown in figure 6. In particular, the characteristics of this wake structure are shown in figure 7(g). The figure shows that the strong suction pressure behind the airfoil causes the CW LEV to break into more than two vortices before it sheds from the airfoil surface, resulting in an unequal number of CW LEVs and CCW TEVs in the wake. Thus, all of the vortices cannot form pairs and this results in the random arrangement of paired and unpaired vortices.
The regime wake map of figure 7(a) also shows the flow state and 3-D transition boundaries as a function of  $ {\textit {Re}}$ and
 $\alpha$. The respective angle of attack at which transition occurs,
 $\alpha _{3D}$, is calculated numerically using Floquet stability analysis and discussed below in § 5. The regime wake map shows a decreasing
 $\alpha _{3D}$ with an increasing
 $ {\textit {Re}}$, and the corresponding relationship is given by
 \begin{equation} \alpha_{3D} \sim \frac{1}{\sqrt { {\textit{Re}}}}. \end{equation}
It is interesting to observe from figure 7(a) that 3-D transition occurs prior to but very close to the above discussed 2-D flow transition to the alternating vortex-pair shedding mode.
4. Time-averaged lift and drag coefficients at  $ {\textit {Re}} = 2000$ and $5000$


The onset of the wake transitions should also induce changes in the time-averaged force coefficients. Thus, in this section the variation and bifurcation of the time-averaged lift  $\bar {C}_{L}$ and drag
 $\bar {C}_{D}$ coefficients with increasing
 $\alpha$ are discussed, and their connection with the wake transitions established. Furthermore, for both Reynolds numbers examined in detail, the
 $\bar {C}_{L}{-}\alpha$ and
 $\bar {C}_{D}{-}\alpha$ relationships obtained from the 2-D simulations are compared with results from water-channel-based experiments and literature. Note that while detailed analysis is presented only for
 $ {\textit {Re}} = 2000$ and 5000, force coefficient variations obtained from 2-D simulations for other
 $ {\textit {Re}}$ are discussed in the Appendix.
For  $ {\textit {Re}}=2000$, the variations of
 $\bar {C}_{L}$ and
 $\bar {C}_{D}$ with increasing
 $\alpha$ are shown in figures 8(a) and 8(b), respectively. Figure 8(a) shows that the lift coefficient obtained from water-channel-based experiments increases almost linearly with
 $\alpha$, with a sudden change in trend at a critical angle,
 $\alpha _{2}$, where the wake transitions from the alternating vortex-shedding mode to the alternating vortex-pair shedding mode, as discussed above and shown in figures 6 and 7(a). Following
 $\alpha _{2}$,
 $\bar {C}_{L}$ again increases with
 $\alpha$, and a second change in trend is observed at
 $\alpha {\sim} 15^\circ$. A similar conclusion can be drawn by observing the variation of
 $\bar {C}_{D}$ with
 $\alpha$ in figure 8(b). However, for
 $\alpha <\alpha _{2}$, the variation is close to quadratic while, for
 $\alpha >15^\circ$, the variation is approximately linear.
Time-averaged (a,c) lift coefficient  $\bar {C}_{L}$, and (b,d) drag coefficient
 $\bar {C}_{D}$ with increasing angle of attack
 $\alpha$ for a NACA0012 airfoil at (a,b)
 $ {\textit {Re}}=2000$ and (c,d)
 $ {\textit {Re}}=5000$. In the plots
 $\alpha _2$ and
 $\alpha _3$ correspond to critical angles where a bifurcation occurs.

Similar  $\bar {C}_{L}{-}\alpha$ and
 $\bar {C}_{D}{-}\alpha$ variations can be seen for
 $ {\textit {Re}}=5000$ in figures 8(c) and 8(d), respectively, showing bifurcations at critical
 $\alpha = \alpha _{2}$ and
 $\alpha _{3}$, where the wake transitions to the neutral alternating vortex-pair shedding mode and the rightward alternating vortex-pair shedding mode, respectively.
Figures 8(a)–8(d) also compare the results from the 2-D spectral-element method with direct water-channel-based force measurements. The figures show that  $\bar {C}_{D}$ and
 $\bar {C}_{L}$ magnitudes match well at smaller angles of attack, but become significantly different at larger angles. For instance, the 2-D results for
 $\bar {C}_{L}$ fail to predict linear-to-quadratic change at
 $\alpha _{2}$ and then the quadratic-to-asymptotic transition at
 $\alpha {\sim} 15^\circ$ for
 $\bar {C}_{L}$ at
 $ {\textit {Re}}=2000$. Similarly, for
 $ {\textit {Re}}=5000$, the 2-D predictions do not show the enhancement in
 $\bar {C}_{L}$ with a slight increase in
 $\alpha$ at
 $\alpha _2$. Thus, for comparison, we performed another set of 2-D simulations using the level-set function-based immersed-interface method (Thekkethil & Sharma Reference Thekkethil and Sharma2019) and also compared the results based on the spectral-element method with the available 2-D literature in figures 8(a)–8(d). These show no difference in the predicted magnitudes of
 $\bar {C}_{D}$ and
 $\bar {C}_{L}$ from the different independent 2-D techniques. Therefore, this suggests that the flow transitions to 3-D flow, and thus, the assumption of flow two dimensionality becomes invalid. To investigate this, Floquet stability analysis is undertaken and discussed in the next section.
5. Floquet stability analysis
As discussed in the methodology, Floquet stability analysis is a tool for investigating the stability of a 2-D periodic flow to 3-D perturbations. In the present study the analysis was carried out with two objectives. The prime objective was to accurately predict the critical angle of attack,  $\alpha _{3D}$, and the corresponding non-dimensional wavelength,
 $\lambda /C$, at which the 2-D wake becomes linearly unstable to 3-D perturbations, indicating the onset of three dimensionality. The secondary objective was to look for modes that become unstable beyond the initial transition, as they may contribute to the fully saturated wake state at higher angles of attack. Here, the second critical angle is denoted
 $\alpha _{3D,2}$. Both the objectives have been approached by examining the modulus of the maximum Floquet multiplier at various
 $\lambda /C$ for the airfoil at attack angles past the 2-D Hopf bifurcation, i.e.
 $\alpha >\alpha _{1}$. The non-dimensional wavelength of the 3-D perturbation field is varied over the range
 $0 < \lambda /C \le 4$, since we expect any 3-D instability to occur within this range. This was decided after initial testing over a wider wavelength range.
5.1. The critical angle of attack, $\alpha _{3D}$, for 3-D transition

In this section Floquet stability analysis is performed to find the critical  $\alpha _{3D}$ at which the 2-D base flow becomes three-dimensionally unstable.
For a set of Reynolds numbers in the range  $500$–
 $5000$, figure 9 shows the variation of the modulus of the largest Floquet multiplier,
 $|\mu |$, with increasing spanwise wavelength,
 $\lambda /C$, for the airfoil at various angles of attack. For
 $ {\textit {Re}} = 500$, figure 9(a) shows that the largest Floquet multiplier for
 $\alpha = 18^\circ$ is less than 1, implying that the flow is stable for all infinitesimal 3-D perturbations, i.e. the 2-D periodic solution is also the stable solution to the 3-D Navier–Stokes equations. However, for
 $\alpha = 18.5^\circ$, there is a wavelength in which the largest Floquet multiplier is equal to 1, indicating the 2-D periodic solution is unstable. Thus,
 $\alpha \simeq 18.5^\circ$ is the critical
 $\alpha _{3D}$ for
 $ {\textit {Re}}=500$. Similarly, for
 $ {\textit {Re}} = 750$, 1000, 2000, 3000, 4000 and 5000, figures 9(b), 9(c), 9(d), 9(e), 9( f), 9(g) show
 $\alpha _{3D} \simeq 14.75^\circ, 13.1^\circ, 9.4^\circ, 7.9^\circ, 7^\circ$ and
 $6.1^\circ$, respectively. Thus, the present results show that
 $\alpha _{3D}$ decreases with an increasing
 $ {\textit {Re}}$ and the corresponding relationship is given above by (3.2) and plotted in figure 7(a).
Floquet multiplier magnitude versus spanwise wavelength for (a)  $Re=500$, (b)
 $Re=750$, (c)
 $Re=1000$, (d)
 $Re=2000$, (e)
 $Re=3000$, ( f)
 $Re=4000$ and (g)
 $Re=5000$. Solid lines show subharmonic (mode C) multiplier branches, dashed lines show complex (mode QP) multipliers and dash-dotted lines indicate synchronous (mode A) multiplier branches.

Interestingly, figure 9(a–g) also shows the same dominant mode at  $\alpha _{3D}$ for all the
 $ {\textit {Re}}$, however, manifesting at different non-dimensional wavelengths. As shown in the figures, the mode corresponds to a subharmonic mode (mode C) and is discussed in detail in § 6. Thus, mode C is the first unstable mode for all the
 $ {\textit {Re}}$ in the range 500–5000, which is reasonable to expect to arise from a base flow that does not possess
 $Z_{2}$ symmetry (i.e. reflectional symmetry about the centreline). We note that the present finding of the first unstable mode agrees with that found by Meneghini et al. (Reference Meneghini, Carmo, Tsiloufas, Gioria and Aranha2011), Deng et al. (Reference Deng, Sun and Shao2017) and He et al. (Reference He, Gioria, Pérez and Theofilis2017), even though those studies were conducted at a fixed
 $\alpha =20^\circ$ and with an objective of finding the critical
 $ {\textit {Re}}_{3D}$ at which the flow becomes three-dimensionally unstable at a high post-stall angle of attack. Thus, by combining the present results with those from the literature, we conclude that mode C is the first 3-D unstable mode that emerges in the wake of an airfoil by altering either of the fluid's governing parameters (
 $\alpha,Re$), which contrasts to mode A appearing first in a circular cylinder's wake.
5.2. The emergence of other 3-D modes beyond the initial instability
For a stationary circular cylinder, a second instability mode (mode B) emerges after the appearance of the first mode (mode A) (Miller & Williamson Reference Miller and Williamson1994; Barkley & Henderson Reference Barkley and Henderson1996; Thompson et al. Reference Thompson, Hourigan and Sheridan1996) and features strongly in the saturated 3-D wake beyond  $ {\textit {Re}} \simeq 230$–240. In this section the analysis is extended to find the critical
 $\alpha _{3D,2}$ at which we observe the second mode of instability. This investigation is undertaken only for
 $ {\textit {Re}}=2000$ and 5000. The variations of the largest Floquet multiplier with increasing non-dimensional spanwise wavelength are plotted in figures 10 and 11.
Modulus of Floquet multiplier  $|\mu |$ versus non-dimensional streamwise wavelength
 $\lambda /C$ for angles of attack
 $\alpha$ higher than
 $\alpha _{3D}$ at
 $ {\textit {Re}}=2000$. Solid lines show subharmonic (mode C) multiplier branches, dashed lines show complex (mode QP) multipliers and dash-dotted lines indicate synchronous (mode A) multiplier branches.

As for figure 10 at  $ {\textit {Re}}=5000$.

For  $ {\textit {Re}}=2000$, figure 10 shows a single dominant mode of instability, mode C, for
 $\alpha =9.5^\circ$ and
 $10^\circ$. However, the number of distinct dominant modes increases to three by increasing
 $\alpha$ to
 $\alpha _{3D,2}=11^\circ$. At
 $\alpha _{3D,2}$, an apparent mode C exists together with two other modes: mode A and mode QP. For
 $\lambda /C\leq 0.4$, the fastest growing instability is mode C. The fastest growing instability changes to mode A for
 $0.5\leq \lambda /C\leq 0.8$, and finally, the fastest growing instability changes to the quasi-periodic mode QP for
 $\lambda /C>0.8$. Notice from the figure that the secondary instability is faster growing for short spanwise wavelengths compared with long spanwise wavelengths. Furthermore, of the first three unstable modes, the smallest wavelength mode is the first to become unstable. Thus, the trend is in contrast to that for a circular cylinder (Barkley & Henderson Reference Barkley and Henderson1996; Williamson Reference Williamson1996a) and normal flat plate (Thompson et al. Reference Thompson, Hourigan, Ryan and Sheard2006), where the long wavelength mode is faster growing at
 $ {\textit {Re}}>Re_{3D}$.
For  $ {\textit {Re}}=5000$, figure 11 shows the different modes of 3-D instability occurring for the airfoil at
 $\alpha >\alpha _{3D}$ and
 $ {\textit {Re}}=5000$. For
 $\alpha \leq 7^\circ$, mode C appears to be the only unstable mode. However, at the critical
 $\alpha _{3D,2}=8.0^\circ$, mode C exists together with mode QP. For
 $\lambda /C<0.2$, mode QP is the fastest growing instability, while the fastest growing instability mode changes to mode C at
 $\lambda /C>0.2$. Furthermore, notice here that the 3-D secondary instability is faster growing for long spanwise wavelengths compared with short spanwise wavelengths, which is in contrast to the case for
 $ {\textit {Re}}=2000$.
Figures 10 and 11 also show that QP is the second mode to become unstable. This is consistent with predictions of Meneghini et al. (Reference Meneghini, Carmo, Tsiloufas, Gioria and Aranha2011); they also observed mode QP as the second emerging mode at a fixed  $\alpha = 20^\circ$. Thus, we conclude that mode QP is the second 3-D mode to emerge in an airfoil wake undergoing shedding. This contrasts with mode B for a circular cylinder wake.
By observing figures 10 and 11, one can notice that the magnitude of maximum Floquet multiplier increases, and the dominant mode (mode C) shifts to a higher wavelength with increasing  $\alpha$. This same observation was made for different NACA00XX airfoils at fixed
 $\alpha =20^\circ$ subject to varying
 $ {\textit {Re}}$ by He et al. (Reference He, Gioria, Pérez and Theofilis2017); the flow physics is discussed in § 6.1.
6. Mode characteristics
In this section the characteristics of each mode are presented through the perturbation streamwise and spanwise vorticity fields at different phases of the base-flow period. This highlights various symmetries, and similarities and differences between the modes, with some discussion on their physical cause and comparison with other bluff-body wakes.
6.1. Mode C
Mode C is a true subharmonic mode with its Floquet multiplier exiting the unit circle through  $-1$ on the real axis as Re is increased. Along with the spatial distribution of the mode, this is apparent through inspection of figure 12. It shows the streamwise and spanwise perturbation vorticity fields for
 $\alpha =9.5^\circ$,
 $ {\textit {Re}}=2000$ and
 $\lambda =0.2C$. In the near wake the structure is similar to that of mode B of a circular cylinder, with a high amplitude of the perturbation field in the base-flow braid region. In addition, the structure shows similarities to mode A in the far wake with the perturbation field mostly concentrated in the base-flow core regions. Both the spanwise and streamwise fields show that the perturbation vorticity structure repeats over two shedding cycles, with its sign alternating over one shedding cycle (
 $T$). The isosurface of streamwise perturbation vorticity (shown in figure 12d) further highlights the streamwise vorticity changing sign every period. Clearly, the mode is indeed subharmonic and possesses the spatio-temporal symmetry, shown here by using the streamwise perturbation vorticity
 $(\tilde {\omega }_{x})$, corresponding to
 \begin{equation} \tilde{\omega}_{x}(x,y,z,t)=\tilde{\omega}_{x}(x,y,z,t+2T). \end{equation}
The near-wake topology for mode C at  $\alpha =9.5^\circ$ for
 $ {\textit {Re}}=2000$ and
 $\lambda =0.2C$. (a–c) The colour contour of the left column (a (i)–c (i)) represents the spanwise perturbation vorticity, and the right column (a (ii)–c (ii)) represents the streamwise perturbation vorticity field. The 2-D base flow is outlined by solid contour lines. (d) Isosurface of the streamwise perturbation vorticity contours
 $(\tilde {\omega }_{x}=\pm 1)$ using
 $Q=1$ for mode C. Results are shown for (a (i))
 $t = 0.0T$, (a (ii))
 $t = 0.0T$, (b (i))
 $t = 1.0T$, (b (ii))
 $t = 1.0T$, (c (i))
 $t = 2.0T$, (c (ii))
 $t= 2.0T$.

The earlier experimental observation of mode C was revealed by Sheard et al. (Reference Sheard, Thompson and Hourigan2003), who also used Floquet stability analysis to predict it to be the first occurring non-axisymmetric instability for a torus of aspect ratio  $4\leq AR\leq 8$. Here,
 $AR$ is defined as the ratio of the mean to the cross-section diameter. Later, Sheard et al. (Reference Sheard, Thompson, Hourigan and Leweke2005) demonstrated that this mode leads to period doubling in the wake. Although the base-flow topology in the torus wake is distinctly different to that of an inclined airfoil, the characteristics of the perturbation fields are found to be consistent. This is because in both cases, the symmetry of the flow about the centreline is broken because the body geometry also breaks this symmetry.
Increasing the angle of attack of the airfoil or the Reynolds number has a significant effect on the value of the fastest growing wavelength  $\lambda ^{*}$. This is shown in figures 13(a) and 13(b), which exhibit an increase in
 $\lambda ^{*}$ with increasing
 $\alpha$ and a decrease in
 $\lambda ^{*}$ with increasing
 $ {\textit {Re}}$, respectively. A possible explanation for these trends is given here by comparing them with those for a circular cylinder. In that case, Williamson (Reference Williamson1996a,Reference Williamsonb) suggested that the wavelength scales with the vortex core diameter for mode A and the width of braids between the cores for mode B instability. As has been pointed out above, the perturbation vorticity of mode C shows characteristics of both modes A and B. With increasing
 $\alpha$, figure 14 shows that the LEV roll up occurs further upstream, resulting in generating vortices of larger diameter in the near wake. This is consistent with the increased frontal area (height) seen by the flow as the angle is increased, which is related to the size of the forming vortices. On the other hand, the right column of the figure shows that increasing
 $ {\textit {Re}}$ reduces the vortex core size because of reduced diffusion. In addition to this effect, at higher Reynolds numbers transition occurs at lower angles, also resulting in smaller wake vortex cores. Thus, one could expect a larger instability wavelength at higher attack angles, and a lower wavelength at higher Reynolds numbers.
Variation of fastest growing wavelength for mode C (a) with increasing angle of attack  $\alpha$ at
 $ {\textit {Re}}=2000$, (b) with increasing Reynolds number
 $ {\textit {Re}}$ at
 $\alpha =9.5^\circ$.

Variation of base-flow topology (a (i)–c (i)) with increasing angle of attack  $\alpha$ at Reynolds number
 $ {\textit {Re}}=2000$; (a (ii)–c (ii)) with increasing
 $ {\textit {Re}}$ at
 $\alpha =9.5^\circ$. Results are shown for (a (i))
 $\alpha =9.5^\circ,\ Re=2000$, (a (ii))
 $\alpha =9.5^\circ, Re=2000$, (b (i))
 $\alpha =10^\circ,\ Re=2000$, (b (ii))
 $\alpha =9.5^\circ,\ Re=3000$, (c (i))
 $\alpha =11^\circ,\ Re=2000$, (c (ii))
 $\alpha =9.5^\circ, Re=5000$.

6.2. Mode A
Mode A is a synchronous 3-D instability, i.e. the critical Floquet multiplier exits the unit circle through +1 along the positive real axis in the complex plane (Blackburn, Lopez & Marques Reference Blackburn, Lopez and Marques2004). For a circular cylinder, it is known to be the first 3-D instability and, thus, responsible for 3-D transition. The physical mechanism responsible for developing this instability has been speculated to be associated with an elliptic instability in the near wake (Leweke & Williamson Reference Leweke and Williamson1998; Thompson et al. Reference Thompson, Leweke and Williamson2001b).
For the present case, the streamwise and spanwise perturbation vorticity fields for mode A at  $\alpha =11.0^\circ$,
 $ {\textit {Re}}=2000$ and
 $\lambda =0.65C$ are shown in figure 15. The figure shows that both the perturbation fields are stronger within the vortices of the base flow. Actually, the instability only approximately preserves the spatio-temporal symmetry seen with mode A because the airfoil is at an angle to the oncoming flow. This approximate spatio-temporal symmetry can be seen as the swapping of the sign of the perturbation field on the outer side of two consecutive base-flow vortices. Thus, the perturbation field is similar in characteristics to that of the wake of a stationary circular cylinder as discussed by Thompson et al. (Reference Thompson, Leweke and Williamson2001b), and the spatio-temporal symmetry is given by
 \begin{equation} \tilde{\omega}_{x}(x,y,z,t) \simeq{-}\tilde{\omega}_{x}(x,-y,z,t+T/2). \end{equation}
(a (i), b (i)) Spanwise perturbation vorticity for mode A at  $\alpha =11^\circ$ for
 $ {\textit {Re}}=2000$ and
 $\lambda =0.65C$; (a (ii), b (ii)) streamwise perturbation vorticity field for the same condition. Results are shown for (a (i))
 $t = 0.0T$, (a (ii))
 $t = 0.0T$, (b (i))
 $t = 1.0T$, (b (ii))
 $t = 1.0T$.

6.3. Mode QP
The spatial features of mode QP at least superficially appear similar to those of mode C; however, the period of the perturbation field is not twice the base-flow period. This is verified through a sequence of streamwise perturbation vorticity snapshots at  $\alpha =11.0^\circ$,
 $ {\textit {Re}}=2000$ and
 $\lambda =1.5C$ shown in figure 16. This shows that the perturbation field structure approximately repeats itself over fifteen base periods. As the field evolves, it shows growth and decay from one base-flow period to the next. This can be seen, for instance, by examining the positive regions of the perturbation field (shown in blue) at the tail and the negative regions (shown in red) at the upper surface of the airfoil. With increasing time from
 $t = 0.0T$, the figure shows that the magnitude of the positive perturbation field near the tail gradually weakens, and eventually changes sign after
 $t = 4.0T$. In contrast, the negative field near the upper surface grows from
 $t = 0.0T$ to
 $t = 4.0T$ and then weakens from
 $t = 4.0T$ and finally changes its sign at
 $t = 8.0T$. Hence, we observe a similar structure of streamwise perturbation field after eight base cycles, but with the opposite sign. A similar evolution for the negative and positive regions of the perturbation field can be observed from
 $t = 8.0T$ to
 $t = 15.0T$. Thus, the mode is truly quasi-periodic with a period (approximately) fifteen times that of the base flow, noting that the exact period changes with angle and Reynolds number.
The near-wake topology for mode QP at  $\alpha =11^\circ$ for
 $ {\textit {Re}}=2000$ and
 $\lambda =1.5C$. The colour contours represent (a–i) are set at one base-flow period apart and should be read top to bottom, left to right. The colour contour represents the streamwise perturbation vorticity field, whereas solid contour lines outline the base flow. Results are shown for (a)
 $t = 0.0T$, (b)
 $t = 2.0T$, (c)
 $t = 4.0T$, (d)
 $t = 6.0T$, (e)
 $t = 8.0T$, ( f)
 $t = 10.0T$, (g)
 $t = 12.0T$, (h)
 $t = 14.0T$, (i)
 $t = 15.0T$.

7. Three-dimensional simulations
While this study is focused in determining the stability of airfoil wakes and, in particular, in determining the critical angles of attack and Reynolds numbers of transitions, it is of interest to explore the post-critical wake evolution. Direct simulations were performed for the highest-Reynolds-number case of  $ {\textit {Re}}= 5000$ to examine the wake evolution beyond the critical angle of attack of
 $\alpha \simeq 6.1^\circ$. The 3-D simulations were undertaken using the spectral (spanwise)/spectral-element (cross-stream) method described previously. In effect, the 2-D spectral-element method is extended to three dimensions using a Fourier expansion in the spanwise direction to account for the spanwise variation (see Karniadakis & Triantafyllou Reference Karniadakis and Triantafyllou1992; Thompson et al. Reference Thompson, Hourigan and Sheridan1996). These relatively expensive simulations used 196 Fourier planes across a span of one chord length, noting the use of a Fourier representation enforces spanwise periodicity. This spanwise domain length and resolution should be sufficient to capture the wavelengths and harmonics of the main instability modes detected through the Floquet analysis (
 $0.1 \lesssim \lambda /C \lesssim 0.3$), while also noting that simulations using 384 planes showed no discernible differences.
Figure 17 shows saturated wakes visualised using the  $Q$ criterion (Hunt, Wray & Moin Reference Hunt, Wray and Moin1988) with
 $Q=0.1$ for
 $\alpha = 6.5$, 7.0, 7.5, 8.0 and
 $9.0^\circ$. Note that the spanwise variation has been duplicated across a span of
 $3C$ to better highlight the complexity of the wake structures. In this figure the images below the 3-D isosurface visualisations show the spanwise-averaged spanwise vorticity fields at the same times as the isosurface plots together with their 2-D counterparts at similar times. For small increments past the instability onset angle, e.g. at
 $\alpha =6.5^\circ$, the saturated wake is not strongly affected by the initial instability mode; the wake almost appears to consist of a linear combination of the instability mode and 2-D base flow; however, at saturation, the streamwise braid vortices clearly form pairs rather than consisting of uniformly distributed positive and negative vortices across the span. At
 $\alpha =7.0$, the saturated wake is much more complex. The initial short instability wavelength, visible in the braid regions between the first shed spanwise pair, appears to double as the wake evolves downstream and nonlinear interactions affect wake development. In this case, the wake still maintains a regular spanwise structure as the wake structure advects further downstream. By
 $\alpha =8.0$, the wake has become chaotic, with smaller-scale features although coherent larger-scale braid vortices are still present. The trend continues for
 $\alpha =9.0$. Here, shorter wavelength streamwise braid vortices can be seen near the rollers close to the trailing edge in addition to the longer wavelength structures further downstream.
(a) Saturated states of the airfoil wake at  $ {\textit {Re}}=5000$ for
 $\alpha = 6.5^{\circ }$ (i, iv, vii),
 $7.0^{\circ }$ (ii, v, viii) and
 $7.5^{\circ }$ (iii, vi, ix) depicted using an isosurface of
 $Q=0.1$. The images immediately below show spanwise-averaged spanwise vorticity fields of these 3-D wakes and matching wakes from 2-D simulations. (b) Same as (a) except for
 $\alpha = 8.0^{\circ }$ and
 $9.0^{\circ }$.

The figure also shows the evolution of the spanwise-averaged spanwise vortices as the angle of attack is increased with the wakes from 2-D simulations shown for comparison. At  $\alpha =6.5$, the averaged vortex street is little different from the 2-D base flow (see figure 17). In fact, as the angle is increased up to
 $\alpha =9.0$, the same global wake structures predicted by the 2-D simulations are maintained but with increasing irregularity/distortion of the spanwise vortices. The transition from a downwards-directed wake (
 $\alpha =6.5$, 7.0) to an upwards-directed wake (
 $\alpha =8.0$ and 9.0) is also maintained. Even the transition state between these two at
 $\alpha =7.5^\circ$ is also seen in the 3-D spanwise-averaged fields. Thus, perhaps surprisingly, even well beyond 3-D transition, the spanwise-averaged wakes show the same characteristic vortex-street states predicted by the 2-D simulations.
8. Conclusions
The present study documents and contributes towards understanding the various flow transitions occurring in a thin-airfoil wake over a parameter space covering  $\alpha < 20^\circ$ and
 $ {\textit {Re}} \le 5000$. This can assist other researchers with understanding the validity of assuming 2-D or near 2-D flow for both fundamental and applied problems related to flows around symmetric airfoils.
The 2-D wake was found to undergo a Hopf bifurcation – a steady to periodic transition – according to the relationship  $\alpha _1 \simeq 690 {\textit {Re}}^{-0.65}$. For enforced 2-D flow beyond this initial transition, different wake states are identified and broadly categorised into three different modes. The descriptions are similar to those presented by Kurtulus (Reference Kurtulus2016), with classification based on the instantaneous vortex structure, non-dimensional frequency and aerodynamic force coefficients. These are the continuous vortex-sheet mode, alternating vortex-shedding mode and alternating vortex-pair shedding mode. However, compared with the lower-Reynolds-number classification of Kurtulus (Reference Kurtulus2016), we need to further characterize the alternating vortex-pair shedding mode into three sub-modes: (i) a leftward alternating vortex-pair shedding mode, (ii) a neutral alternating vortex-pair shedding mode and (iii) a rightward alternating vortex-pair shedding mode. These different wake structures and transitions are recorded on a regime wake map, and their characteristics are discussed in detail.
To investigate the onset of three dimensionality in a NACA0012 airfoil wake, Floquet stability analysis was performed for angles of attack past the 2-D Hopf bifurcation at which shedding commences. It is found that 3-D transition occurs at a critical angle of attack,  $\alpha _{3D}$, whose variation with
 $ {\textit {Re}}$ is approximately given by
 $\alpha _{3D} {\sim} 1/ \sqrt { {\textit {Re}}}$. By checking the Floquet multiplier and wake symmetries, it is observed that the first unstable mode for
 $500 \le {\textit {Re}} \le 5000$ is a subharmonic mode, mode C, i.e. its period is twice that of the base flow. Thus, by drawing together the present results with previous studies on hydrofoils/airfoils, we conclude that mode C is the first 2-D wake mode that emerges on increasing either of the governing parameters (
 $\alpha,Re$) of the flow. Higher-order (i.e. non-dominant) modes were also investigated, noting that the remnants of mode B, the second occurring mode, appears to be more apparent in much higher-Reynolds-number circular cylinder wakes than the first occurring mode A. The critical angle for the second 3-D instability is denoted by
 $\alpha _{3D,2}$. For
 $ {\textit {Re}}=2000$,
 $\alpha _{3D,2} \approx 11.0^\circ$. In that case the dominant mode (Mode C) exists together with two other unstable modes: Modes A and QP. In contrast, for
 $ {\textit {Re}}=5000$,
 $\alpha _{3D,2}$ reduces to
 $8.0^\circ$, where the dominant mode (mode C) exists together with mode QP. Finally, the characteristics of all these observed 3-D instability modes are discussed along with their physical cause and a comparison with other bluff-body wake transitions.
Of interest, the transition from the alternating vortex-shedding mode to the alternating vortex-pair shedding mode predicted from 2-D modelling occurs beyond the critical angle for 3-D transition, posing the question of whether such post-critical 2-D predictions have any relevance to real flows. On this point, full 3-D simulations indicate that the predicted 2-D vortex-street structures are reasonably maintained in the 3-D saturated wakes in a spanwise-averaged sense. Beyond this, the 3-D simulations indicate a complex transition scenario where the instability modes interact nonlinearly as the wake advects downstream, although some underlying order is maintained with coherent streamwise vortices persisting between the dominant distorted spanwise vortical structures.
Funding
This work was supported by computational resources provided by the Australian Government through the National Computational Infrastructure (NCI) and Pawsey Supercomputer Centre (Merit Grants n67 and d71) under the National Computational Merit Allocation Scheme. It was supported by the Australian Government through the Australian Research Council's Discovery Projects funding scheme (projects DP190103388, DE200101650, DP200100704 and DP210100990).
Declaration of interests
The authors report no conflict of interest.
Appendix. Time-averaged lift and drag coefficients
The discussion of the relationship between the wake transition, non-dimensional frequency of shedding  $St$, and the time-averaged lift
 $\bar {C}_{L}$ and drag
 $\bar {C}_{D}$ coefficients obtained from the 2-D spectral-element method-based simulations is extended here in this section. The variation of
 $\bar {C}_{D}$ and
 $\bar {C}_{L}$ with an increasing
 $\alpha$ is shown in figure 18(a,b) for
 $ {\textit {Re}} \leq 1000$ and in figure 18(c,d) for
 $ {\textit {Re}} \geq 2000$, respectively. This is done here to easily visualize bifurcations/jumps in the curves of low
 $ {\textit {Re}}$, which may become indistinguishable if shown together with high
 $ {\textit {Re}}$ curves due to their high magnitudes.
Time-averaged (a,c) drag coefficient  $\bar {C}_{D}$, and (b,d) lift coefficient
 $\bar {C}_{L}$ with increasing angle of attack
 $\alpha$ for a NACA0012 airfoil at (a,b)
 $500 \leq {\textit {Re}} \leq 1000$ and (c,d)
 $2000 \leq {\textit {Re}} \leq 5000$.

Figure 18(a) shows an apparent increasing  $\bar {C}_{D}$ with an increasing
 $\alpha$ of an airfoil with a sudden jump or change in slope at critical
 $\alpha _1$ for all
 $ {\textit {Re}}$. The jump is higher for higher
 $ {\textit {Re}}$ such that it changes the trend for the variation with
 $ {\textit {Re}}$ – from a decreasing
 $\bar {C}_{D}$ with an increasing
 $ {\textit {Re}}$ below
 $\alpha _1$ to an increasing
 $\bar {C}_{D}$ with an increasing
 $ {\textit {Re}}$ above
 $\alpha _1$. A similar conclusion can be drawn by observing the variation of
 $\bar {C}_{L}$ with
 $\alpha$ in figure 18(b). Thus, for
 $ {\textit {Re}} \leq 1000$, only one distinctive bifurcation is visible for the time-averaged engineering parameters, which is at
 $\alpha _1$, similar to the
 $St{-}\alpha$ bifurcation (refer to figure 6) and wake transition (refer to figure 7a) as discussed above in § 4. The present variation of the force coefficients with
 $\alpha$ at
 $ {\textit {Re}} = 1000$ matches well with the result given by Kurtulus (Reference Kurtulus2015), as shown in figure 18(a,b).
For  $ {\textit {Re}} \geq 2000$, figure 18(c,d) shows a similar variation of increasing
 $\bar {C}_{D}$ and
 $\bar {C}_{L}$ and sudden jumps at critical
 $\alpha$ with increasing angle of attack
 $\alpha$. However, as expected, the number of jumps/bifurcations is higher. These critical angles of attack are shown in figure 18(d). The figure shows that the first jump occurs at critical
 $\alpha _1$, where the trend changes from larger
 $\bar {C}_{L}$ at lower
 $ {\textit {Re}}$ to larger
 $\bar {C}_{L}$ at larger
 $ {\textit {Re}}$. The second jump occurs at critical
 $\alpha _2$. However, both of these jumps are not very significant compared with the third jump occurring at
 $\alpha _3$ for
 $ {\textit {Re}} \geq 3000$. Thus, the time-averaged curves show two transitions for
 $ {\textit {Re}} = 2000$ and three transitions for
 $Re > 2000$, which is similar to the
 $St{-}\alpha$ bifurcation (refer to figure 6) and wake transition (refer to figure 7a) as discussed above in § 4.


 Open access

