Introduction
Leafy spurge is an invasive perennial weed introduced from Eurasia that is a serious problem in the western rangelands of North America (Bourchier et al. Reference Bourchier, Hansen, Lym, Norton, Olsen, Randall, Schwarzländer and Skinner2006). The plant forms dense monocultures that displace beneficial native forage plants on rangelands, thereby reducing not only the value of grazing land (Lym Reference Lym1998) but the habitat for wildlife that rely on these plant species. Leafy spurge, which contains a milky latex that is poisonous to some animals, including cattle, elk, and deer (Stitt et al. Reference Stitt, Root, Brown, Hager, Mladinich, Anderson, Dudek, Bustos and Kokaly2006), is of particular concern to the cattle industry. Leafy spurge was one of the top three rangeland weeds in Montana and contributed to economic reductions of $7,243 annually, for an average grazing unit of 2,046 ha in Montana (Mangold et al. Reference Mangold, Fuller, Davis and Rinella2018). The economic impact from leafy spurge in the four states of the Northern Great Plains (Montana, Wyoming, North and South Dakota) is estimated to be more than $120 million annually (Leistritz et al. Reference Leistritz, Bangsund and Hodur2004).
As an introduced invasive plant affecting large areas beyond the physical and economic scopes of traditional management activities, leafy spurge was one of the early targets for biological control (Bourchier and Van Hezewijk Reference Bourchier, Van Hezewijk, Mason and Gillespie2013). At least 14 biological control agents have been released in North America (Bourchier and Van Hezewijk Reference Bourchier, Van Hezewijk, Mason and Gillespie2013), with the most important of these being the root-feeding beetles in the genus Aphthona (Lym and Nelson Reference Lym and Nelson2002). These insects have had significant impact on spurge root biomass (Kirby et al. Reference Kirby, Carlson, Krabbenhoft, Mundal and Kirby2000), resulting in significant reductions in spurge stem densities at release locations and the gradual restoration of native seed banks (Thilmony and Lym Reference Thilmony and Lym2017).
Effective control of leafy spurge and the evaluation of management activities such as herbicide applications and biological control require monitoring leafy spurge’s distribution and spread (Casady et al. Reference Casady, Hanley and Seelan2005). At the scale of the leafy spurge invasion, ground monitoring for new infestations and spread is prohibitively expensive and thus a variety of remote sensing data have been assessed for leafy spurge detection. This has included conventional aerial color (red, green, blue [RGB]) and color-infrared photographs (Anderson et al. Reference Anderson, Everitt, Escobar, Spencer and Andrascik1996; Everitt et al. Reference Everitt, Anderson, Escobar, Davis, Spencer and Andrascik1995), hyperspectral airborne visible–infrared imaging spectrometry (AVIRIS) (Hunt et al. Reference Hunt, Daughtry, Kim and Parker-Williams2007; Parker-Williams and Hunt Jr. Reference Parker-Williams and Hunt2002, Reference Parker-Williams and Hunt2004), Hymap imaging (Glenn et al. Reference Glenn, Mundt, Weber, Prather, Lass and Pettingill2005; Mitchell and Glenn Reference Mitchell and Glenn2009; Mundt et al. Reference Mundt, Streutker and Glenn2007), multispectral Landsat (Hunt et al. Reference Hunt, Daughtry, Kim and Parker-Williams2007; Mitchell and Glenn Reference Mitchell and Glenn2009; Mladinich et al. Reference Mladinich, Bustos, Stitt, Root, Brown, Anderson and Hager2006), Advanced Land Imager data (Stitt et al. Reference Stitt, Root, Brown, Hager, Mladinich, Anderson, Dudek, Bustos and Kokaly2006), IKONOS satellite imagery (Casady et al. Reference Casady, Hanley and Seelan2005), and Satellite pour d’Observation de la Terre (SPOT) imagery (Hunt et al. Reference Hunt, Daughtry, Kim and Parker-Williams2007). The accuracy of leafy spurge detection in these studies ranged from 38% to 97%. This large variation can be attributed to differences in the type of imagery, the detection methods applied and/or leafy spurge patch size and density at the study site. Generally, the use of high spatial or spectral imagery resulted in superior detection accuracy due to the capacity of these techniques to capture small patches of leafy spurge (Casady et al. Reference Casady, Hanley and Seelan2005) or to separate leafy spurge from other land-cover types at the site (Glenn et al. Reference Glenn, Mundt, Weber, Prather, Lass and Pettingill2005). Despite the potential, the routine use of such imagery for monitoring leafy spurge in management programs or for detecting new spurge infestations has been limited. The imagery is costly for the large areas requiring coverage and scheduling image acquisition to coincide with peak flowering can be challenging because cloud cover can limit the ability to acquire images.
Advances in unmanned aerial vehicle (UAV) technology and UAV-based sensors offer an alternative platform for capturing high spatial-resolution data at lower cost with increased flexibility in comparison with high spatial-resolution airborne or satellite imagery. RGB images acquired from UAV platforms have been successfully applied in mapping of invasive species such as yellow flag iris (Iris pseudacorus L.), water hyacinth [Eichhornia crassipes (Mart.) Solms], tropical soda apple (Solanum viarum Dunal), serrated tussock [Nassella trichotoma (Nees) Hack.], and giant hogweed (Heracleum mantegazzianum Sommier & Levier) (Baron et al. Reference Baron, Hill and Elmiligi2018; Dvořák et al. Reference Dvořák, Müllerová, Bartaloš and Bruna2015; Hill et al. Reference Hill, Tarasoff, Whitworth, Baron, Bradshaw and Church2017; Hung et al. Reference Hung, Xu and Sukkarieh2014). UAV systems offer the potential to acquire very high spatial-resolution images, with changes in spatial resolution being available by adjusting flight heights. However, there is an inverse relationship between image spatial resolution and ground area coverage: as flight height increases, spatial resolution becomes coarser but the ground area covered becomes larger. An inherent problem associated with decreasing spatial resolution is the mixed spectral information in a single pixel, which reduces the ability to separate land cover classes and, thus, the detection accuracy. In contrast, decreasing flight height improves spatial resolution of the images, but additional flights may be required to cover the target area and there is a concurrent increase in the amount of data to be processed. Thus, identifying the optimal UAV flight height to minimize flight times and data processing while still providing adequate spatial resolution to successfully identify the groundcover targets is an important research question.
Previous studies on mapping vegetation with UAV images explored the influence of flight height on weed and crop detection (Peña et al. Reference Peña, Torres-Sánchez, Serrano-Pérez, de Castro and López-Granados2015; Tamouridou et al. Reference Tamouridou, Alexandridis, Pantazi, Lagopodi, Kashefi and Moshou2017; Torres-Sánchez et al. Reference Torres-Sánchez, López-Granados, de Castro and Peña-Barragán2013). Torres-Sánchez et al. (Reference Torres-Sánchez, López-Granados, de Castro and Peña-Barragán2013) mapped vegetation fractional cover in wheat fields using images captured at flight heights of 30 m and 60 m that provided 1.14-cm and 2.28-cm spatial resolution, respectively. Slightly greater mapping accuracy was achieved with the 30-m (range, 88% to 92%) compared with the 60-m (range, 84% to 88%) height. Peña et al. (Reference Peña, Torres-Sánchez, Serrano-Pérez, de Castro and López-Granados2015) compared the performance of UAV images acquired at four flight heights (40, 60, 80, and 100 m) for weed detection in sunflower fields and found that the highest accuracy (range, 68% to 77%) was obtained with images acquired at 40 m with a spatial resolution of 1.52 cm. Instead of changing the flight height to obtain different spatial resolutions of UAV images, Tamouridou et al. (Reference Tamouridou, Alexandridis, Pantazi, Lagopodi, Kashefi and Moshou2017) resampled a 0.1-m spatial resolution image to produce spatial resolutions of 0.5-m, 1-m, 1.5-m, and 2-m images and then compared their performance for detecting milk thistle weed patches. There was a slight difference in the overall accuracy (range, 81% to 87%) among the first three spatial resolutions (0.1 m to 1.5 m) and a lower accuracy (78%) at 2-m resolution.
The overall objective of the research reported here was to evaluate the use of images collected from a UAV platform for mapping the spatial distribution of flowering leafy spurge. Our specific operational interest was to determine if UAV images could be used to evaluate spurge density with enough accuracy that a time series of UAV images collected at a single point where the release of biocontrol agents was implemented could be used to assess changes in spurge density. Our specific objectives included (1) testing the influences of different UAV flight heights and acquisition times on mapping flowering leafy spurge; (2) comparing two image analysis methods: mixture tuned matched filtering (MTMF) and the hue, intensity and saturation (HIS) threshold method for detection of flowering leafy spurge; and (3) field testing to compare flowering leafy spurge cover estimates from the UAV with ground data for operational detection of changes in leafy spurge density. The goal is to develop a cost-effective tool based on UAV RGB images, which can be used routinely to monitor leafy spurge and aid in evaluating management activities such as biological control.
Materials and Methods
Study Site
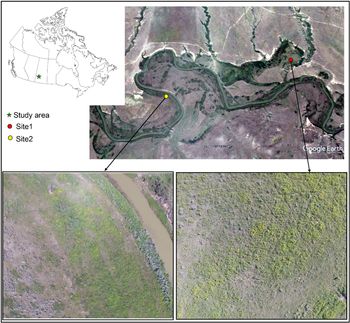
The study was conducted at two field sites (site 1: 49.34°N, 108.37°W; site 2: 49.33°N, 108.39°W) located in the Frenchman River watershed, southern Saskatchewan, with known leafy spurge populations (Figure 1). This area is composed of extensive rangeland pastures with leafy spurge patches being found along the river and tributaries that flow into the river. Both sites were 900 m2 (30 m × 30 m). Elevation of the two sites is approximately 875 m and ground topography is generally level, with a slope ranging from 0.5% to 5%. The soil types are Alluvium with a sandy loam soil surface texture at site 1 and a Brown Chernozem with clay loam soil surface texture at site 2 [SSIS 2019]. The area has a continental climate, with a hot and dry summer and cold winter. The annual precipitation is 347 mm and average temperature is 5 C. Similar vegetation grows at both sites and is composed of mostly leafy spurge, smooth brome grass (Bromus inermis Leyss), and western snowberry (Symphoricarpos occidentalis Hook).
Study area in the Frenchman River watershed, southern Saskatchewan. The image at the top (from Google Earth) indicates the location of the two sites. The two images (red-green-blue color composites) at the bottom, representing sites 1 and 2, were captured using the unmanned aerial vehicle platform on July 30, 2016. The yellow in the images is flowering leafy spurge.

Leafy spurge in the field generally starts to flower in the middle of June and continues to bloom throughout July and into August. The flowering period varies among years depending on moisture availability. The spurge sites were selected because they were part of a study on the impact of the biological control agent Aphthona lacertosa, a chrysomelid beetle, on leafy spurge. Releases of 2,000 adult beetles occurred on July 2, 2014, in the spurge patches monitored with the UAV. Ground sampling of leafy spurge density and cover was conducted at both sites.
UAV Platform, Camera, and Imagery
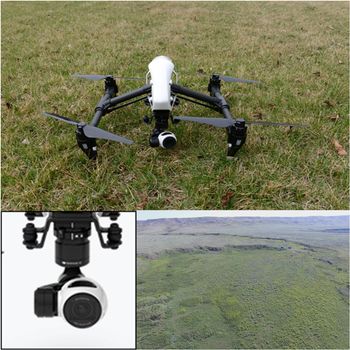
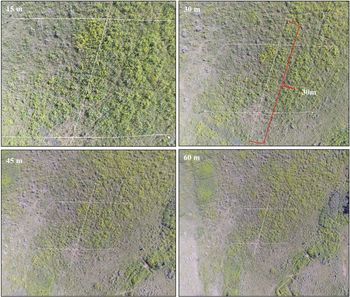
A Zenmuse X3 camera mounted on a DJI Inspire 1 quadcopter UAV [DJI, Shenzhen, China] was used to collect the imagery. The camera acquires 12 megapixel images in true RGB color space with 8-bit radiometric resolution (Figure 2). UAV images were acquired on two dates, July 30, 2016, and June 28, 2017, at the two study sites (sites 1 and 2). Before image acquisition, permission was obtained from the private landowner. In 2016, at both sites, UAV images were collected at four different flight heights: 15 m, 30 m, 45 m, and 60 m (Figure 3). At site 1, the images were collected between 9:12 and 9:15 AM and again between 11:01 and 11:04 AM for a total of eight images. At site 2, UAV images were acquired between 12:43 and 12:46 PM. In 2017, one image at each site was acquired. The image was collected between 11:18 and 11:20 AM at a flight height of 16 m at site 1 and between 3:47 and 3:50 PM at a flight height of 23 m at site 2. No coordinate information was available for the acquired images, so the spatial resolution of all images was estimated using the following formula (Equation 1) (Gunn Reference Gunn2016):
 $$p = {{\theta \left( {{{2\pi } \over {360}}} \right) \times {\rm{r}}} \over {{N_{xy}} \times {\rm{g}}}}$$
where p is the spatial resolution of the image or pixel size, θ is the field of view of the lens in degrees, r is the altitude in meters (above ground level) for a flight, Nxy is the number of pixels in the x or y direction, and g is the effective pixel cover (assumes 90% of pixels can be used to avoid distortion at the edges of the photograph). The characteristics of the images collected at the two sites are summarized in Table 1.
The unmanned aerial vehicle system (top), camera (bottom left) and true color image of the site (bottom right).

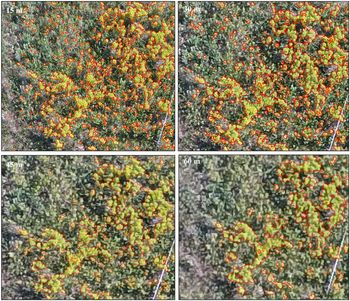
Unmanned aerial vehicle red-green-blue images acquired between 9:12 and 9:15 AM at four different flight heights (ranging from 15 to 60 m) for site 1. In each image, the white lines are the measuring tapes placed along the ground-vegetation sampling transects.

Unmanned aerial vehicle image acquisition and resulting image properties.

a In 2016, the flight heights were the same for sites 1 and 2; the only difference was in the flight time.
Ground Observation Data
Validation of the accuracy of the leafy spurge area detected using the remote sensing imagery usually involves a comparison with ground observations. The total yellow leafy spurge cover and flowering leafy spurge stem density were measured on the ground and used for validation. The ground surveys were conducted on June 30, 2016, and June 29, 2017, at both sites. In 2016, the field survey was a month earlier than the image acquisition date. The time lag between ground survey and image acquisition was not an important issue for the validation process, because the leafy spurge was in full bloom from the time of the ground surveys to the time of the image acquisition.
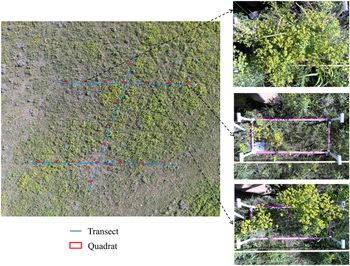
A transect sampling method was used for both years (Figure 4). For each site, three 30-m transects were established. One transect ran south to north and the second and third intersected perpendicular to the first transect at 5 m and 25 m from the south starting point. Along each transect, 7 quadrats (32 cm × 78 cm, or 0.25 m2) at 5-m intervals were sampled for a total of 19 quadrats per site. The overall sampled area was 0.5% of the study site (30 m × 30 m). Although a small area was sampled from the overall site, samples from 19 quadrats were distributed throughout the study site and provided representative information on leafy spurge, given the homogeneity of the landscape. In addition, this level of quadrat sampling aligns with methods used to assess the establishment and impact of biological control agents (Bourchier et al. Reference Bourchier, Hansen, Lym, Norton, Olsen, Randall, Schwarzländer and Skinner2006).
Field design for ground data collection. The unmanned aerial vehicle image (left) was acquired at site 1 between 11:01 and 11:04 AM at a flight height of 30 m on July 30, 2016. Examples of ground photographs taken from the quadrats show differing amounts of leafy spurge cover (right).

Within each quadrat, the number of vegetative as well as flowering leafy spurge stems was counted. The counts of flowering leafy spurge stems were converted to flowering leafy spurge stem density by dividing the quadrat area (0.25 m2) to give stem density m−2. The quadrat area was photographed using an RGB camera on a Garmin Oregon 550 [Garmin Ltd., Olathe, KS] global positioning system (GPS). The percent of leafy spurge groundcover was estimated visually by viewing the digital photographs in the laboratory. Although, the visual estimation method is widely adopted for cover estimation, due to its simplicity, the estimated cover can vary between individuals. As an alternative quantitative method, digital photographs of quadrats were also assessed in the laboratory using image analysis software, Image J (version 1.44; https://imagej.nih.gov/ij/). Each digital photograph was cropped to mask out the area outside of the quadrat. A grid template with each grid cell containing 2,200 pixels was generated and overlaid on the digital photographs. The presence of leafy spurge flowers, yellow vegetative leafy stems, green or vegetative leaf spurge stems, and other cover types was assessed at the intersection of each x and y gridline in the template. The percent cover of each type of cover component of interest within each quadrat was calculated using the following equation (Equation 2):
 $$FC\% = {\rm{ }}{{{\rm{PN}}} \over {{\rm{QN}}}}*100$$
where FC% is the percent groundcover for the target component, PN is the total number of intersection points belonging to the target component, and QN is the total number of intersection points in the quadrat.
The percent groundcover of the leafy spurge components, including yellow flowers, yellow vegetative stems, and green vegetative stems, within each quadrat was calculated. The percent total groundcover of the leafy spurge was then calculated by summing all cover components. The percent total yellow leafy spurge cover was calculated by summing the percent yellow flower and percent yellow vegetative stem covers. There was a good correlation between the visual estimate of leafy spurge groundcover and the value derived using ImageJ in both 2016 (r 2 = 0.89) and 2017 (r 2 = 0.92); the slope of less than 1 indicated that, visually, the percent groundcover of leafy spurge was overestimated (Figure 5). Table 2 summarizes the percent total leafy spurge cover in the quadrats from the two sites for 2016 and 2017. Poor-quality photographs resulted in three quadrats at site 2 in 2016 being removed from the analysis; thus, ground data collected from 16 quadrats at site 2 in 2016 were used in the analyses. More than half of the quadrats at the two sites in the 2 yr had total leafy spurge cover of less than 31%, indicating that most of the ground survey plots were in areas of low (11% to 30%) leafy spurge density (Rempel and Eberts Reference Rempel and Eberts2010).
Comparison between the percent groundcover of leafy spurge estimated visually by eye and using Image J software and a sampling grid.

Summary of leafy spurge groundcover in field-surveyed quadrats.

Image Analysis
Leafy spurge has distinctive yellow or yellow-green bracts when in bloom. Successful mapping of leafy spurge using UAV images depends on exploiting the flowering of this species and detecting the yellow or yellow-green of the flower bracts. Both the MTMF and HIS analysis methods were used to identify flowering leafy spurge from UAV images. MTMF was widely used and showed promising results in previous remote sensing studies for flowering leafy spurge detection (Glenn et al. Reference Glenn, Mundt, Weber, Prather, Lass and Pettingill2005; Mitchell and Glenn Reference Mitchell and Glenn2009; Parker-Williams and Hunt Jr. Reference Parker-Williams and Hunt2002, Reference Parker-Williams and Hunt2004). MTMF is a special type of spectral mixture analysis in which a partial unmixing is performed and the abundance of a single, user-defined end-member is reported. The advantage of the MTMF method is that it does not require end-members (signatures) for all components that occur in the image scene to conduct the unmixing. The outputs from MTMF are a matched filtering (MF) pixel score image, where pixel values represent the relative degree of match with the end-member spectrum and an infeasibility value that indicates the likelihood that the classified pixel is a false positive. A correctly classified pixel should have a high MF score and a low infeasibility value.
To determine the threshold of the resultant MF and infeasibility images, scatterplot values calculated over known areas of leafy spurge within the images were interactively selected. Threshold values of 0.4 for the MF score and 18.0 for the infeasibility score provided a good trade-off between the number of false-negative and false-positive errors. The end-member selected from one UAV image could not be transferred to other images at a particular site or between sites because the images were not calibrated and the pixel values vary with different flight altitude, image acquisition time, and weather conditions. The MTMF method was only applied to imagery acquired in 2016. One end-member per image generally was selected; however, a second end-member was required in some instances to cover the high variation in pixel values of leafy spurge flowers.
The HIS threshold method refers to transforming the RGB image into the HIS color space and determining the threshold of the image in this color space. In RGB color space, intensity is the dominant character and can vary with imaging condition, such as light (Tarbell and Reid, Reference Tarbell and Reid1991). The HIS model decouples the intensity component from the color information (hue and saturation), which is less affected by the imaging condition if the detection is based on color properties (Tang et al. Reference Tang, Tian and Steward2000). Studies have been conducted using the HIS color model for detection of rapeseed (Brassica napus L.) crop and yellow flag iris, and separation of green vegetation from senescent plants (Tang et al. Reference Tang, Tian and Steward2000). Compared with direct analysis of RGB images for land cover identification, transforming the RGB color model into HIS better enabled detection of rapeseed (Tang et al. Reference Tang, Tian and Steward2000).
The threshold was first determined using saturation, because yellow leafy spurge showed relatively higher saturation values compared with the other land covers; subsequently, intensity was used to remove the misclassified pixels from the first step. Misclassified pixels included senescent grass and vegetation in the gap between the leafy spurge, which had relatively lower intensity values. Cutoff values of 50 for saturation and 90 for intensity were used for setting the threshold of imagery acquired in 2016 and 40 for saturation and 90 for intensity were used for imagery acquired in 2017. Those cutoff values were identified by examining the image histograms.
Data Analysis
Images acquired at the two sites in 2016 were used to explore the impacts of the flight height, flight time, and image processing method on flowering leafy spurge detection. The influence of flight height was evaluated through comparison of (1) the correlations of percent flowering leafy spurge cover estimated from the UAV image acquired at each flight height to that from ground digital photographs, and (2) the differences in percent flowering leafy spurge cover estimated from images acquired among flight heights. The percent flowering leafy spurge cover at each quadrat was used as a replicate for the analysis. The MTMF method was used to detect the flowering leafy spurge for calculating the percentage of flowering leafy spurge cover in each quadrat from the UAV images.
A polygon layer containing the location of the quadrats on the ground in each UAV image was generated by manual digitization using the UAV images as the base layer. Separate layers were created for each UAV image at each site, because of the changes in pixel size of the UAV images acquired at different flight heights. By overlaying the quadrat layer on the flowering leafy spurge map generated using MTMF, the percent flowering leafy spurge cover estimated from UAV images was calculated for each quadrat.
The correlations were evaluated by calculation of r 2 values and using parameters generated through concordance correlation analysis. In concordance correlation analysis, the Pearson correlation coefficient provides a measure of how far the observations are from the best-fit line (measure of precision) and the concordance correlation provides a measure of how far the best-line deviates from the one-to-one line (measure of accuracy) (Lin Reference Lin1992). In addition, scale shift was used to measure the agreement between the two variables. A scale shift of 1 indicates perfect agreement, 0 indicates no agreement, and −1 indicates a perfect reverse agreement (Smith et al. Reference Smith, Bourgeois, Teillet, Freemantle and Nadeau2008). The higher the r 2 value for Pearson correlation and concordance correlation, and the closer the scale shift is to ±1, the stronger the relationship between percent flowering leafy spurge estimated from UAV image and that from ground digital photographs. Stem count is a commonly used parameter for measuring leafy spurge density in ecological studies. Thus, the correlation between percent flowering leafy spurge mapped from the UAV images and stem density was also investigated using the same parameters.
Differences in percent flowering leafy spurge cover estimated from imagery acquired at the various flight heights were compared using a generalized linear model with flight height as fixed factor. The influence of the flight time was analyzed using flight time as a fixed factor in the generalized linear model. The percent flowering leafy spurge cover estimated from the images acquired at the same flight height or flight time were combined and used as the replicates for these analyses. Performance of the two detection methods, MTMF and HIS, for flowering leafy spurge detection was investigated through comparison of the correlations of percent flowering leafy spurge cover estimated from ground digital photographs with that estimated using each method.
The coefficient of determination (r 2) and the normalized root mean square error (NRMSE) were used in evaluation of the correlations. The NRMSE is calculated as shown in Equation 3:
 $$NRMSE = {\rm{ }}{{\sqrt {\sum\nolimits_{{x_{i = 1}}}^n {{{\left( {{{\hat x}_i} - {x_i}} \right)}^2}} /n} } \over {\max ({x_i}) - min({x_i})}}$$
where  ${{\widehat x}_i}$
is the percent flowering leafy spurge cover estimated from the UAV image using MTMF or HIS, xi is the percent total yellow leafy spurge cover estimated from the ground digital photograph, and n is the number of samples or quadrats. The ANOVA was conducted to determine if the correlations for the two image processing methods were significantly different from each other. The comparison of correlation was conducted for each flight height, flight time, and site. All analyses was conducted with SAS, version 9.3 (SAS Institute, Cary, NC). The minimum acceptable level of significance in all the statistical analyses was 0.05.
Results and Discussion
Flowering Leafy Spurge Detection as Affected by Flight Height and Time
The correlation between total yellow leafy spurge cover estimated from the ground digital photographs and flowering leafy spurge cover estimated from UAV imagery varied among flight heights (Table 3). In general, the correlation weakened as flight height increased. The weaker relationship at higher flight height (> 30 m) can be attributed to the loss in spatial resolution and detail, leading to the inability to detect small patches of flowering leafy spurge (Figure 6). The relationship between the UAV estimates of flowering leafy spurge and the ground data was stronger at flight heights of 30 m and lower, as indicated by the concordance correlation analysis (r 2 = 0.66 to 0.90; scale shifts, 0.79 to 1.10; concordance correlation, 0.78 to 0.93; Pearson correlation, 0.87 to 0.91) and generally lower NRMSE (0.10 to 0.17 with the exception of the 15-m flight height between 11:01 and 11:04 AM) (Table 4). The best agreement (r 2 = 0.76 to 0.90) at the 30-m flight height identified in our study was relatively close to or better than previous results reported by Parker-Williams and Hunt Jr. (Reference Parker-Williams and Hunt2002) (r 2 = 0.79) and Mitchell and Glenn (Reference Mitchell and Glenn2009) (r 2 = 0.46 and 0.64). The improvement was primarily attributed to the improved separation of leafy spurge achieved using the high spatial resolution (in centimeters) of the UAV images compared with the 2-m resolution of the AVIRIS data. The separation of leafy spurge tends to decrease at coarser spatial resolution because of an increase in pixels of mixed spectral signals and a decrease in the ability to detect small patches of leafy spurge (Mitchell and Glenn Reference Mitchell and Glenn2009; Mladinich et al. Reference Mladinich, Bustos, Stitt, Root, Brown, Anderson and Hager2006).
Agreement between flowering leafy spurge cover estimated from mixture tuned matched filtering and ground measurement of total yellow leafy spurge cover and flower stem density.

a The r 2 values were derived from the regression models fitting for the relationship between flowering leafy spurge cover estimated from mixture tuned matched filtering and ground measurement of total yellow leafy spurge cover and flower stem density.
b Abbreviations: CC, concordance correlation; PC, Pearson correlation; SS, scale shift.
Leafy spurge detection using unmanned aerial vehicle (UAV) images obtained at a flight height between 15 and 60 m. The UAV images were acquired between 9:12 and 9:15 AM on July 30, 2016, at site 1. The red polygons outline the areas identified as leafy spurge using the mixture tuned matched filtering method.

Summary of the relationship between unmanned aerial vehicle (UAV) estimates of flowering leafy spurge cover and total yellow leafy spurge cover (r 2) and the percent flowering leafy spurge identified using HIS and MTMF analysis of the UAV images.

a Abbreviations: HIS, hue, intensity, and saturation; MTMF, mixture tuned matched filtering NRMSE, normalized root mean square error.
b The r 2 value shows the strongest agreement between percent leafy spurge cover estimated from ground digital photographs and that detected from the UAV image using HIS and MTMF, respectively.
c NRMSE was calculated for the percent flowering leafy spurge estimated from the UAV images.
d Significant at the P = 0.05 level.
The percent flowering leafy spurge cover detected from images acquired at the 15-m flight height were similar to those at 30 m and the difference in detected cover at those two heights was not significant (P > 0.05) (Figure 7). The detected leafy spurge cover at flight heights of 15 m and 30 m were greater than those at either 45 m or 60 m. The differences were significant at 45 m (P < 0.05) but not at 60 m (P > 0.05) (Figure 7). The lack of differences among flight heights of 15 m, 30 m, and 60 m was unexpected but could be attributed to the higher variance of the data set at flight height of 60 m. At the 60-m height, leafy spurge within the quadrats with sparse density could not be detected with the coarser image resolution, resulting in an increase in the variances between samples.
Comparison of percent flowering leafy spurge detected in the images using mixture tuned matched filtering among flight heights and between flight times. Concordance least square mean with the same letter (a, b) indicate no significant difference among the values.

Comparing data within flight heights, a stronger relationship was found between UAV-derived cover and ground measurements of total yellow leafy spurge cover compared with that between UAV-derived cover and stem density at two sites. The variation in plant size and resulting percent groundcover contributed to this relatively weak relationship. Depending on the size of the flower bract and the number of flowers on a stem, leafy spurge patches with the same stem density showed differing levels of cover. The percent cover estimates more closely approximate what the camera on the UAV “sees” compared with stem counts.
A comparison between the two different acquisition times at site 1 suggests the estimated leafy spurge cover was higher (except at a flight height of 45 m) with the 9:12 to 9:15 AM acquisition time at all flight heights, but the differences were not significant (P > 0.05) (Figure 7).
Comparison of MTMF and HIS Methods
The flowering leafy spurge cover estimated using MTMF and HIS methods were comparable at each of the four flight heights at both sites. Similar agreements were found when comparing the flowering leafy spurge cover estimated from the two methods and the yellow leafy spurge cover estimated from ground digital photographs (HIS r 2 range, 0.64 to 0.89 at site 1 and 0.84 to 0.92 at site 2 ; MTMF r 2 range, 0.64 to 0.83 at site 1 and 0.73 to 0.90 at site 2) (Table 4). The errors associated with each method for estimation of flowering leafy spurge cover were similar: 0.10 to 0.25 using HIS versus 0.10 to 0.27 using MTMF at site 1, and 0.08 to 0.14 using HIS versus 0.11 to 0.20 using MTMF at site 2. With the exception of the 15-m flight height at site 2, the r 2 value showed no significant difference (P > 0.05) at all tested flight heights and flight time at two sites (Table 4).
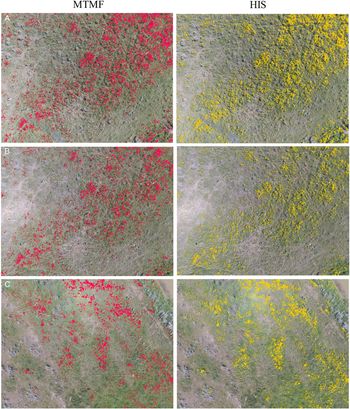
Figure 8 shows an example of the correlation between flowering leafy spurge cover estimated using MTMF and HIS and total yellow leafy spurge cover estimated from ground digital photographs at site 1, using the image acquired between 9:12 to 9:15 AM at the 30-m flight height. At same flight height, the percent flowering leafy spurge cover detected from the image using HIS was not significantly different (P > 0.05) compared with that detected from the same image using MTMF (Table 4). An example of the identified flowering leafy spurge maps generated using the two methods (9.8% flowering leafy spurge using HIS vs. 10.3% using MTMF) is shown in Figure 9, using the image acquired at a flight height of 30 m between 9:12 to 9:15 AM at site 1.
Comparison of the estimated flowering leafy spurge cover from mixture tuned matched filtering (MTMF) and hue, intensity, and saturation (HIS) as affected by flight height. The graphs show the comparison based on unmanned aerial vehicle (UAV) images acquired between 9:12 and 9:15 AM on July 30, 2016, at site 1. The solid line is the fitted linear function and the dashed line is the 1:1 line.

Flowering leafy spurge detected from unmanned aerial vehicle images using mixture tuned matched filtering (MTMF) versus hue, intensity, and saturation (HIS) methods at the two study sites. The images shown in panels A–C were acquired at the same flight height (30 m) on July 30, 2016. (A) Images were collected between 9:12 and 9:15 AM at site 1. (B) Images were collected between 11:01 and 11:04 AM at site 1. (C) Images were collected between 12:43 and 12:46 PM at site 2. The red and yellow polygons outline the areas identified as flowering leafy spurge using MTMF and HIS, respectively.

Flowering Leafy Spurge Change Between 2016 and 2017
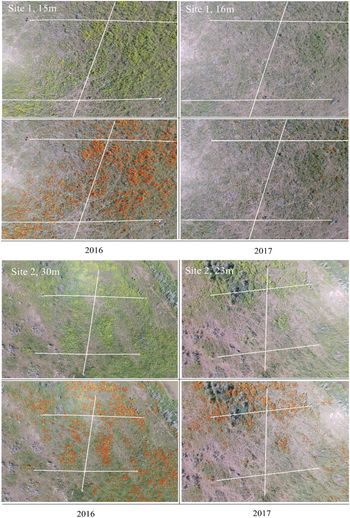
Building on this analysis, the HIS method was used in detecting and mapping the changes in flowering leafy spurge cover between 2016 and 2017 at the two sites. Flowering leafy spurge cover estimated from UAV images showed a good relationship with total yellow leafy spurge cover estimated from the ground digital photographs (r 2 = 0.71 and 0.82 at sites 1 and 2, respectively), indicating a consistent performance of HIS for estimating ground total yellow leafy spurge cover between years (Figure 10). The reduction in flowering leafy spurge cover on the ground at the two sites was apparent in 2017 (Figure 11). Flowering leafy spurge covered 16% of ground area at site 1 and 8% at site 2 in 2016, based on measurements from ground digital photographs. The cover was reduced to 6% at both sites in 2017. A similar reduction was found when using flowering leafy spurge cover estimated from the UAV imagery: 10% in 2016 versus 2% in 2017 at site 1 and 8% in 2016 versus 5% in 2017. The changes in flowering leafy spurge cover measured from images were close to that measured from ground digital photographs: 10% based on ground digital photographs versus 8.1% based on the UAV image for site 1 and 2% versus 3%, respectively, for site 2. An averaged difference of 1.8% in changes of flowering leafy spurge cover was found using the UAV images–based method and ground digital photographs in the 2 yr. This similarity of results demonstrates the feasibility of using UAV imagery as a reliable alternative for monitoring changes in leafy spurge densities.
The comparison between estimated flowering leafy spurge cover from the unmanned aerial vehicle (UAV) imagery acquired on June 28, 2017, subjected to hue, intensity, and saturation analysis and the total yellow leafy spurge cover measured on the ground at two sites. The solid line is the fitted linear function and the dashed line is the 1:1 line.

The change in flowering leafy spurge between 2016 and 2017 at the two study sites. At each site, the true color composite red-green-blue image (top) and the flowering leafy spurge detected using hue, intensity, and saturation analysis (outlined in red; bottom) are shown.

Summary and Future Work
The potential use of UAV images for flowering leafy spurge detection and mapping in biological control sites has been demonstrated in this study. Maps generated through time from UAV images can be used to monitor spatial extent and distribution of leafy spurge and serve as treatment maps. The accuracy of the detection was influenced by the flight height. From this study, images acquired at a flight height of 30 m are recommended for leafy spurge detection or mapping, based on the best agreement with ground measurements, the lowest NRMSE, and the balance between flying workload and ground coverage. For surveys targeting early detection and early treatment, where it is crucial to find small spurge patches, a flight height at lower altitude (≤ 30 m) may be required for accurate detection. In the case of detecting hot-spot infestations for treatment in a larger geographic area, a relatively higher flight height is recommended, with images with sufficient spatial resolution to capture the leafy spurge patches.
The impacts of two acquisition times on the day of flowering leafy spurge detection were minor and nonsignificant. When a series of UAV images is used to monitor flowering leafy spurge changes over time, based on this classification method, it is preferable that acquisition times are as consistent as possible to mitigate the effects of sun elevation on the remotely sensed signals. However, this criterion may be challenging due to the short flowering period of leafy spurge and the requirement of calm and clear weather conditions for UAV image acquisition. The results of this study show the potential to use a series of UAV images of different acquisition times for flowering leafy spurge detection or monitoring over time.
The performances of HIS and MTMF methods were comparable for flowering leafy spurge detection based on UAV RGB images. However, HIS is a much simpler analysis than MTMF. MTMF requires users to have more knowledge of spurge at sites for end-member selection. The detection accuracy is highly dependent on the end-member applied. In addition, MTMF requires more computer processing power, because it involves multiple steps (i.e., end-member selection, MF and infeasibility calculation, and threshold) in its calculation. From an operational viewpoint, HIS is recommended, especially when a large data set of UAV RGB images is involved.
The success in detection of flowering leafy spurge using UAV images in this study relied on accurate identification of yellow or yellow-green flower bracts. At the two sites in this study, there were no other yellow-flowered plant species. Species with yellow flowers, such as yellow hawkweed (Hieracium fendleri Sch. Bip.) or yellow sweet clover [Melilotus officinalis (L.) Lam.] may confound the detection accuracy if co-occurring at the site. However, Everitt et al. (Reference Everitt, Anderson, Escobar, Davis, Spencer and Andrascik1995) suggested the lower visible reflectance of flowering leafy spurge compared with that of yellow sweet clover may enable these two species to be separated.
Although successful detection of flowering leafy spurge using UAV images was achieved, improvements are possible in future work. Application of georeferenced UAV images, if available, will make comparison of flowering leafy spurge detection at different flight heights easier, because parameters, such as the difference between identified flowering leafy spurge polygons or area, could be directly calculated from the generated maps of leafy spurge. Unfortunately, at the study sites we used, no ground control points (GCPs) were available to enable correction of GPS coordinates, and this may be an issue at remote rangeland sites. Generally, UAV images have centimeter-level spatial resolution, whereas the commonly used GPS devices typically have an error of 1 to 5 m. Errors are introduced when GCPs collected using these types of GPS devices are used in the geometric correction of UAV images (Lu and He Reference Lu and He2017; Müllerová et al. Reference Müllerová, Bartaloš, Brüna, Dvořák and Vítková2017). Application of GCPs collected using a high-accuracy global navigation satellite system (centimeter level) or an on-board, real-time kinematic global navigation satellite system is recommended as a possible solution (Lu and He Reference Lu and He2017; Stöcker et al. Reference Stöcker, Nex, Koeva and Gerke2017).
In summary, we demonstrate in this study the feasibility of using a low-cost UAV system for mapping flowering leafy spurge with high accuracy and the importance of testing multiple flight heights and image acquisition times if UAVs are used for detection of other plant species. The HIS color threshold method is recommended for flowering leafy spurge detection using RGB UAV images. The method developed in this study could be modified to detect flowering leafy spurge at other sites or at different geographic scales and provides the potential to aid development of a cost-effective tool for routinely monitoring leafy spurge and aid leafy spurge management activities.
Acknowledgments
The authors acknowledge Agriculture and Agri-Food Canada for providing the funding to support this research. Many thanks to Janine Brooke and Karma Tiberg for the ground photograph analyses for this study, Bradley Smith for UAV image processing, and Bill Houston for assistance with data acquisition. The help of Timothy Schwinghamer in the data analysis is appreciated. No conflicts of interest have been declared.
LeRDC Contribution No. 38719023.