I. INTRODUCTION
In the last few years, GaN has emerged as a semiconductor with extraordinary capabilities in photonics and electronics. GaN packs a unique set of physical attributes: a wide and large direct band gap, high breakdown field, excellent thermal conductivity, and a relatively high electron mobility. Reference Morkoc1 GaN belongs to a family of ternaries, including InGaN and AlGaN, which span a wide range of bandgaps and make possible GaN-based light-emitting diodes (LED) with colors from red to ultra-violet. Reference Nakamura2 GaN LEDs today represent a multibillion dollar market. Blue GaN lasers are also commercial for high-density recording.
Heterostructures based on GaN and AlGaN also lead to the formation of a two-dimensional electron gas (2DEG) on the GaN side of the interface even in the absence of doping. Reference Asif Khan, Skogman, Van Hove, Olson and Kuznia3 This is due to the large spontaneous polarization of AlGaN as well as stress-induced polarization in AlGaN that arises from its lattice mismatch with GaN. The lack of doping confers electrons with very high mobility, about 2000 cm2/V.s at room temperature. The excellent quality of this heterostructure system has been demonstrated in the observation of the quantum-Hall effect and the fractional quantum-Hall effect. Reference Manfra, Weimann, Hsu, Pfeiffer, West, Syed, Stormer, Pan, Lang, Chu, Kowach, Sergent, Caissie, Molvar, Mahoney and Molnar4 AlGaN/GaN High Electron Mobility Transistors (HEMT) were first demonstrated in 1993. Reference Asif Khan, Bhattarai, Kuznia and Olson5 The combination of a high breakdown field in GaN with the high mobility and good electron confinement of the 2DEG at the AlGaN/GaN interface brings about a unique suitability of GaN HEMTS for power amplifier applications in the radio frequency (RF), microwave, and millimeter-wave regimes. Reference Pengelly, Wood, Milligan, Sheppard and Pribble6
Electrical power management is another application field where the unique properties of GaN shine. Reference Lidow, Strydom, de Rooij and Ma7 Power electronics systems are becoming ubiquitous as electrification permeates deeper into human society. Semiconductor Si dominates the active components in power electronics. Compared with Si, GaN power transistors offer lower resistive losses, smaller size, and can operate at higher frequency. This brings about significant savings in the size of energy storage elements (capacitors and inductors) and, therefore, the overall system volume, as well as relaxed packaging and cooling needs.
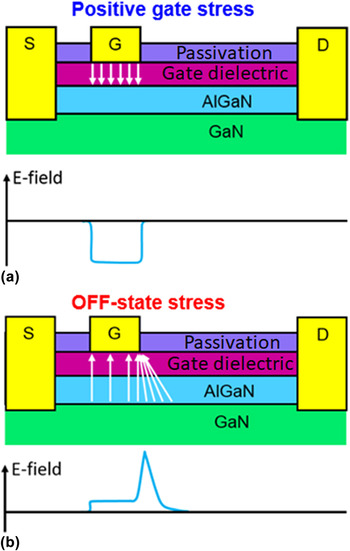
The Metal-Insulator-Semiconductor High-Electron Mobility Transistor (MIS-HEMT) is the preferred active device structure for power management applications based on GaN. Reference Van Hove, Boulay, Bahl, Stoffels, Kang, Wellekens, Geens, Delabie and Decoutere8 The MIS-HEMT combines the excellent transport characteristics of the HEMT with the gate current blocking capabilities associated with the gate dielectric of a MOSFET. As a power switch, the transistor alternatively operates in two states: a highly conducting ON state and a highly insulating OFF state that can sustain a large voltage. The MIS-HEMT structure is effective in balancing both requirements and realizes the great potential of GaN for power electronics. A simplified cross section of a MIS-HEMT is shown in Fig. 1. Impressive GaN MIS-HEMT power switching performance has been demonstrated Reference Then, Chow, Dasgupta, Gardner, Radosavljevic, Rao, Sung, Yang and Fischer9 and the expectations are for substantial improvement over the most advanced Si power transistors and for wide displacement of Si in many applications. Reference Deboy, Treu, Haeberlen and Neumayr10
Sketches of the electric field in the gate dielectric of an AlGaN/GaN MIS-HEMT for the positive gate stress (a) and OFF-state stress (b). Positive gate stress yields a relatively uniform electric field underneath the gate, whereas the OFF-state stress results in a peak in the electric field on the drain-side edge of the gate.

In spite of these great attributes, GaN MIS-HEMTs have yet to be widely deployed in commercial applications. The main bottleneck is establishing adequate stability and reliability. This is often the case with a new electronic technology. However, GaN power MIS-HEMTs face an unusual hurdle that derives from their use of a Si substrate. This is an economic imperative. Native GaN substrates are too small and expensive. SiC substrates, commonly used in GaN HEMTs for microwave power amplifiers, are also relatively small for the volume productions that are expected, as well as excessively expensive. Si, on the other hand, is available in large diameter wafers, is inexpensive, and there is a well-established manufacturing infrastructure around the world. A remarkable fact is that, in spite of the large lattice mismatch between GaN and Si, high performance GaN transistors are routinely demonstrated. However, the use of an Si substrate comes with a price of high defectivity in the AlGaN/GaN active layers that takes a toll on the stability of the device and creates reliability concerns.
This article is not about reliability and stability concerns associated with the AlGaN/GaN structure grown on a mismatched substrate. This has been extensively studied in HEMTs. Reference Zanoni, Meneghini, Chini, Marcon and Meneghesso11–Reference Ohki, Kikkawa, Inoue, Kanamura, Okamoto, Makiyama, Imanishi, Shigematsu, Joshin and Hara14 Our goal in this paper is to investigate the unique and novel issues brought in with the introduction of a gate dielectric in a power MIS-HEMT structure. As in other Metal-Insulator-Semiconductor (MIS) systems, Bias-Temperature Instability (BTI) issues in which the threshold voltage of the device shifts around depending on the operating conditions is a problem. Reference Zafar, Kim, Narayanan, Cabral, Paruchuri, Doris, Stathis, Callegari and Chudzik15–Reference Lagger, Ostermaier, Pobegen and Pogany17 Furthermore, a sudden breakdown arising from defect formation induced by a high electric field across the gate dielectric, a process known as Time-Dependent Dielectric Breakdown (TDDB), also imposes a maximum lifetime to a transistor. Reference Svensson and Shumka18–Reference Wu, Marcon, Zahid, Van Hove, Decoutere and Groeseneken20 Until recently, both phenomena received scant attention in GaN MIS-HEMTs. Filling this gap is the purpose of this work. A complication in these studies has been the very significant trapping associated with the GaN heterostructure that presumably emanates from the defectivity that was mentioned above. This introduces very large shifts in the electrical characteristics of the devices in the course of the experimental studies as well as very complex dynamics that obstruct the unique issues associated with the gate dielectric.
In this work, we summarize our efforts in the development of a methodology designed to mitigate trapping effects associated with the semiconductor heterostructure of GaN MIS-HEMTs so as to bring to the forefront the unique issues introduced by the gate dielectric. This has allowed us to identify the dominant mechanisms associated with BTI and TDDB in these devices and build models that contribute toward the estimation of device lifetimes under field operating conditions.
II. TIME-DEPENDENT DIELECTRIC BREAKDOWN
One of the most prominent concerns facing GaN MIS-HEMTs is a failure mode known as TDDB. While well studied in the Si CMOS system, Reference Svensson and Shumka18,Reference Alam, Weir and Silverman21–Reference Li, Tung, Pey and Lo23 it was not until several years ago that efforts to understand TDDB in the GaN MIS-HEMT system began. Reference Wu, Marcon, Zahid, Van Hove, Decoutere and Groeseneken20,Reference Warnock and del Alamo24–Reference Warnock and del Alamo26
The devices we study, like many GaN MIS-HEMTs today, are depletion-mode or normally-ON transistors. This is problematic from a safety perspective for power applications. To solve this, a MIS-HEMT is often put in a cascode configuration with a silicon MOSFET. Reference Huang, Liu, Li and Lee27,Reference Meneghini, Rossetto, De Santi, Rampazzo, Tajalli, Barbato, Ruzzarin, Borga, Canato, Zanoni and Meneghesso28 During switching operation, in the OFF state (with V GS < V T), the MIS-HEMT must be able to block a high voltage applied to the drain. Reference Baliga29–Reference Meneghini, Rossetto, Hurkx, Sonsky, Croon, Meneghesso and Zanoni31 This is the state of greatest concern as it comes to TDDB. The ON-state is more benign since 0 V is applied to the gate, and the drain is under a small bias. Reference Meneghini, Rossetto, De Santi, Rampazzo, Tajalli, Barbato, Ruzzarin, Borga, Canato, Zanoni and Meneghesso28
The cascode configuration is designed such that the GaN devices are never subjected to a positive gate bias. However, the positive gate stress condition yields a relatively uniform electric field across the gate dielectric, as illustrated by the top image of Fig. 1. This makes this stress condition ideal to provide fundamental understandings of TDDB in GaN MIS-HEMTs. The OFF-state stress condition, which mimics the blocking voltage a MIS-HEMT must sustain, is shown in the bottom of Fig. 1. A negative bias is applied on the gate terminal to turn the FET off, and a high bias is applied to the drain. This bias point yields a rather nonuniform electric field profile with a peak at the drain-side edge of the gate. The use of field plates moderates the peak electric field and brings it out further into the gate-drain gap. Nevertheless, in the OFF state with a high blocking voltage, a high electric is present across the dielectric that can trigger TDDB.
Our goal in this research is to contribute toward fundamental understanding of TDDB in GaN MIS-HEMTs. We therefore study devices without field plates, which have a simpler geometry. Our devices feature a SiN gate dielectric with a thickness of a few tens of nm and a gate area of 2000 µm2. We begin our study under a positive gate stress to establish a robust foundational understanding. We later turn our focus to the OFF-state stress condition that mimics the more realistic stress of a cascode circuit.
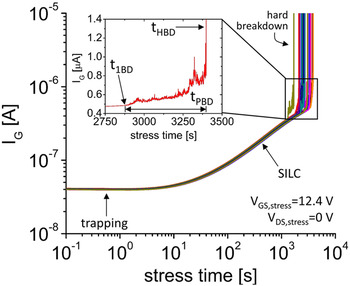
Figure 2 shows the gate current (I G) evolution as a function of stress time for a series of positive gate stress experiments on 20 devices at a V GS,stress of 12.4 V with V DS,stress = 0 V. The very uniform evolution of the gate current leading to breakdown across all transistors suggests that we are observing an intrinsic breakdown in a set of well-matched devices. Reference Wolters and van der Schoot32 Thus the spread of breakdown times is not brought about by process-induced imperfections such as impurities, roughness, thinning, structural weakness, etc. but by the inherent randomness of the defect formation process.
Gate current I G as a function of stress time during a series of constant V GS,stress TDDB experiments on 20 devices. The FETs are held at V GS,stress = 12.4 V until they break down. V DS,stress = 0 V. The inset shows detail of a representative device of the I G evolution right before HBD. The clear onset of noise in I G marks the beginning of PBD.

The slight decrease of I G in the initial stages of the experiment is indicative of trapping, Reference Demirtas, Joh and del Alamo33 and the increase of I G thereafter can be attributed to stress-induced leakage current, SILC. Reference Degraeve, Kauerauf, Cho, Zahid, Ragnarsson, Brunco, Kaczer, Roussel, De Gendt and Groeseneken34 Dielectric hard, i.e., catastrophic breakdown is observed to take place after 1000 s and is characterized by a very sharp vertical jump in the gate current of each device.
The inset, showing the late stage time evolution of the gate current in a representative device, indicates that approaching hard breakdown (HBD), I G becomes noisy: a condition known as progressive breakdown (PBD). Reference Ribes, Mitard, Denais, Bruyere, Monsieur, Parthasarathy, Vincent and Ghibaudo19 This is distinct from the SILC regime we have seen before. While the increased leakage during SILC results from defects being generated everywhere within the dielectric in accordance with the percolation model, Reference Degraeve, Kaczer and Groeseneken35 PBD reflects the formation of a breakdown path created by these defects within the dielectric. Reference Palumbo, Eizenberg and Lombardo36 After the onset of PBD, further stress increases the I G noise until HBD occurs. We denote the time at which gate noise appears as the time-to-first-breakdown, t 1BD, the time at which final hard breakdown occurs as t HBD, and the time lapse in between as the length of PBD, or t PBD.
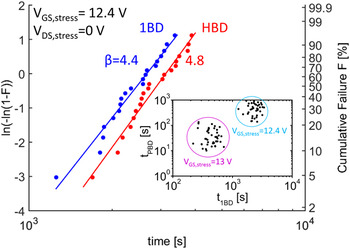
Figure 3 shows the corresponding Weibull plot for the devices in Fig. 2. Time-to-breakdown in Si MOSFETs through an intrinsic mechanism has been found to follow Weibull statistics. Reference Wolters and van der Schoot32 Here, we have separated time-to-first-breakdown, t 1BD, from time-to-hard breakdown, t HBD. In these experiments, well-behaved Weibull statistics are observed with a Weibull slope Reference Wu, Stathis and Han37 β of 4.4 and 4.8 for 1BD and HBD, respectively. The nearly parallel shift in the Weibull distributions of 1BD and HBD suggests a common origin for the two phenomena. Once the first breakdown occurs, additional gate stress continues to generate defects at random. Eventually, HBD takes place when enough energy is suddenly delivered to the PBD breakdown path so that it becomes nearly ohmic. Reference Bersuker, Chowdhury, Young, Heh, Misra and Choi38 Thus, from device to device, we expected t 1BD and t HBD to be uncorrelated but the overall statistics to be similar. Indeed, if, as suggested in Ref. Reference Guo and del Alamo39, we plot t 1BD with its corresponding PBD time, t PBD, as shown in the inset of Fig. 3, we see that the two are independent of one another.
Weibull plot of t 1BD and t HBD. V GS,stress = 12.4 V. V DS,stress = 0 V. Nearly parallel statistics for time-to-first-breakdown t 1BD and time-to-hard-breakdown t HBD suggest a unified degradation mechanism. Inset: PBD time versus t 1BD for samples stressed at V GS,stress = 12.4 V and V GS,stress = 13 V. Both sets of data show that t 1BD and t PBD are uncorrelated. As V GS,stress increases both t 1BD and t PBD decrease as well.

Not described here are stress-and-measure experiments that aim to understand the impact that the high electric field stress has on the device transfer characteristics. The transient instabilities by which GaN MIS-HEMTs are plagued Reference Lagger, Ostermaier, Pobegen and Pogany17,Reference Guo and del Alamo39 make this understanding more difficult. A methodology to address these issues and develop suitable experimental techniques has been described elsewhere. Reference Warnock and del Alamo24
These experiments yield a good initial understanding of TDDB in the GaN MIS-HEMT system. The classic TDDB behavior that has emerged provides us with assurance that it should be possible to develop lifetime models that can be used for device lifetime estimations under operating conditions. From here, we can turn our attention to the OFF-state stress regime that emulates the stress a MIS-HEMT sees in its cascode configuration.
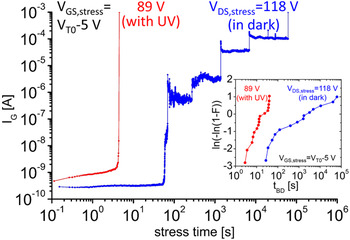
Figure 4 shows the evolution of the gate leakage current for a constant-voltage OFF-stress experiment. Here, the blue line corresponds to the evolution of the gate current I G upon the application of a gate bias of V GS,stress = V T0 − 5 V (V T0 is the threshold voltage defined at I D = 1 µA for V DS = 0.1 V on a virgin device) and a drain bias of V DS,stress = 118 V. We observe multiple jumps in I G (equal to the drain current I D, not shown) before final hard breakdown occurs near 105 s. The jumps, except for the final one, are reminiscent of soft dielectric breakdown in silicon MOSFETs. Reference Crupi, Degraeve, Groeseneken, Nigam and Maes40 Hard breakdowns can occur either after a number of soft breakdown events, or for harsher stress conditions, it can be the very first instance of breakdown. Reference Sune, Wu, Jiménez, Vollertsen and Miranda41
Gate current I G evolution for constant-voltage OFF-state TDDB experiments in the dark (V DS,stress = 118 V) and under UV light (V DS,stress = 89 V). Inset: Weibull plot of time-to-breakdown t BD for OFF-state stress experiment in the dark and with UV light. V GS,stress = V T0 − 5 V.

The corresponding Weibull statistics for time-to-hard breakdown in the OFF-state experiment at V DS,stress = 118 V are shown in the inset of Fig. 4. It is clear that the breakdown statistics do not follow a simple Weibull distribution, and the times-to-breakdown span many orders of magnitude. From these data, the physics of failure are unclear and one might conclude that we are in front of an extrinsic TDDB mechanism, Reference Wolters and van der Schoot32 in contrast with our positive gate experiments described above. As we show next, this anomalous behavior is related to trapping effects, most likely taking place in the AlGaN/GaN structure.
Device characterization performed between periods of OFF-state stress reveals severe current collapse effects and large threshold voltage shifts. Reference Warnock and del Alamo42 It becomes clear that these transient effects have a significant impact on the OFF-state TDDB statistics as they are expected to affect the electric field distribution in a substantial way. Fortunately, ultraviolet (UV) light has previously been shown to be effective in recovering current collapse effects in GaN MIS-HEMTs after OFF-state stress. Reference Jin, Joh, Krishnan, Tipirneni, Pendharkar and del Alamo43 In fact, trapping mitigation by means of UV light illumination during stress is known to result in an increase in the electric field for the same applied bias. Reference Demirtas and del Alamo44 We therefore expect that the application of UV light during OFF-state TDDB experiments accelerates dielectric degradation.
The red data in Fig. 4 show the results from OFF-state stress experiments under a UV light of 3.5 eV (chosen based on Ref. Reference Jin, Joh, Krishnan, Tipirneni, Pendharkar and del Alamo43). If we look first at the gate current evolution versus stress time, we find that despite a lower bias of V DS,stress = 89 V, the device under UV light breaks down in a dramatically shorter amount of time than the device tested in the dark. There is also no evidence of any soft breakdown events before final catastrophic breakdown. This difference is another manifestation of the harsher stress conditions prevailing in the OFF state under UV. In Si devices, high stress voltage leads to “hard” breakdown characteristics (versus “soft” breakdown at lower voltages). Reference Alam, Weir and Silverman22
The Weibull statistics in the inset, which compare OFF-state TDDB in the dark with OFF-state TDDB stress under UV light, show that under UV even with a 25% smaller V DS,stress, the devices reach hard breakdown between 1 and 3 orders of magnitude faster than in the dark. We also see classic linear Weibull statistics that suggest we are now observing intrinsic TDDB behavior. This is what is expected from the positive-gate stress experiments described above.
The results of Fig. 4 highlight the importance of correctly isolating permanent degradation from transient effects that, in turn, can indirectly impact the degree of permanent degradation that is introduced. In our work, trapping effects cause a reduction of the applied electric field and this hastens permanent degradation. This complication, however, can be mitigated through UV illumination. To develop accurate lifetime models, it is clear that much care must be taken to ensure that device lifetime does not become distorted by transient trap-related degradation effects. However, use conditions must also be considered when evaluating device lifetimes since trapping affects the electric field that drives breakdown and location, and the degree of trapping depends on the actual operating conditions.
There are a number of further considerations that need to be addressed in a quest to develop lifetime models. Firstly, to accurately quantify the full extent of trapping in AlGaN/GaN MIS-HEMTs, device characterization needs to be performed using fast pulsed conditions. GaN MIS-HEMT dynamics are known to include very fast transients that dissipate before a relatively slow DC sweep can quantify them. Reference Lagger, Reiner, Pogany and Ostermaier45–Reference Jin and del Alamo48 Also, when attempting to match device simulations and experimental data so that the electric field across the dielectric can be estimated, the simulations must account for the proper threshold voltage shift. It is the electric field during stress that must ultimately be used for lifetime extrapolation and, therefore, it is critical that this electric field be accurately estimated.
In addition, though this work has pursued a more physical understanding of TDDB, what is still missing is the exact nature of the defects in the dielectric. There was much controversy early on in the silicon MOS community over how the breakdown time scaled with the electric field, and much of this debate was focused on what the actual degradation mechanism was for TDDB in SiO2. Reference Alam, Bude and Ghetti49–Reference McPherson, Khamankar and Shanware57 A proper lifetime model for GaN MIS-HEMTs must draw upon this information to make precise extrapolations.
III. BIAS-TEMPERATURE INSTABILITY
The previous section has shown how prolonged electrical stress, even if relatively moderate, can result in noticeable transient changes in the electrical characteristics of MIS-HEMTs, most notably the threshold voltage V T. In power switching applications, this is a serious problem as V T marks the boundary in the gate bias between the ON state and the OFF state. Improper device turn-on or turn-off can result in device or system damage. Circuit and system designers expect a value of V T that is kept within strict bounds.
The complex layer structure of GaN MIS-HEMTs and the defectivity that arises from the use of a Si substrate offer many possibilities for charge trapping that lead to transistor instability. Trapping in the GaN channel, Reference Jin, Joh, Krishnan, Tipirneni, Pendharkar and del Alamo43 as well as in the AlGaN barrier has been reported. Reference Jin and del Alamo48,Reference Joh and del Alamo58 When a thin AlN spacer is introduced between the AlGaN barrier and the GaN channel, additional trapping associated with the AlGaN/AlN interface has also been postulated. Reference Joh and del Alamo58 Trapping at all these sites greatly obscures the contributions of the gate dielectric and its interface with the semiconductor to device instability, the object of this study.
To focus on the unique electrical instabilities associated with the gate dielectric in a GaN MIS-HEMT, we have carried out our studies instead on a simpler GaN MOSFET structure in which the dielectric is placed directly on top of the GaN channel. This is a device of interest for power applications in its own right. Reference Ikeda, Niiyama, Kambayashi, Sato, Nomura, Kato and Yoshida59 While trapping effects associated with the GaN channel are still to be expected, the role of the dielectric and its interface with the channel should emerge with much more clarity.
Trapping studies require a carefully designed experimental methodology. Our approach consists of: (i) a benign transistor characterization suite and (ii) a thermal detrapping step that is both effective and benign. As in previous reliability studies in AlGaN/GaN Reference del Alamo and Joh12 and InAlN/GaN HEMTs, Reference Wu and del Alamo60 our characterization suite consists of measuring selected figures of merit (FOM) of the device that provide a view of the changes taking place as a result of electrical stress. However, repeated measurements of these FOMs should not affect the device in more than a minor way. As device FOMs, in our BTI studies, we have focused on the threshold voltage (V T), peak transconductance, g m, and subthreshold swing, S, all measured in the linear regime (low V DS). These metrics provide a reasonably comprehensive view of trapping in the dielectric (V T), impact on carrier scattering in the channel (g m), and interface state formation at the oxide/semiconductor interface (S). The detailed measurement conditions for these metrics are given in Ref. Reference Guo and del Alamo61. Though that is not always the case and great care has to be exercised, these FOMs are designed so that repeated measurements in the context of long stress-characterization experiments negligibly affect the device in the scale of what stress itself does.
The second tool in our study is a benign but an effective thermal detrapping step. This allows us to, following a benign stress experiment, detrap all trapped carriers and recover the device initial conditions. It also enables isolation of the permanent and nonrecoverable device degradation that might originate under harsh stress conditions. We further use this thermal detrapping step to set a reproducible starting point for virgin devices in all our experiments. This erases any prior history of a given test device.
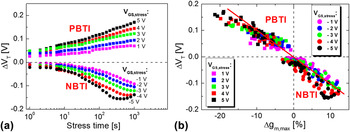
The devices used in our experiments are GaN MOSFETs with a SiO2/Al2O3 composite dielectric with the Al2O3 directly on top of the GaN channel. Reference Guo and del Alamo61 The gate oxide equivalent oxide thickness (EOT) is 40 nm. The channel width/length is 100/1 µm. Figure 5(a) shows the evolution of the threshold voltage in GaN MOSFETs as a function of time in stress-interrupt experiments at different gate stress voltages at room temperature (V DS = 0). Reference Guo and del Alamo61 Under positive gate voltage stress (PBTI), V T shifts positive. Under negative voltage stress (NBTI), V T shifts negative. The magnitude of the V T shifts increases with time and stress voltage. Not shown are the changes of the transconductance. Under PBTI, g m decreases with stress time and voltage while under NBTI, g m increases in a similar manner. In both cases, there are no significant changes in the subthreshold swing. If the stress is interrupted, all FOMs slowly recover. For the conditions studied in Fig. 5, a final thermal detrapping step completely restores the device initial conditions.
(a) Time evolution of ΔV T fin stress experiments with V GS,stress from −5 to 5 V at RT. (b) Correlation between ΔV T and Δg m,max throughout stress and recovery for PBTI and NBTI experiments at RT. The universal relationship that is obtained suggests a common physical origin.

An interesting observation is that there is a tight correlation between ΔV T and Δg m for both PBTI and NBTI during the stress and recovery phases, as shown in Fig. 5(b). The top-left quadrant of this figure graphs the PBTI data while the bottom-right quadrant contains the NBTI data. It is clear that the V T and g m changes are closely correlated across the entire experimental set with a continuous, linear relationship with a nearly constant slope. This suggests that NBTI and PBTI in GaN MOSFETs are the result of a common fully reversible mechanism.
Temperature has been found to accelerate all the observed changes. However, the acceleration rate is relatively small. Activation energies E a between 0.06 and 0.37 eV have been extracted for the stress and recovery phases of the V T evolution under PBTI and NBTI conditions. Reference Guo and del Alamo61 This suggests the presence of small energy barriers to the prevailing processes and the preponderance of tunneling.
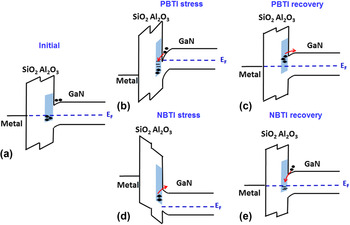
The recoverable changes in V T and other electrical FOM are consistent with electron trapping and detrapping in preexisting oxide traps. Schematic diagrams of the processes are sketched in Fig. 6. It is known that Al2O3 contains traps that cluster in a band of an energy range and density that depends on the details of deposition and postdeposition treatment. Reference Franco, Alian, Kaczer, Lin, Ivanov, Pourghaderi, Martens, Mols, Zhou, Waldron, Sioncke, Kauerauf, Collaert, Thean, Heyns and Groeseneken62 In our devices, we postulate that with the device under zero bias, the defect band extends from below the Fermi level to above the edge of the GaN conduction band, as sketched on the left of Fig. 6. The oxide defects that are located below the Fermi level are occupied, while those above are empty.
Energy band diagram of GaN MOSFETs in equilibrium and under PBTI/NBTI stress and recovery. Electron trapping and detrapping from a single unified band of defects inside the Al2O3 barrier explains all results.

Under PBTI stress conditions, the defect band is brought below the Fermi level in the GaN channel and electrons tunnel into the available trap states [Fig. 6(b)]. This shifts V T positive. Under PBTI recovery, electrons from the traps tunnel back to the GaN conduction band [Fig. 6(c)]. As a result, V T recovers. Under NBTI, the contrary happens. During stress, occupied trap states emit their electrons to the GaN channel [Fig. 6(d)], while during the recovery, electrons tunnel back into the oxide defects [Fig. 6(e)]. This picture is consistent with the small activation energies that we have observed in the temperature-dependent experiments. PBTI stress and NBTI recovery are characterized by very small E a, while PBTI recovery and NBTI stress exhibit comparatively higher E a values.
The changes that are observed in the transconductance and the subthreshold swing are also consistent with this picture. Electron trapping in the oxide (as during PBTI stress and NBTI recovery) introduces additional Coulombic scattering for channel electrons. This results in a reduction of the device g m. Electron detrapping during PBTI recovery and NBTI stress correspondingly reduces Coulombic scattering and g m increases. With the oxide traps being located at some distance from the oxide/semiconductor interface and their response being rather sluggish [see time scale in Fig. 5(a)], during a relatively fast trace of the device subthreshold characteristics, no significant change in the trapped electron population is possible. Hence, the subthreshold swing of the device is unaffected in these experiments.
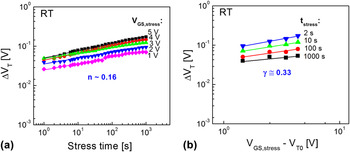
Our observations are consistent with those of other authors in similar MOS systems involving GaN and other semiconductors. Reference Franco, Alian, Kaczer, Lin, Ivanov, Pourghaderi, Martens, Mols, Zhou, Waldron, Sioncke, Kauerauf, Collaert, Thean, Heyns and Groeseneken62–Reference Cho, Lee, Aoulaiche, Kaczer, Roussel, Kauerauf, Degraeve, Franco, Ragnarsson and Groeseneken64 As in these and other works, simple power laws are found to describe relatively well the evolution of V T with stress time and stress overdrive voltage. For our PBTI experiments, the time dependence is illustrated in Fig. 7(a). A power law with a relatively shallow exponent describes well all experiments at all stress voltages. The value of the exponent, n = 0.16, is close to that reported by other authors. Reference Guo and del Alamo61–Reference Wu, Franco, Marcon, De Jaeger, Bakeroot, Stoffels, Van Hove, Groeseneken and Decoutere63 The dependence of ΔV T on the stress gate voltage overdrive (with respect to the V T of the virgin device, or V T0) at different stress times is also well described by a power law with a single exponent γ = 0.33. This value reflects the energy distribution of traps inside the oxide. Reference Franco, Alian, Kaczer, Lin, Ivanov, Pourghaderi, Martens, Mols, Zhou, Waldron, Sioncke, Kauerauf, Collaert, Thean, Heyns and Groeseneken62,Reference Wu, Franco, Marcon, De Jaeger, Bakeroot, Stoffels, Van Hove, Groeseneken and Decoutere63 The relatively small value of γ that we obtain under PBTI conditions suggests a broad distribution of empty traps in the oxide above the channel Fermi level. For NBTI, a higher value of γ is obtained, indicating that the trap density drops more quickly for lower energies inside the oxide band gap. Reference Guo and del Alamo65
(a) Empirical fits for ΔV T evolution with stress time at RT, for V GS,stress from 1 to 5 V. (b) Empirical fits for ΔV T evolution with stress voltage at RT, for positive V GS,stress at various t stress values. Symbols: experimental data. Solid lines: empirical fitting results.

The BTI experiments described so far are carried out under relatively moderate stress conditions. Harsher stress changes the picture substantially. PBTI experiments at higher stress voltages (V G,stress ∼ 15 V) produce nonrecoverable positive shifts in V T that correlate well with permanent drops in g m. Reference Guo and del Alamo39 Both increase with time and temperature. Reference Guo and del Alamo39 The subthreshold swing changes very little. This suggests the formation of new traps inside the oxide close to its interface with the semiconductor (although it could also indicate trapping of electrons in very deep traps that cannot be ejected during our thermal detrapping step).
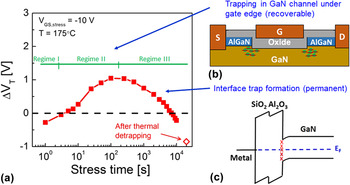
NBTI experiments under harsher stress conditions offer a very rich picture. A summary is shown in Fig. 8. Reference Guo and del Alamo65 This graph shows the evolution of V T in an experiment at a relatively high negative stress voltage at high temperatures. The evolution of V T indicates three distinct regimes. For short times, V T shifts negative (regime I). This is consistent with electron detrapping from the oxide, as discussed above. For medium times, V T shifts positive and increases with time (regime II). Eventually, V T peaks and starts shifting negative (regime III). At the end of the experiment, we are left with a nonrecoverable negative V T shift.
(a) ΔV T as a function of stress time for V GS,stress = −10 V at 175 °C. The open symbol at the end indicates final ΔV T after a benign thermal detrapping step. (b) Channel trapping mechanism postulated for regime II. Through a combination of thermal emission and tunneling, electrons from the valence band get trapped in defect states as a result of the high vertical electric field in the GaN channel caused by a high reverse bias stress. Trapping preferentially takes place in the GaN channel under the source and drain edges of the gate. (c) Energy band diagram illustrating the formation of interface states responsible for regime III and the final nonrecoverable degradation.

Further experiments Reference Guo and del Alamo65 have indicated that regime II is fully recoverable, and it comes accompanied by a recoverable increase in S and a small recoverable drop in g m. Temperature accelerates all changes. This is a puzzling set of results that can be explained by electron trapping in the GaN substrate under the gate edges, as illustrated in Fig. 8(b). In this hypothesis, under a high negative gate bias, a strong vertical electric field appears under the edges of the gate. This enables electron trapping in defect states close to the valence band inside the GaN band gap. This process involves electron tunneling, but it also has a thermal component. Electron trapping in this region lifts the bands of the GaN channel up, effectively increasing the local hole concentration under both edges of the gate. This temporarily shifts V T positive, increases S, and reduces g m. This mechanism is fully reversible. A similar mechanism has been invoked to explain current collapse under the edge of the field plates in high-voltage AlGaN/GaN MIS-HEMTs. Reference Jin, Joh, Krishnan, Tipirneni, Pendharkar and del Alamo43
Under harsher conditions (high negative stress voltage or very long stress time), the situation changes again: V T shifts negative, S increases, and g m drops. At the end of the experiment, even after thermal detrapping, we are left with a permanent net ΔV T < 0, a permanent increase in S, and a permanent drop in g m. Reference Guo and del Alamo65 There is an excellent correlation between the permanent changes in V T, S, and g m for a broad range of stress time/temperature/voltage combinations. This is all consistent with the formation of interface states as a result of, perhaps, broken H bonds at the oxide/semiconductor interface. Similar phenomena have been documented to take place in other MOS systems. Reference Ribes, Mitard, Denais, Bruyere, Monsieur, Parthasarathy, Vincent and Ghibaudo19,Reference Wrachien, Cester, Wu, Ye, Zanoni and Meneghesso66
To summarize our BTI studies in the GaN MOS system with a SiO2/Al2O3 composite dielectric, under moderate stress conditions, the dominant source of instability appears to be reversible electron trapping and detrapping in preexisting defects in the gate oxide. Under harsh stress, nonrecoverable interface state formation at the oxide/semiconductor interface is also likely to be taking place. Not easily recoverable deeper trapping in the oxide might be a factor as well. The well-behaved power law dependencies observed for oxide trapping and detrapping suggest the possibility of lifetime models that can be used by circuit and system designers. Deposition conditions and postdeposition process treatments are likely to impact the density, energy distribution, and characteristic energy of the responsible traps. Other dielectrics such as SiO2, Si3N4, or others are likely to behave in different ways. Reference Guo and del Alamo39 Systematic studies need to be carried out.
Our experimental methodology has been able to tease these mechanisms out of a background of trapping in the GaN channel/substrate, which can affect the electrical behavior of the device in a major way. In actual power AlGaN/GaN MIS-HEMTs, all the phenomena come in action at the same time. Without proper physical understanding, it will be difficult to develop a sense of the most relevant mechanisms at the selected operating conditions and to develop suitable lifetime models. Our work is a contribution in this direction, but much more work is needed.
IV. CONCLUSIONS
We have summarized recent research in the instability and electrical reliability of GaN MIS-HEMTs for power management applications. These devices offer impressive performance but widespread commercial use is prevented due to concerns on ruggedness and stability. In this article, we have focused on issues associated with the introduction of a gate dielectric in GaN MIS-HEMTs. Among them, TDDB and bias-temperature instability are major concerns. Studies of these phenomena in these devices are complicated by the severe trapping that takes place in the semiconductor and at interfaces and the complexity of the layer structure. We have devised experimental techniques to work around these difficulties. The picture that emerges is largely one of the classical metal-insulator-semiconductor behaviors observed in other dielectric/semiconductor systems. This gives us the confidence that suitable device lifetime models can be developed for circuit and system designers to use.