

ADULT GLIAL PROGENITOR CELLS ARE WIDELY DISTRIBUTED THROUGHOUT ADULT HUMAN BRAIN
Glial progenitor cells (GPCs) comprise the most abundant progenitor cell population of the adult mammalian brain. These cells, often described as oligodendrocyte progenitor cells, were first isolated from rodent optic nerve in the 1980s by Raff and colleagues, and were initially characterized as bipotential for both oligodendrocytes and type-2 astrocytes in culture (Raff et al., Reference Raff, Miller and Noble1983; Temple and Raff, Reference Temple and Raff1985; ffrench-Constant and Raff, Reference ffrench-Constant and Raff1986). GPCs have since been isolated from all regions of the rodent nervous system (Hardy and Reynolds, Reference Hardy and Reynolds1991; Zhang et al., Reference Zhang, Ge and Duncan1999). In the developing central nervous system (CNS), GPCs – as defined by NG2 and/or PDGFαR expression – are responsible for the generation of oligodendrocytes and myelin, as well as for the generation of at least some parenchymal astrocytes (Rivers et al., Reference Rivers, Young, Rizzi, Jamen, Psachoulia and Wade2008; Zhu et al., Reference Zhu, Bergles and Nishiyama2008). In the adult brain, GPCs may be responsible for the oligodendrocyte regeneration and remyelination that follows various CNS insults (Franklin, Reference Franklin2002). In addition, they may account for homeostatic turnover of both glial progenitors and some parenchymal astrocytes, as well as some aspects and phenotypes of reactive gliosis, although the latter point remains controversial (Dimou et al., Reference Dimou, Simon, Kirchhoff, Takebayashi and Gotz2008).
In the human brain, GPCs were first identified histologically using antibodies against either PDGFαR or the gangliosides recognized by the A2B5 antibody (Scolding et al., Reference Scolding, Franklin, Stevens, Heldin, Compston and Newcombe1998); post-mitotic pre-oligodendrocytes were then identified in cultures of human white matter, using a monoclonal antibody against an oligodendrocytic sulfatide, MAb O4 (Armstrong et al., Reference Armstrong, Dorn, Kufta, Friedman and Dubois-Dalcq1992; Gogate et al., Reference Gogate, Verma, Zhou, Milward, Rusten and O'Connor1994). However, while this antibody recognizes mitotic oligodendrocytes and GPCs in adult rodent tissues, it does not do so in humans, in whom its expression seems restricted to post-mitotic, oligodendroglially-committed cells (Kirschenbaum et al., Reference Kirschenbaum, Nedergaard, Preuss, Barami, Fraser and Goldman1994). Rather, mitotic GPCs were first isolated from the human subcortical white matter using CNP promoter-driven, GFP-based fluorescence-activated cell sorting (FACS) (Roy et al., Reference Roy, Wang, Harrison-Restelli, Benraiss, Fraser and Gravel1999; Nunes et al., Reference Nunes, Roy, Keyoung, Goodman, McKhann and Jiang2003), and later by A2B5-directed FACS (Windrem et al., Reference Windrem, Roy, Wang, Nunes, Benraiss and Goodman2002; Nunes et al., Reference Nunes, Roy, Keyoung, Goodman, McKhann and Jiang2003). These cells proved relatively abundant, comprising between 3 and 4% of all cells within the normal adult human white matter. Importantly, although previously described in humans as white matter progenitor cells (Goldman, Reference Goldman2003), GPCs are not restricted to adult human white matter. To the contrary, we have recently established that 3.2±0.6% (n = 14) of all cells within dissociates of adult human temporal cortical gray matter can be identified as A2B5+ GPCs (unpublished data).
HUMAN GPCs ARE MYELINOGENIC IN VIVO
Acutely isolated human GPCs, whether enriched by A2B5 or P/CNP2:GFP-based sorting, typically differentiate as both oligodendrocytes and astrocytes in vitro (Roy et al., Reference Roy, Wang, Harrison-Restelli, Benraiss, Fraser and Gravel1999; Windrem et al., Reference Windrem, Roy, Wang, Nunes, Benraiss and Goodman2002). If provided a culture environment permissive for oligodendrocytic differentiation, human GPCs follow the typical program of in vitro rodent oligodendrocytic differentiation; they serially express the oligodendroglial maturation markers O4 and O1, which recognize sulfatide and galactocerebroside, respectively, and ultimately develop as morphologically mature oligodendrocytes. In vivo, isolates of adult human GPCs are highly myelinogenic, ensheathing host axons once xenografted into either the adult demyelinated or congenitally hypomyelinated rodent brain. In particular, we have found that when transplanted into lysolecithin-demyelinated callosal lesions, adult human GPCs can differentiate as CNP+/MBP+ oligodendrocytes, that can efficiently enwrap and remyelinate surviving resident axons (Windrem et al., Reference Windrem, Roy, Wang, Nunes, Benraiss and Goodman2002).
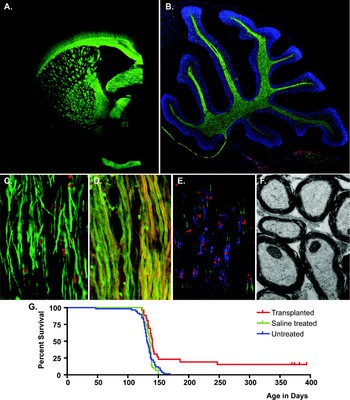
Once the ability of adult human GPCs to ensheath demyelinated axons was demonstrated, their myelinogenic potential was assessed more systematically, following perinatal xenograft into the hypomyelinated shiverer mouse forebrain (Windrem et al., Reference Windrem, Nunes, Rashbaum, Schwartz, Goodman and McKhann2004). The adult GPCs differentiated as MBP-expressing oligodendrocytes within 4 weeks after engraftment, and went on to achieve widespread and dense myelination by 12 weeks. On that basis, with the goal of establishing a more abundant source of potentially myelinogenic human GPCs for experimental therapeutics, we assessed the incidence and lineage competence of GPCs derived from the second trimester fetal human forebrain. We found that in contrast to their adult-derived counterparts, A2B5+/PSA-NCAM− GPCs derived from the fetal human brain took 8 weeks to generate appreciable numbers of myelinating oligodendrocytes, and at least 12 weeks to generate the same level of myelination achieved within just 4 weeks by adult GPCs (Windrem et al., Reference Windrem, Nunes, Rashbaum, Schwartz, Goodman and McKhann2004). In both fetal and adult xenografts, the human donor GPCs developed as astrocytes and myelinating oligodendrocytes in a context-dependent fashion, such that those donor cells that engrafted presumptive white matter developed as oligodendrocytes, whereas those invading cortical and subcortical gray developed largely as astrocytes. Yet the majority of donor cells engrafted the white matter, so that within 3 months after a single intracerebral injection of donor GPCs into neonatal shiverer mice, whether of fetal or adult origin, the hosts typically expressed MBP throughout the entire extents of their corpus callosa and internal capsules, to and beyond the cerebral peduncles (Fig. 1A–C). The myelin produced by these cells was ultrastructurally normal, with the reconstitution of dense myelin characterized by major dense lines, normal G-ratios and reestablished nodal architecture (Fig. 1D) (Windrem et al., Reference Windrem, Nunes, Rashbaum, Schwartz, Goodman and McKhann2004; Goldman et al., Reference Goldman, Schanz and Windrem2008); furthermore, fetal GPCs proved capable of fully rescuing the shiverer mouse, in terms of both its survival and neurological phenotype (Fig. 1E) (Windrem et al., Reference Windrem, Schanz, Guo, Tian, Washco and Stanwood2008).
Glial progenitor cell (GPC) implants remyelinate the congenitally unmyelinated shiverer brain. (A) One year-old shiverer mouse, transplanted at birth with 3 × 10⁵ human GPCs, stained for myelin basic protein (MBP, green). (B) cerebellum, sagittal section, one year-old transplanted shiverer; MBP, green, human nuclei (hN), red, DAPI, blue. (C) Human glial progenitors differentiate as MBP+ oligodendrocytes in the corpus callosum; MBP, green; human nuclei, red. (D) Myelinated fibers corpus callosum, year-old mouse, coronal; MBP, green; neurofilament (NF), red. (E) Normalization of nodal architecture at nodes of Ranvier, sagittal section of cervical spinal cord; caspr2, green; contactin, blue; ßIV-spectrin, red. (F) Electron micrograph of myelinated axons in the spinal cord (year-old shiverer). (G) Kaplan–Meier graph survival plot reveals the overall extension of survival and specific rescue of a fraction of transplanted shi/shi mice. From Ben-Hur and Goldman (Reference Ben-Hur and Goldman2008).

Thus, both fetal and adult-derived human GPCs proved capable of efficient and widespread myelination of recipient unmyelinated tissues, whether hypomyelinated or demyelinated. This observation suggested the potential therapeutic utility of human GPC grafts in a variety of both pediatric and adult myelin disorders, an extensive topic that we have recently reviewed elsewhere (Keyoung and Goldman, Reference Keyoung and Goldman2007; Goldman et al., Reference Goldman, Schanz and Windrem2008). Yet besides the potential significance of this work to experimental therapeutics in myelin disease, these studies revealed a number of intriguing observations in regard to the cell biology of parenchymal GPCs. In particular, we noted that adult GPCs were clearly more biased towards oligodendrocyte differentiation than their fetal counterparts, as they yielded a larger proportion of oligodendrocytes, myelinated more quickly and with higher efficiency, and ensheathed greater numbers of axons per donor cell, than did fetal GPCs (Windrem et al., Reference Windrem, Nunes, Rashbaum, Schwartz, Goodman and McKhann2004). This difference was not due to any deficit in the ability of fetal GPCs to myelinate the shiverer forebrain; to the contrary, despite their longer latencies to differentiation, neonatally transplanted fetal GPCs proved able to eventually myelinate the entire neuraxis, resulting in the frank rescue of otherwise-doomed shiverer homozygotes (Windrem et al., Reference Windrem, Schanz, Guo, Tian, Washco and Stanwood2008). Rather, the more rapid rate of myelination by adult GPCs suggests that these cells are more phenotypically committed than their fetal counterparts, and are primed to undergo more rapid terminal differentiation in vivo, with the more frequent assumption of oligodendrocytic fate.
ADULT GPCs RETAIN NEUROGENIC POTENTIAL
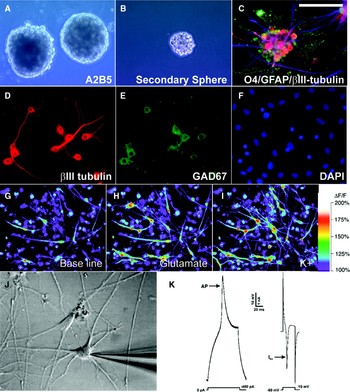
Despite their nominal description as GPCs, adult glial progenitors retain the capacity to generate neurons upon removal from their tissue environment (Roy et al., Reference Roy, Wang, Harrison-Restelli, Benraiss, Fraser and Gravel1999; Belachew et al., Reference Belachew, Chittajallu, Aguirre, Yuan, Kirby and Anderson2003; Nunes et al., Reference Nunes, Roy, Keyoung, Goodman, McKhann and Jiang2003). Roy et al. first noted that adult human GPCs generated occasional neurons once removed to low-density, high-purity culture, suggesting that once removed from autocrine and paracrine agents, the cells revealed a broader lineage capacity than previously appreciated (Roy et al., Reference Roy, Wang, Harrison-Restelli, Benraiss, Fraser and Gravel1999). In subsequent experiments (Nunes et al., Reference Nunes, Roy, Keyoung, Goodman, McKhann and Jiang2003), the authors followed up this observation by isolating adult human GPCs and raising them in low-density suspension culture, in which they efficiently expanded as neurospheres. These GPC-derived neurospheres generated neurons as well as astrocytes and oligodendrocytes, and could be observed to do so clonally (Nunes et al., Reference Nunes, Roy, Keyoung, Goodman, McKhann and Jiang2003). The neurons that differentiated from these adult GPC-derived neurospheres were largely GABAergic, and responded with both substantial calcium transients and action potentials to depolarization (Fig. 2). Of note, when freshly isolated adult GPCs were directly xenografted into prenatal rat brain, donor cells differentiated into representatives of all three major neural lineages, including neurons; the latter were noted in the striatum, hippocampus and olfactory bulb, all areas whose local environments support late and/or postnatal neurogenesis (Nunes et al., Reference Nunes, Roy, Keyoung, Goodman, McKhann and Jiang2003). This observation suggested that no reprogramming events were necessary for the emergence of neurogenesis by adult human parenchymal GPCs. In parallel studies of adult rodent GPCs, NG2-defined GPCs were likewise found to be intrinsically neurogenic and multipotent (Belachew et al., Reference Belachew, Chittajallu, Aguirre, Yuan, Kirby and Anderson2003; He and Shen, Reference He and Shen2009). Interestingly, NG2+ cells identified as adventitial perivascular cells were similarly observed to generate neurons in the adult primate hippocampus (Yamashima et al., Reference Yamashima, Tonchev, Vachkov, Popivanova, Seki and Sawamoto2004). In contrast to these observations with adult GPCs, the acquisition of multilineage competence by neonatally derived glial progenitors has only been reported after BMP-initiated astrocytic differentiation, followed by reprogramming in sustained culture (Kondo and Raff, Reference Kondo and Raff2000). Nonetheless, other groups have reported ample numbers of multipotential progenitors in the parenchyma of both developing and adult brain, that have not been otherwise isolated or explicitly identified as glial in nature (Pincus et al., Reference Pincus, Harrison-Restelli, Barry, Goodman, Fraser and Nedergaard1997; Palmer et al., Reference Palmer, Markakis, Willhoite, Safar and Gage1999; Arsenijevic et al., Reference Arsenijevic, Villemure, Brunet, Bloch, Deglon and Kostic2001; He et al., Reference He, Ingraham, Rising, Goderie and Temple2001). Yet given the largely non-quantitative nature of these studies, whether the multilineage-competent progenitors that persist in adult brain tissue comprise minor subpopulations of multipotential cells within a much larger pool of restricted glial progenitors, or whether they instead reflect a universal, context-dependent emergence of a multipotent phenotype by GPCs once removed from their tissue environment, remains unclear. In this regard, transgenic fate-mapping studies have shown that PDGFαR-defined GPCs continue to generate neurons well into adulthood, although in vivo neurogenesis by tagged GPCs was restricted to granule neurons within the pyriform cortex (Rivers et al., Reference Rivers, Young, Rizzi, Jamen, Psachoulia and Wade2008).
Adult human WMPC were multipotential giving rise to functionally mature neuronsin vitro. (A) First-passage spheres generated from A2B5-sorted cells 2 weeks after sorting. (B) Second-passage sphere derived from an A2B5-sorted sample, at 3 weeks. (C) Once plated onto substrate, the primary spheres differentiated into βIII-tubulin+ neurons (red), GFAP+ astrocytes (blue) and O4+ oligodendrocytes (green). (D–F) Neurons derived from white matter progenitor cells expressed a GABAergic phenotype. (D) The outgrowth of a WMPC-derived neurosphere, stained for neuronal βIII-tubulin after 35 DIV (21 days in serum-free media with FGF/NT3/PDGF, then 14 days in 2% FBS with 20 ng/ml BDNF). (E) Concurrent immunostaining for GAD67, indicating that all nine neurons in the field are GAD67+, and thus likely GABAergic neurons. (C) DAPI nuclear labeling reveals the abundance of cells in the field. (G–I) White matter progenitor cell-derived neurons developed neuronal Ca2+ responses to depolarization. (G) Shows an image of WMPC-derived cells loaded with the calcium indicator dye fluo-3, 10 days after plating of first passage spheres derived from A2B5-sorted white matter (35 DIV total); many fiber-bearing cells of both neuronal and glial morphologies are apparent. (H) Same field after exposure to 100 µM glutamate, and (I) after exposure to a depolarizing stimulus of 60 mM KCl. The neurons displayed rapid, reversible, >100% elevations in cytosolic calcium in response to K+, consistent with the activity of neuronal voltage-gated calcium channels. Scale = 80 µm. (J,K) Whole cell patch-clamp revealed voltage-gated sodium currents and action potentials in WMPC-derived neurons. (J) A representative cell 14 days after plating of a first passage sphere derived from A2B5-sorted white matter. The cell was patch clamped in a voltage-clamped configuration, and its responses to current injection recorded. (K) The fast negative deflections noted after current injection are typical of the voltage-gated sodium currents of mature neurons. Action potentials were noted only at I Na > 800 pA. Modified from Nunes et al. (Reference Nunes, Roy, Keyoung, Goodman, McKhann and Jiang2003).

Whether fetal and early postnatal GPCs differ from their adult counterparts in terms of their neurogenic competence is unclear, as different age-defined GPCs have not yet been directly compared in a given species, under a defined set of culture conditions, in terms of their lineage potential. Nonetheless, fetal and early postnatal GPCs clearly differ from adult GPCs in a number of other cell-autonomous features. In particular, besides the greater efficiency and relative bias of adult glial progenitors towards oligodendrocytic maturation and myelination, as previously noted (Windrem et al., Reference Windrem, Nunes, Rashbaum, Schwartz, Goodman and McKhann2004), adult glial progenitors also differ markedly from their fetal counterparts in their slower turnover, longer cell cycle and diminished self-renewal capacity (Noble et al., Reference Noble, Wren and Wolswijk1992; Windrem et al., Reference Windrem, Nunes, Rashbaum, Schwartz, Goodman and McKhann2004). These differences might be explained by differences in the chromatin structure of adult and neonatal progenitors. The GPCs of aged rodents have been reported to exhibit substantial epigenetic reprogramming, including the inactivation of histone deacetylases and re-expression of the neural progenitor markers such as sox2 (Shen et al., Reference Shen, Liu, Li, Wolubah and Casaccia-Bonnefil2008a,Reference Shen, Sandoval, Swiss, Li, Dupree and Franklinb). Interestingly, sox2 protein is also expressed by Olig2- and NG2-defined GPCs in the adult human white matter (unpublished observations), while the transcript profile of A2B5-isolated GPCs suggests high relative expression of the undifferentiated neural progenitor transcription factors Mash1 and Hes1 (Sim et al., Reference Sim, Lang, Waldau, Roy, Schwartz and Pilcher2006). Together, these expression data suggest that the epigenetic state of adult GPCs, while biased to glial and especially oligodendrocytic fate, nonetheless remains permissive for multilineage differentiation.
THE OLIGONEOGENIC NICHE: THE MOLECULAR PROFILE OF ADULT GPCs PREDICTS THEIR RESPONSIVENESS TO CUES
The signaling pathways that regulate GPC homeostasis and fate decisions in the adult human brain are not well understood. Yet since GPCs do not appear to generate neurons unless removed from their local environment, it seems evident that the adult tissue environment may actively modulate the commitment of GPCs, to prevent the expression of their latent neurogenic potential (Sim and Goldman, Reference Sim and Goldman2005). Just as rodent neural progenitors lose their capacity to generate new neurons when transplanted into non-neurogenic regions (Gage, Reference Gage2000; Lim et al., Reference Lim, Tramontin, Trevejo, Herrera, Garcia-Verdugo and Alvarez-Buylla2000), GPCs may retain some competence for neuronal differentiation once provided a neurogenic niche (Nunes et al., Reference Nunes, Roy, Keyoung, Goodman, McKhann and Jiang2003). This responsiveness of adult human GPCs to environmental cues seems critical not only to their potential for neurogenesis, but more typically and broadly, to their ability to generate oligodendrocytes in the setting of demyelination, or perhaps astrocytes in the setting of parenchymal injury. To better understand the molecular regulation of such fate choices exhibited by adult human GPCs, we have sought to identify the major cell–cell signaling pathways specific to resident adult human GPCs, as a means of better predicting and directing their responses to both pathological and therapeutic stimuli.
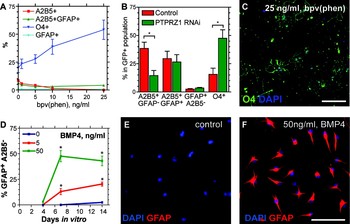
To this end, we have begun to define the RNA expression patterns, and hence enabled signaling mechanisms, of A2B5-isolated adult human GPCs. We first performed expression analysis using Affymetrix U95 microarrays, by which we compared the A2B5-sorted GPC profile to the white matter tissue from which the cells derived. From three patients, we performed a pair-wise approach to identify those transcripts whose expression was significantly enriched in human GPCs (Sim et al., Reference Sim, Lang, Waldau, Roy, Schwartz and Pilcher2006). Following multiple-testing correction, we identified 132 genes as significantly over-expressed in GPCs relative to their tissue environment. These included a number of cell surface receptors expressed at high levels along with their cognate ligands, suggesting the presence of several active autocrine signaling pathways in GPCs. We confirmed the functional importance of two of these pathways, the perturbation of which induced either oligodendrocytic or astrocytic commitment under conditions otherwise permissive for self-renewing division. The first of these was represented by the receptor tyrosine phosphatase PTPRZ1, whose only known ligand pleiotrophin (PTN) was also highly expressed, along with PTPRZ1's in cis binding partners, tenascin-R, NrCAM, and the chondroitin sulfate proteoglycans. Importantly, the phosphatase domain of PTPRZ1 has been shown to target β-catenin for tyrosine dephosphorylation and sequestration at the plasma membrane by cadherin (Meng et al., Reference Meng, Rodriguez-Pena, Dimitrov, Chen, Yamin and Noda2000). On this basis, we predicted that the inhibition of PTPRZ1 might interfere with canonical WNT signaling through β-catenin, and thereby abrogate GPC self-renewal. We thus challenged this pathway with both bpV(Phen), an oxovanadate inhibitor of receptor tyrosine phosphatases, and a specific lentiviral shRNAi directed against the chondroitin sulfate binding region of PTPRZ1. We found that treatment of GPCs with bpV(phen) induced a dose-dependent induction of O4-defined oligodendrocytic commitment, just as infection with lenti-PTPRZ1 shRNAi resulted in the similar induction of oligodendrocyte differentiation; together, these data indicated that the differentiative effect of bpV(phen) accrued to the inhibition of PTPRZ1 (Fig. 3).
Directed induction of GPC fate commitment via PTPRZ1 and BMP pathways. (A) Dose response curves of the proportion of A2B5-defined progenitors versus O4-defined oligodendrocytes, as a function of bpV(phen) dose. (B) Plots the respective incidences of A2B5+ progenitors and O4+ oligodendrocytes as a function of lentiviral PTPRZ1 shRNAi treatment (±SEM, n = 4). (C) GPCs treated with 25 ng/ml bpV(phen) for 7 days in vitro were stained for O4. (D) Plots the proportion of GFAP+A2B5− identified astrocytes as a function of time after addition of either 0, 5 or 50 ng/ml BMP4. (E,F) Show the pronounced induction of a GFAP+A2B5− astrocytic phenotype by 50 ng/ml BMP4, when assessed at 7 DIV. *Indicates significant difference, p < 0.01. Scale bar, 10 µm. Modified from Sim et al. (Reference Sim, Lang, Waldau, Roy, Schwartz and Pilcher2006).

Besides the PTPRZ1 pathway, we also identified BMP signaling as an important regulator of human GPC self-renewal. Active BMP signaling can promote the differentiation of neural progenitors towards an astrocytic fate, and in so doing inhibit both neurogenesis and oligodendroglial differentiation (Gross et al., Reference Gross, Mehler, Mabie, Zang, Santschi and Kessler1996). Adult human GPCs expressed high levels of the BMP antagonists BAMBI, a dominant-negative BMP receptor 1-like protein, and neuralin/CHRDL1, a secreted BMP antagonist similar to chordin (Sim et al., Reference Sim, Lang, Waldau, Roy, Schwartz and Pilcher2006). This suggested that GPCs might effectively protect themselves from BMP signaling, by a two-tiered strategy of cell-autonomous BMP inhibition, thereby permitting their undifferentiated self-maintenance. On that basis, we tested the effects of BMP signaling upon isolated GPCs. We found that BMP4 (5 ng/ml) – but not the related ligands BMP-2 and BMP-7, induced the rapid acquisition of astrocytic phenotype, confirmed by high level GFAP-expression by 7 days in vitro (Fig. 3) (Sim et al., Reference Sim, Lang, Waldau, Roy, Schwartz and Pilcher2006). In contrast, this process of BMP-induced astrocyte commitment could be blocked by exogenous noggin, a broad-spectrum BMP antagonist. Indeed, noggin-treatment encouraged the self-renewing expansion of adult human GPCs, consistent with the active secretion of BMP ligands by these cells. These data suggest that adult human GPCs in vivo may actively prevent their own differentiation, which may rather be induced by local injury or disease, or by removal to a niche permissive for terminal differentiation (Sim et al., Reference Nunes, Roy, Keyoung, Goodman, McKhann and Jiang2006). Together, these observations suggest the active cell-autonomous support of self-renewal by GPCs in the adult human white matter parenchyma.
THE PROFILE OF HUMAN A2B5+ GPCs IS READILY DISTINGUISHED FROM THAT OF ASTROCYTES AND MICROGLIA
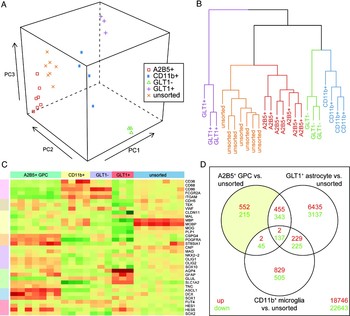
To more precisely determine the molecular phenotype of human GPCs, we extended our genomics analyses of A2B5-sorted human GPCs. We isolated adult GPCs from matched white and gray matter dissociates of temporal lobes taken from four patients with medication-refractory epilepsy, using A2B5-based magnetic cell sorting as previously described (Sim et al., Reference Sim, Lang, Waldau, Roy, Schwartz and Pilcher2006) (ages 30–46 years). RNA was extracted from A2B5-sorted cells and their corresponding unsorted white and gray matter dissociates, and then analyzed using Affymetrix U133+2 arrays. This platform interrogated >20,000 genes, more than three times the number of genes represented in our initial analysis using U95 arrays (Sim et al., Reference Sim, Lang, Waldau, Roy, Schwartz and Pilcher2006). To better define those transcripts specifically regulated in GPCs, we also isolated and profiled the expressed transcripts of CD11b+ microglia (n = 4, ages 9–53 years), and GLT1+ astrocytes (n = 3, ages 9–19 years), using MACS followed by microarray analysis. RNA was also profiled from the matched GLT1− fraction as a control pool. These arrays formed a large data set that included 24 arrays from seven distinct cell populations. Briefly, raw data were preprocessed and normalized using the RMA approach (Irizarry et al., Reference Irizarry, Bolstad, Collin, Cope, Hobbs and Speed2003), and non-informative data were removed as described (Talloen et al., Reference Talloen, Clevert, Hochreiter, Amaratunga, Bijnens and Kass2007). Our initial analyses, which included principal component analysis and hierarchical clustering, illustrated clear distinctions between the GPC (A2B5), astrocyte (GLT1) and microglial (CD11b) expression profiles (Fig. 4A,B). In addition, the expression levels of a broad panel of cell type-selective marker genes validated the specificity of our cell isolation strategies (Fig. 4C). We found that the A2B5-sorted GPCs expressed very high and significant levels, relative to unsorted cells, of the prototypic GPC transcripts PDGFαR (PDGFRA, 12-fold higher than unsorted cells; false-discovery rate (FDR)-corrected q-value = 4.7 × 10⁻⁸) and NG2 (CSPG4, 7.2-fold; q = 2.0 × 10⁻⁷), as well as the enzyme responsible for A2B5 synthesis, GD3 synthase (ST8SIA1; 6-fold, q = 4.2 × 10⁻⁸). In contrast, CD11b+ microglial cells expressed very low levels of these GPC-markers, but high levels of RNAs encoding the microglial proteins CD36, CD68, CD86 and FcR, as well as CD11b itself (each >3-fold higher than in unsorted cells). Similarly, astrocytes isolated on the basis of GLT1-immunoreactivity exhibited high level expression of the astrocytic transcripts AQP4, GFAP, glutamine synthase (GLUL) and GLT1 (SLC1A2) (each >5-fold higher than in controls).
Whole transcriptome analysis of adult human glial progenitors. Adult human glial progenitors were isolated from patients with medically refractory epilepsies, using immunomagnetic cell sorting (MACS) based on A2B5-immunoreactivity. The Affymetrix U133+2 microarray expression profiles of these A2B5+ GPCs were then compared to profiles generated from matched unsorted white and gray matter dissociates, as well as to the profiles of GLT1-sorted astrocytes and CD11b-sorted microglial cells. Initial exploratory data analysis employed both principal component analysis (A) and hierarchical clustering of the Euclidean distances (B) between samples of informative probe sets, from RMA-normalized data. Clear distinctions between each cell population were noted. (C) The expression of cell type-specific marker genes illustrates the relative enrichment of GPC, microglial and astrocytic genes, in A2B5, CD11b and GLT sorted cells, respectively (heatmap: red = high expression; green = lower expression). END = endothelial, NPC = neural progenitor cell, NSC = neural stem cell. (D) Differential gene expression was performed using linear modeling, as an empirical Bayes test statistic with >3-fold change and 5% FDR cut-offs. The gene expression of each cell type was compared to that of the tissue dissociate from which it derived. The number of individual differentially expressed probe sets are shown in the Venn diagram. Although there is some overlap of A2B5+ GPC and GLT1+ astrocyte profiles, the three cell populations are clearly distinct from one another.

Once we had developed these data sets, we performed differential gene expression analysis to quantify the differences in mRNA expression between these populations. Using a Bayesian linear model approach (Smyth, Reference Smyth2004), we compared A2B5+ GPCs, GLT1+ astrocytes and CD11b+ microglia to unsorted dissociates of white and gray matter, from age-matched patients. Statistically significant differences were assessed following multiple testing correction, using a 5% false discovery rate, and only those genes expressed at levels >3-fold relative to unsorted cells were identified as enriched in the cell type of interest (Fig. 4D). We next defined GPC-specific genes as those that were significantly expressed in A2B5+ GPCs, but not over-expressed in either the GLT1+ or CD11b+ populations. By this means, we identified >300 genes as specifically expressed by adult human GPCs, relative to both astrocytes and microglial cells, as well as to their unsorted dissociates. As expected, these included the known GPC markers, PDGFRA, CSPG4 and ST8SIA1. Indeed, overall our U95 and U133+2 data sets were highly homologous (Fig. 5A).
HUMAN GPCs ARE MOLECULARLY DISTINCT FROM THEIR MOUSE OPC HOMOLOGS
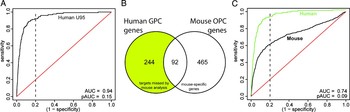
To assess the potential differences between human and mouse GPCs, we next compared the U133+2 based profile of A2B5+ GPCs to that of mouse GPCs, using a previously published profile (Cahoy et al., Reference Cahoy, Emery, Kaushal, Foo, Zamanian and Christopherson2008). Of the 894 genes defined as significantly expressed by mouse GPCs (>5-fold change; see Supplemental Table 17 of Cahoy et al., Reference Cahoy, Emery, Kaushal, Foo, Zamanian and Christopherson2008), human homologs were found for 691; 557 of these were represented in the human profiles. A simple statistical comparison of these genes with human GPC-enriched genes suggested a significant overlap (Fisher's exact test, p < 1 × 10⁻¹⁵). Nonetheless, the profiles of mouse GPCs were substantially different from human GPCs (Fig. 5B,C). The importance of species differences in GPCs has been recently exemplified by Hu and colleagues (Hu et al., Reference Hu, Du, Li, Ayala and Zhang2009), who determined that whereas FGF2 signaling permits the expansion of rodent GPCs, it rather prevents acquisition of the GPC phenotype by human ES-derived neuroepithelial cells. Similarly, Nedergaard and colleagues recently reported substantial differences in the morphological phenotypes of rodent and human astroglia (Oberheim et al., Reference Oberheim, Wang, Goldman and Nedergaard2006, Reference Oberheim, Takano, Han, He, Lin and Wang2009), and have recently identified significant differences in their respective molecular signatures and dominant signaling pathways as well (unpublished). Thus, the signaling pathways that regulate human GPCs cannot be assumed to be identical to those of rodent cells; these data suggest that pharmacological data acquired using rodent GPCs cannot be readily – or even safely – extrapolated to the modulation of human GPCs, whether for purposes of induced remyelination or astroglial suppression. These data suggest that for preclinical modeling, human GPCs should best be evaluated directly, both in vitro and after xenograft in vivo, lest inappropriate mechanistic conclusions be drawn from the molecular analysis of rodent GPCs.
The gene expression patterns of human and mouse adult GPCs differ significantly. (A) Receiver Operating Characteristic (ROC) curve analysis was used to compare the original U95 array format-based analysis of human GPCs against the current U133+2 profiles. Raw probe set data were annotated to provide unique gene identifiers, and then ranked according to the significance of differential gene expression in human A2B5+ cells relative to unsorted white and gray matter dissociates (U133+2 data, x-axis). The black line starting at the origin represents whether or not each mtaching gene was deemed significant in the U95 analysis (Sim et al., Reference Sim, Lang, Waldau, Roy, Schwartz and Pilcher2006), moving up one position if significant and to right if not significant. The red line indicates the line of no discrimination, representing random gene selection. A perfect predictor of significance of the U95-derived gene list in the U133+2 data set would be represented as an inverted ‘L’ shape. the upward deflection of the line thus indicates the extent of overlap between the two profiles. This is quantified as area under the curve (AUC) and partial AUC at 20% FDR (pAUC). The high values for both indicates that the U95 data closely agree with the U133 data, even at high specificity. (B,C) Comparison of human and mouse GPC transcript profiles. (B) Venn analysis of the overlap of human (U133) and mouse (Barres) GPC-specific genes. A total of 557 unique human homologs of mouse GPC-specific genes were found in the human array data. While 92 of these were significantly differentially expressed by human A2B5+ GPCs, another group of over 200 genes were significantly expressed in human GPCs, yet not detectable in mouse cells. (C) ROC analysis comparing the human and mouse profiles revealed that the mouse GPC profile was distinct from their human counterpart. At 20% FDR (dashed line), the human U95 genelist is >80% sensitive (green line) whereas the mouse profile showed only approximately 50% sensitivity (black line). This suggested that while the mouse GPC profiles generally resembled those of human GPCs, there were nonetheless abundant substantive differences between the two, with ample evidence of species-specific gene expression in both mouse and human GPCs.

GENE SET ENRICHMENT ANALYSIS IDENTIFIED A GPC FATE-REGULATING STEROL HOMEOSTASIS PATHWAY
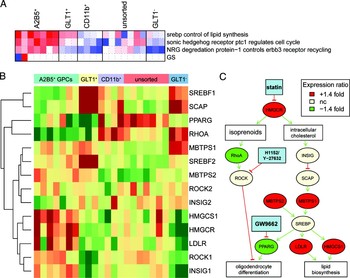
To better define the differentially activated pathways of adult human GPCs, we used our U133+2 human GPC transcriptome data set as the basis for gene set enrichment analysis (GSEA; Subramanian et al., Reference Subramanian, Tamayo, Mootha, Mukherjee, Ebert and Gillette2005) against a number of available pathway databases (PGSEA, Bioconductor). GSEA allows for the identification of relevant pathways whose constituents are significantly over or under expressed in a given gene expression data set. Unlike per-gene expression analysis, GSEA identifies pathways on the basis of the consensus expression of all pathway components, and as such is a more sensitive means by which to predict the activity of entire molecular signaling pathways. We found that GSEA using the Biocarta database identified three pathways from the 254 Biocarta gene set database (www.biocarta.com), which were both significantly enriched in A2B5+ GPCs relative to unsorted cells, and not enriched in either astrocytic or microglial comparisons (FDR adjusted q < 0.05, Fig. 6A). Remarkably, we noted that the most significantly differentially expressed of these was the lipid synthesis control pathway, as regulated by sterol-response element binding transcription factors (SREBPs) (q = 0.009). Expression analysis of each pathway component revealed that several members of this pathway were specifically expressed in GPCs (Fig. 6B). Indeed, these over-expressed components formed a coherent pathway that appeared differentially active in A2B5+ GPCs (Fig. 6C): The mRNA for 3-hydroxy-3-methylglutaryl-coenzyme A reductase (HMGCR), the rate limiting enzyme in cholesterol synthesis, was the most upstream member of this pathway, and was significantly enriched in GPCs; this was confirmed by real-time RT-PCR (Sim et al., Reference Sim, Lang, Ali, Roy, Vates and Pilcher2008). Importantly, intracellular cholesterol regulates the activity of SREBPs via the sterol-sensing proteins INSIG and SCAP (Rawson, Reference Rawson2003); while these were not over-expressed at the transcript level, their gene products were present in human GPCs. Furthermore, the SREBP-activating proteolytic enzymes S1P (MBTPS1) and S2P (MBTPS2) were both highly enriched in GPCs. Together, these observations suggested that the sterol pathway is primed to become active whenever intracellular cholesterol levels decline. The down-stream transcriptional targets of SREBP were variably expressed, but most notably, the SREBP-regulated transcription factor PPARγ was almost completely absent in adult GPCs. PPARγ has long been shown to potentiate terminal phenotypic differentiation in a number of developmental systems, including oligodendrocyte differentiation by rodent GPCs (Saluja et al., Reference Saluja, Granneman and Skoff2001). On this basis, we hypothesized that PPARγ suppression might be integral to the maintenance of mitotically competent human glial progenitors. As such, we predicted that inhibition of HMGCR, by triggering PPARγ expression, might thereby induce terminal differentiation from human GPCs.
Gene set enrichment analysis identifies the sterol synthesis pathway as especially prominent in adult human GPCs. Pathway analysis was performed using the Biocarta database of curated cell–cell signaling pathways (www.Biocarta.com). Gene set enrichment was calculated using parametric analysis of enrichment (Kim and Volsky, Reference Kim and Volsky2005) and significance assessed using a linear modeling approach. Following false discovery rate calculation, three of 254 pathways were deemed significantly enriched in human A2B5+ GPCs relative to their dissociate and not enriched in either GLT1+ astrocytes or CD11b+ microglial cells (5% FDR) (A). The most significant pathway at less than 1% FDR, SREBP control of lipid synthesis, was combined with additional manually annotated constituents. The expression values of each gene were summarized as a heatmap (B). Only data from the most variable probe set are shown following removal of non-informative probes. The genes were then assembled into a schematic pathway to illustrate the potential regulation of human GPCs by statin, and other inhibitors (C). Gene nodes in the pathway are colored according to expression in adult GPCs relative to the unsorted dissociate. Although the magnitude of gene expression of individual components was not extreme, the concerted over-expression of such a large number of enzymes in a single pathway indicates that this sterol synthesis pathway is likely highly active in adult GPCs.

STATIN TREATMENT INDUCES OLIGODENDROCYTE DIFFERENTIATION IN GPCs
To assess the role of HMGCR-dependent regulation of PPARγ in the fate determination of human GPCs, we next challenged adult human GPCs with statins, a class of drugs that are potent inhibitors of HMGCR. Using either simvastatin or pravastatin to block the activity of HMG-CoA reductase, we found that their inhibition of cholesterol synthesis induced oligodendrocytic differentiation (Sim et al., Reference Sim, Lang, Ali, Roy, Vates and Pilcher2008). This effect was dose-dependent, and was mediated by the reduction in intracellular cholesterol, since media supplementation with the downstream cholesterol precursor mevalonate abrogated the effect of statin treatment. As predicted by our genomic model, oligodendrocytic differentiation was accompanied by an induction of the mRNA encoding PPARγ (Inoue et al., Reference Inoue, Goto, Mizotani, Awata, Mastunaga and Kawai2000). Application of a PPARγ-specific antagonist, GW9662, blocked GPC differentiation induced by statin treatment, consistent with the necessity of PPARγ signaling to statin-mediated differentiation (Sim et al., 2008). Importantly, statin treatment of fetal human-derived GPCs exerts a similar effect; statin-treated fetal GPCs stop dividing and differentiate, but eventually succumb to premature death in vitro (Miron et al., Reference Miron, Rajasekharan, Jarjour, Zamvil, Kennedy and Antel2007). Antel and colleagues proposed an alternate pathway for statin action on human GPCs, via a perturbation of isoprenoid-dependent signaling, which could be mimicked by treatment with the ROCK inhibitors H1152 or Y-27632 (Miron et al., Reference Miron, Rajasekharan, Jarjour, Zamvil, Kennedy and Antel2007).
Interestingly, statins have been proposed as possible therapeutic agents for the treatment of multiple sclerosis (MS) (Stanislaus et al., Reference Stanislaus, Pahan, Singh and Singh1999; Bradbury, Reference Bradbury2002), and have been used in trials of MS patients (Vollmer et al., Reference Vollmer, Key, Durkalski, Tyor, Corboy and Markovic-Plese2004), based on their presumed immunomodulatory effects (Weber et al., Reference Weber, Prod'homme, Steinman and Zamvil2005). However, since statins have direct differentiative effects on GPCs, chronic statin treatment may risk depleting the parenchyma of functionally competent progenitors, and hence ultimately delimit myelin repair; such progenitor depletion might serve to broadly diminish the cellular plasticity of the adult brain. Indeed, recent studies examining the effect of statins in the cuprizone model of demyelination concluded that statin therapy actually reduced remyelination following cuprizone treatment (Klopfleisch et al., Reference Klopfleisch, Merkler, Schmitz, Kloppner, Schedensack and Jeserich2008; Miron et al., Reference Miron, Zehntner, Kuhlmann, Ludwin, Owens and Kennedy2009). Although the role of statin treatment in this example of impaired remyelination remains unclear, the appearance of such toxicity serves to highlight the need for understanding the signaling pathways utilized by both adult GPCs and their glial progeny, and specifically those of human origin, as a necessary antecedent to their pharmacotherapeutic targeting.
CONCLUSIONS
These studies have revealed that GPCs comprise an abundant population of mitotically competent, myelinogenic cells that persist within both the gray and white matter compartments of the adult human brain. These cells may contribute to remyelination in a variety of myelin pathologies, yet retain the capacity for multilineage commitment and may contribute to reactive gliosis. The local environment of adult GPCs appears key to their fate determination, in that perturbations of the extracellular matrix and growth factor milieu can profoundly influence their proliferation and differentiated phenotypes. Using microarray technology, we have begun to describe the operative receptors and signaling pathways that underlie both the homeostatic self-renewal and fate choices of adult GPCs. Our initial studies identified both the BMP and PTPRZ1 pathways as key regulators of GPC fate. In this article, we have defined a more detailed profile of cell type-specific gene expression by adult human GPCs, in part by comparison to the expression profiles of both human microglia and astrocytes. Our new analysis has confirmed the importance of the sterol synthesis pathway as one such key regulatory pathway. Inhibition of cholesterol synthesis via statin treatment induced PPARγ-dependent oligodendrocytic differentiation in vitro; however, this was associated with a marked reduction in competent cycling progenitors, suggesting the need for caution in the use of statins in patients with demyelinating disorders. Furthermore, our analyses revealed that while mouse GPCs resemble their human counterparts at the transcriptional level, there are substantial differences between human and mouse GPCs in the detailed compositions of their respective dominant signaling pathways. As such, the direct extrapolation from mouse to human models of target-based drug discovery efforts must be viewed with caution; in this regard, we believe that a more rigorous identification of specific molecular targets in human GPCs, and their functional validation in human cell systems, may ultimately hasten the progress of drug discovery in both the childhood and adult disorders of myelin.
ACKNOWLEDGEMENTS
We would like to thank our collaborators in these studies, including Drs. Maiken Nedergaard, Neeta Roy, Marta Nunes and Su Wang. This work has been supported by the NINDS R01NS039559, the Mathers Charitable Foundation, the Adelson Medical Research Foundation, and the National Multiple Sclerosis Society. We apologize to the many authors whose work could not be cited in this review, by virtue of our limitations in space and discussion scope.
Statement of interest
None.