

1 Introduction
In the face of growing demographic ageing many European countries have reformed their pension systems in order to make them financially more sustainable. However, in the course of pension reforms it became clear that economic sustainability is only one important policy goal. The necessary complement is adequacy of pension income (OECD, 2007; European Commission, 2010). This is of particular concern in countries with earnings-related public pensions systems, which have been experiencing high unemployment and increasing earnings inequality. Germany is a particularly interesting case facing the problem of balancing sustainability and adequacy of its earnings-related public pension system. While the pension reforms since 1992 have improved the long-term financial sustainability of the public pension system, they have substantially reduced income replacement rates. Furthermore, since reunification there has been rising and persistent unemployment, particularly in East Germany. At the same time, there has been a trend away from the ‘standard’ employment relationship covered by social security towards ‘flexible’ work patterns typically not or only partially covered by social security, such as ‘marginal employment’, temporary employment, part-time jobs, and self-employment.
The goal of the present study is to quantify the likely impact of these developments on the future level of public pensions across birth cohorts. To this end, we develop a microsimulation model that accounts for cohort effects in individual employment and unemployment and earnings over the life cycle as well as the differential impact of recent pension reforms on birth cohorts.Footnote 1 To account for cohort effects on the future level of public pensions is important for at least two reasons.
On the one hand, recently enacted pension reforms will affect younger birth cohorts to a much greater degree than cohorts that are already close to retirement. This refers to the demographic adjustment mechanism (‘sustainability factor’) which leads to pension growth lagging behind wage growth and to the raising of the legal retirement age to 67 by 2029. Furthermore, actuarial adjustments for early retirement and phasing out of special early retirement options for the unemployed and women were enacted in previous reforms. Given the relatively long phase-in period, this will also have different effects on older and younger birth cohorts.
On the other hand, the changes that have been taking place in the labour market over the past decades have affected cohorts quite differently. One of the most striking examples of the potential importance of cohort effects is the worsening of the labour market situation in East Germany in the aftermath of reunification. Birth cohorts in East Germany differ with respect to the share of their working life spent in the former German Democratic Republic (GDR) where unemployment was virtually non-existent and wages were relatively equally distributed. Pension entitlements derived from these continuous employment profiles were integrated into the West German public pension scheme. This resulted in relatively high and uniform pension entitlements of East German pensioners and of those already near retirement age. By contrast, East Germans in the middle of their career were affected quite differently by unification: during the first years of the transition process, large parts of the economy had to be rebuilt under the conditions of the new market-based system. As a consequence, redundancies and closures of factories took place on a large scale. Endowed with human capital from the former GDR, the laid-off employees had to find new jobs in the unified labour market. However, this process turned out to evolve very slowly, and the average unemployment rate in East Germany is still twice as high as in the West (Geyer and Steiner, Reference Geyer and Steiner2010). Furthermore, wage convergence almost came to a standstill in the mid-1990s, with a substantial wage differential remaining (Franz and Steiner, Reference Franz and Steiner2000; Orlowski and Riphahn, Reference Orlowski and Riphahn2009). In West Germany, the younger birth cohorts may also have been affected by the worsening of general labour market conditions. Another factor that might have contributed to differences across birth cohorts is the increasing labour force participation among women, in particular those with higher education.
The following Section 2 provides an overview of the German pension system and shows how employment biographies and the level of individual earnings are linked to pension benefits. Differences in cumulated employment and unemployment have both a direct and an indirect effect on the individual pension benefit. The direct effect relates to the cumulated employment duration, while the indirect effect works through the impact of labour market experience on life cycle earnings. Section 3 presents the data and methodology to estimate cohort effects in labour market histories and wages. We integrate these estimates into a microsimulation model that projects our estimates into the future. This allows us to account for the effects of labour market developments on individual pensions as well as the differential impact of recent pension reforms. Estimation and simulation results are summarized in Section 4. Section 5 concludes with a discussion of our main results.Footnote 2
2 The German pay-as-you-go (PAYG) pension system – basic structure and recent reforms
The German public pension scheme is a PAYG system. As such, population ageing is expected to put pressure on its financial sustainability in the coming decades, mainly due to three factors: rising life expectancy, low fertility rates, and a baby boomer generation reaching the retirement age in the coming years. As reinforcing negative factors, Germany has experienced a long-term increase in unemployment and a low effective retirement age.
The policy response to these developments was the enactment of a series of pension reforms to limit increases of the contribution rate. On the one hand, federal subsidies to the public pension system have been extended. On the other hand, the government has reduced the generosity of the pension system. The reforms go mainly in two directions: first, the extension of the working life, and second, the gradual lowering of the pension level.
Starting in 1992, actuarial adjustments for early retirement were introduced with a relatively long phase-in period. For each month of early retirement the benefit is lowered by 0.3% (3.6% per year). Currently, people retiring at 60 might lose a maximum of 18% of their pension benefit. Furthermore, special early retirement options for the unemployed and women were phased out. In 2001, a subsidized pre-funded pillar of private pensions was introduced. In 2004, the benefit indexation was changed by introducing a ‘sustainability factor’ that takes into account the ratio of contributors and pensioners. According to the new benefit indexation rule, pensions will grow at a lower rate than wages as long as this ratio declines. In 2007, a law came into effect that will increase the statutory retirement age incrementally from 65 to 67 by 2029.
Public pensions in Germany are closely linked to an individual's lifetime employment and wage income relative to average earnings, with relatively few redistributive elements (Schröder, Reference Schröder2012). It is calculated according to the following formula:
 $$PB_{T \plus s} \equals \left( {\mathop {\sum} \limits_{t \equals \setnum{1}}^{T} PP_{t} } \right) \times PT_{T} \times EF_{T} \times CPV_{T \plus s} \comma s \equals 0\comma 1\comma \ldots \comma S\comma $$
where PB is the monthly pension benefit; PP the pension point; CPV thethe current pension value; PT the pension type factor; EF the entry factor; s the years after retirement until S (death); T the year of entering retirement.
For old-age pensions PT=1, and it is less than one for other pension types, e.g., a widow's pension. In the following, we will only analyse old-age pensions. EF is equal to one if the age at retirement equals the statutory retirement age and lower for early retirement.
PP are mainly earned from social security contributions levied on own wage income, calculated as the ratio of individual annual earnings and this year's average of annual earnings in the whole economy, i.e., the person's relative earnings position. If a person earns the average income in a given year, he/she receives one PP. Thus, the accumulation of PP depends on an individual's earnings profile relative to the evolution of average earnings as well as the pattern of employment and unemployment over the life cycle.
PP may also be acquired during spells of unemployment and non-employment due to child rearing or nursing care at home. For example, a mother receives three PP for the first three years of a child born after 1992. The treatment of periods of unemployment has changed over time. Currently, short-term unemployed persons receiving unemployment benefit (ALG I, which is insurance based and related to previous earnings) acquire PP as if earning 80% of the former gross earnings. Since a reform in 2005, long-term unemployed who receive the new means-tested benefits (ALG II) acquire very little pension entitlements – receiving one year ALG II increases pension entitlements by slightly more than two euro (€) per month.Footnote 3
The CPV in the above formula is given by:
 $$CPV_{t} \equals CPV_{t \minus \setnum{1}} \times {{W_{t \minus \setnum{1}} } \over {W_{t \minus \setnum{2}} }} \times {{100 \minus RP_{t \minus \setnum{1}} \minus CR_{t \minus \setnum{1}} } \over {100 \minus RP_{t \minus \setnum{2}} \minus CR_{t \minus \setnum{2}} }} \times \mathop {\overbrace{\left[ {\left( {1 \minus {{PR_{t \minus \setnum{1}} } \over {PR_{t \minus \setnum{2}} }}} \right) \times \alpha \plus 1} \right]}}\limits^{{\rm Sustainability\ factor}} \comma $$
where W is the sum of gross earnings in the economy, RP is the contribution rate to subsidized private and/or occupational pension schemes, CR is the contribution rate to the public pension insurance, PR is the ratio of retirees to contributors to the public pension fund, and α is a weighting factor currently set to 0.25. In our base year 2005, the CPV amounted to 26.13€ in West Germany and to 22.57€ in East Germany.Footnote 4
The determination of the CPV has recently been subject to a couple of reforms. The introduction of the subsidy of contributions to private pension plans is reflected by the factor RP. Although supplementary private pension plans are not mandatory, this factor lowers the benefit indexation. The contribution rate is set to increase to 4% of gross earnings until 2011 and to remain constant thereafter. The 2004 reform introduced the sustainability factor, which links pension growth to demographic ageing. Demographic ageing will most likely reach its peak in the 2030s. The result will be a growth rate of pensions that is lagging behind the growth rate of wages. Owing to the complex rule for the adjustment of the CPV, its future trajectory has to be simulated making assumptions on the changes of all factors that enter the adjustment rule (see Section 3.3).
3 Data and microsimulation methodology
3.1 Data
According to the pension formula (1), the simulation of future pension benefits requires detailed information on current individual entitlement as well as estimates of future pension accruals until retirement. The simulation of future pension entitlements has to account for cohort effects in labour market histories, future earnings, and the individual retirement age. Furthermore, we are also interested in the level of public pensions of households. Since there is no data set publicly available in Germany which would include all required information, we have to combine various data sources to perform our simulation of individual pension benefits. We combine data from the Socio-Economic Panel Study (SOEP) and administrative data of individual insurance records provided by the Research Data Center of the German Pension Fund (FDZ-RV). SOEP data are used to estimate cohort effects in individual labour market histories. The administrative data are used to determine pension entitlement in our base year (2005) for those individuals who can be matched to ‘statistical twins’ observed in the SOEP data and to simulate the effective retirement age across birth cohorts.
The SOEP is a representative longitudinal microdatabase that provides a wide range of socioeconomic information on private households in Germany. The first wave refers to a stratified random sample of about 12,200 adult respondents in 6,000 families living in West Germany in 1984. After 1989, the SOEP was extended by about 4,500 persons (in 2,200 households) from the former GDR.Footnote 5 The data we use range from 1984 to 2006 for West Germany and from 1990 to 2006 for East Germany.
SOEP contains a detailed retrospective questionnaire from which we reconstruct individual employment histories to estimate cohort effects. SOEP data, however, do not provide information on wages at the time before a respondent joined the survey. Thus, individual pension entitlements of non-retirees for the base year 2005 simulated from retrospective work history data recorded in the SOEP are likely to contain substantial measurement error. Furthermore, for East Germany it does not seem feasible to estimate and predict past earnings in the former GDR based on market earnings after reunification. The calculation of individual pensions in East Germany is also rendered extremely difficult due to complex regulations concerning the integration of pension entitlements from the former GDR into the unified pension system in Germany (Himmelreicher and Fachinger, Reference Himmelreicher and Fachinger2007).
We therefore match administrative information on individual pension claims in 2005 to the SOEP data. For this purpose, we use the scientific use file of the insurance account sample of 2005 (‘Versicherungskontenstichprobe’, VSKT) which is a random sample of about 60,000 individual insurance records of people aged between 30 and 67 years in 2005.Footnote 6 People in education or already retired as well as civil servants and the self-employed are not included in the analysis. This restriction excludes very low pensions resulting from short employment spells under the social security system, e.g., of persons who acquired pension entitlements at the beginning of their career but subsequently became civil servants.
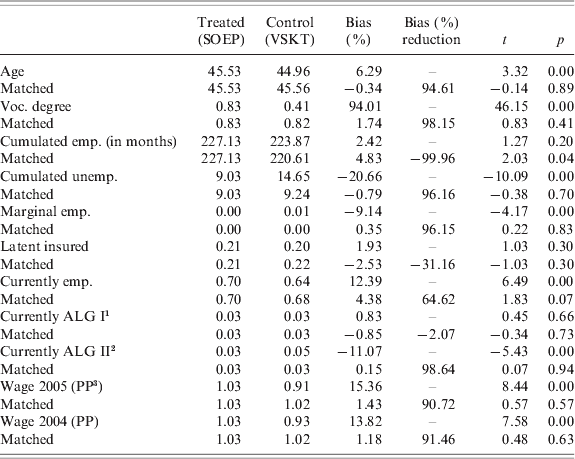
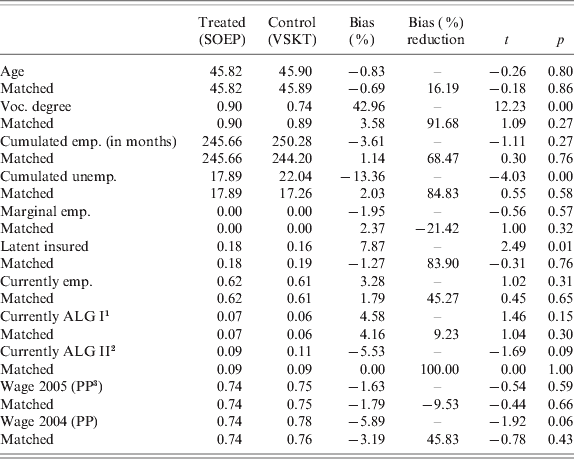
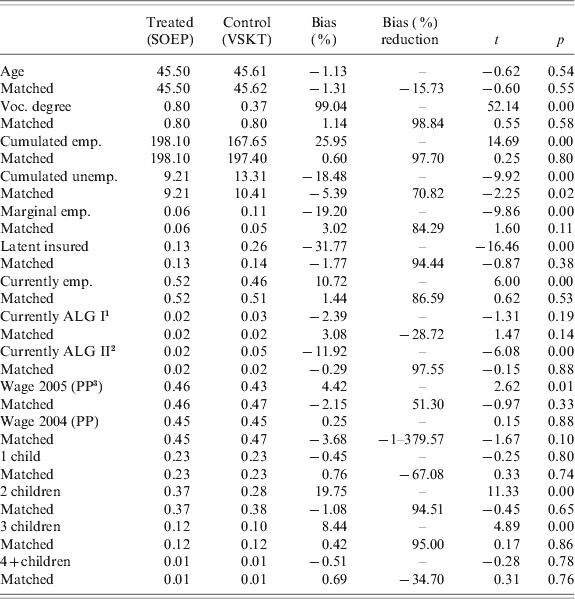
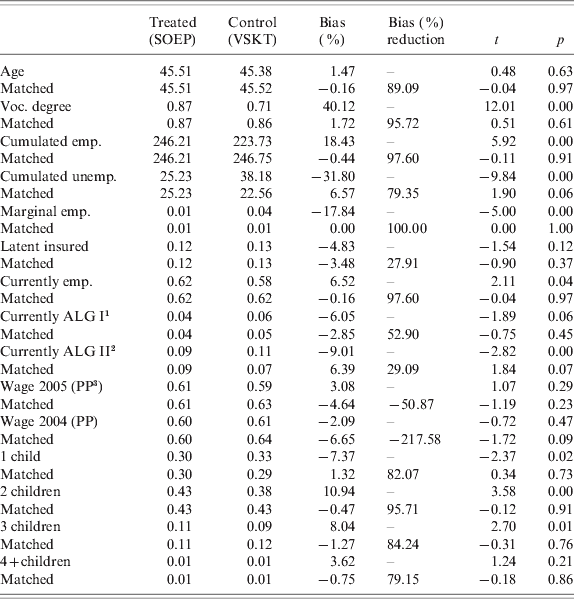
We applied a propensity-score matching procedure (‘nearest-neighbour’ matching) to combine the data sets of SOEP and VSKT for 2005. The data were matched within small cells defined by age-groups, gender, and region. We used data on individual labour market history, wages and the current employment situation as matching variables. For women, we also used information on children. Tables A.1–A.4 in the Appendix report the test statistics on the matched dataset.Footnote 7 For each observation in the SOEP matched to a statistical twin in the VSKT data we replace the simulated amount of pension entitlements by that recorded in the latter dataset. For SOEP observations for which no statistical twin could be found the simulated amount is maintained.
For the simulation of the actual retirement age, we use a 10% random sample (about 90,000 observations) of all new retirees in 2006.Footnote 8 After restricting the sample to old-age pensioners who retired between the age of 60 and 65 years, we are left with about 68,000 observations.
3.2 Estimation of cohort effects and earnings equations
For the simulation analysis we estimate three different types of models. First, we link individual labour market histories to life cycle earnings profiles, which determine the level of an individual's future pension. In order to ensure consistent parameter estimates, we apply a two-stage estimation procedure. In the first stage, we estimate reduced form equations for the cumulated durations spent in employment, unemployment, or out of the labour market accounting for cohort effects. In the second stage, we estimate the parameters in a relative earning equation relating individual earnings to labour market histories and a number of other potential earnings determinants. We use the first stage results to instrument an individual's observed labour market history. Variables related to children and marital status serve as exclusion restrictions. Hausman tests show that the employment and unemployment durations are endogenous. We use IV estimation results for the simulations below. We also tested for direct cohort effects in the earnings equation but, with the exception of West German men, we did not find significant effects. Since the inclusion of cohort effects had very little effect on simulation results for this group, we did not include cohort effects in the final model specification.
The third model that we estimate is used only for the projection of annual labour market experience. Instead of levels of labour market experience, it links differences to the cohort effects and other explanatory variables.
We assume that the cumulated duration in a particular labour market state, Yit*, can be modelled as a function of the birth cohort dummies Kik, a polynomial of the individual's age Ait, period (year) dummies Pt, and a vector of other control variables, Xit. Since the cumulated duration in most labour market states is zero for a non-negligible share of the population, we estimate Tobit models of the form:
 $$\eqalign{\tab Y_{it}{\vskip-1pt\hskip-3pt\ast\vskip1pt} \equals\beta _{\setnum{0}} \plus \kappa ^{\prime} K_{i} \plus \theta {^\prime} A_{it} \plus \tau ^{\prime} P_{t}{\vskip-1pt\hskip-3pt\ast\vskip1pt} \plus \gamma ^{\prime} X_{it} \plus \epsilon _{it} \comma \cr \tab {Y_{it} \equals \max \lpar 0\comma Y_{it}{\vskip-1pt\hskip-3pt\ast\vskip1pt}\hskip1pt \rpar \comma}\cr\tab {\epsilon _{it} \vert \tab K_{i} \comma A_{it} \comma P_{t}{\vskip-1pt\hskip-3pt\ast\vskip1pt} \comma X_{it} \sim N\lpar 0\comma \sigma ^{\setnum{2}} \rpar \comma}\cr} $$
where the labour market states are full-time employment and unemployment for men, and additionally part-time employment and non-employment for women. The control variables include the age of the youngest child, dummies for the presence of other children, marital status, nationality, and education. The error term ∊ is assumed to be uncorrelated with these variables.
Because of the linear dependence of age, period, and cohort the identification of linear cohort effects is impossible without further assumptions. Here, we follow Deaton (Reference Deaton1997) and assume that period effects are orthogonal to a linear trend and sum to zero over all observation periods.Footnote 9 This assumption allows one to decompose the effects in three different dimensions: the trend (cohort), the profile (age), and the business cycle (period). The restriction on the period effects can be justified since cumulated durations are observed over a relatively long period, so that positive and negative year effects should cancel each other out.
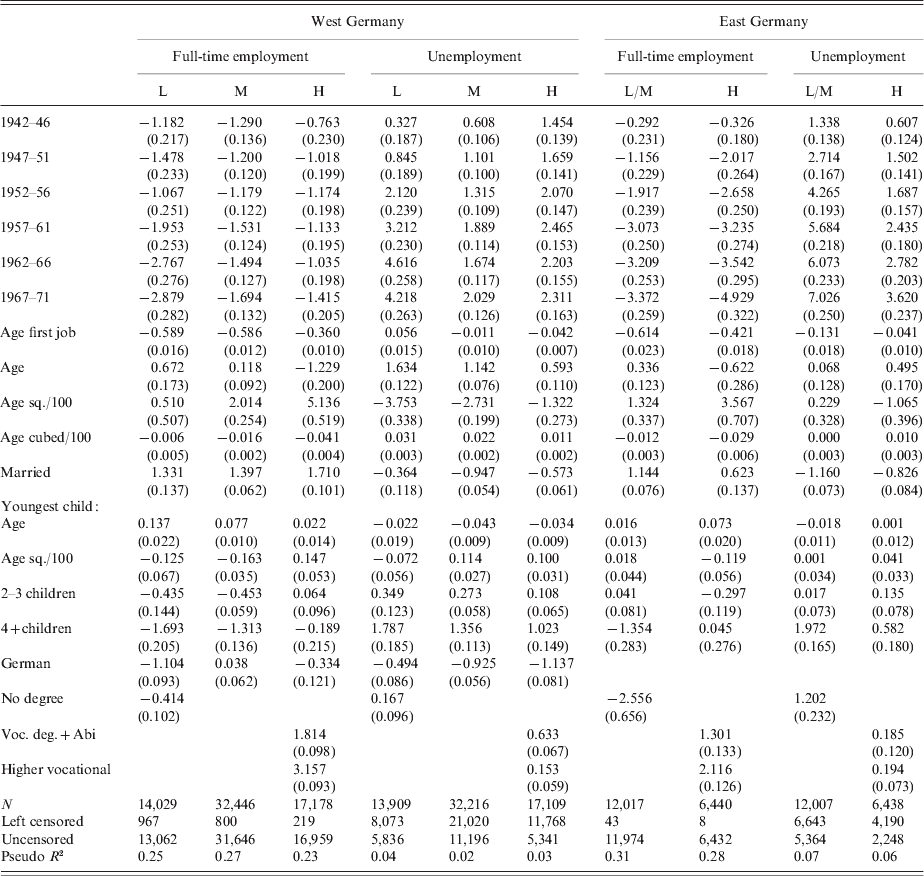
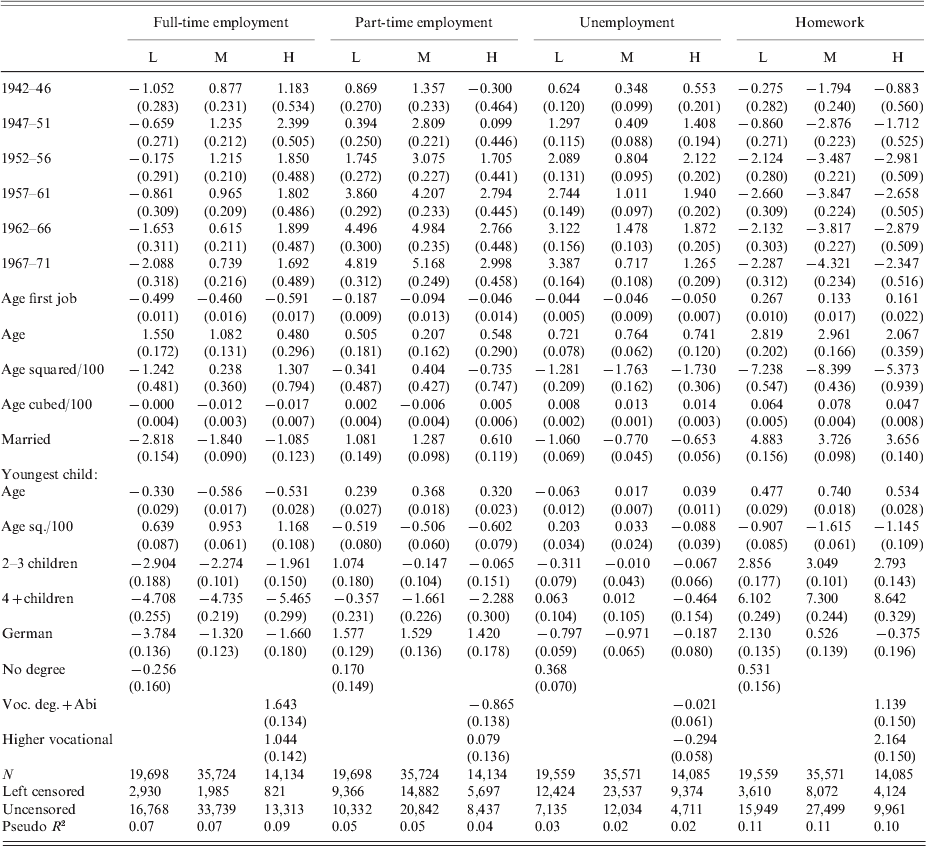
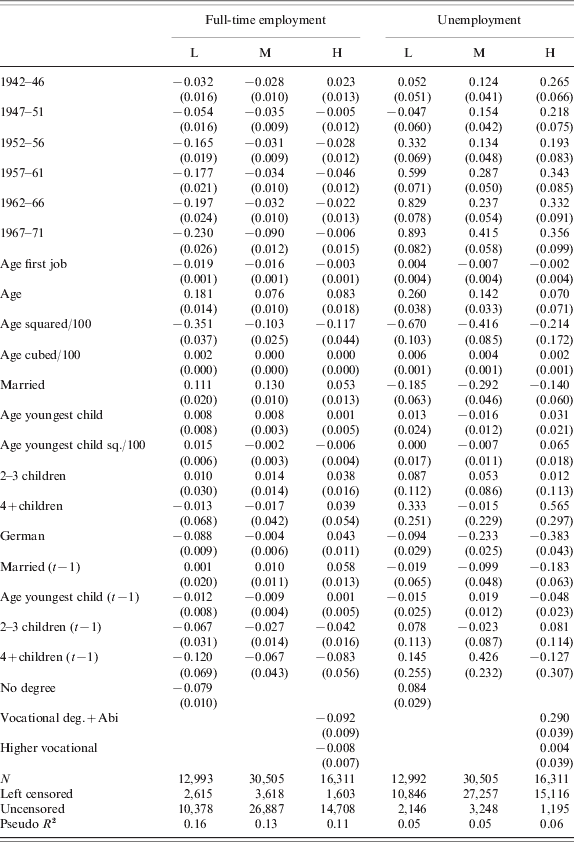
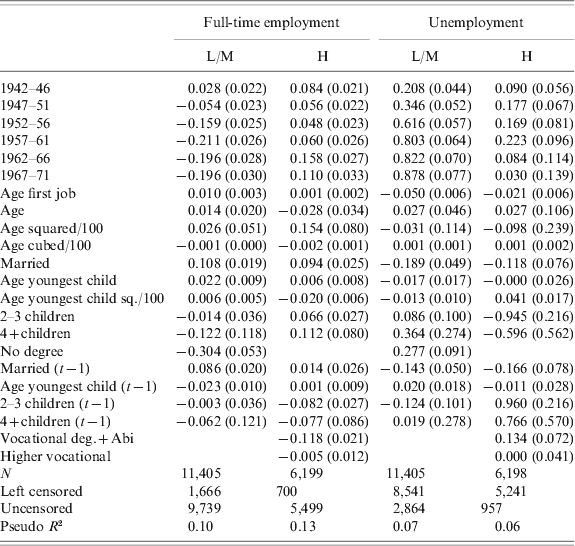
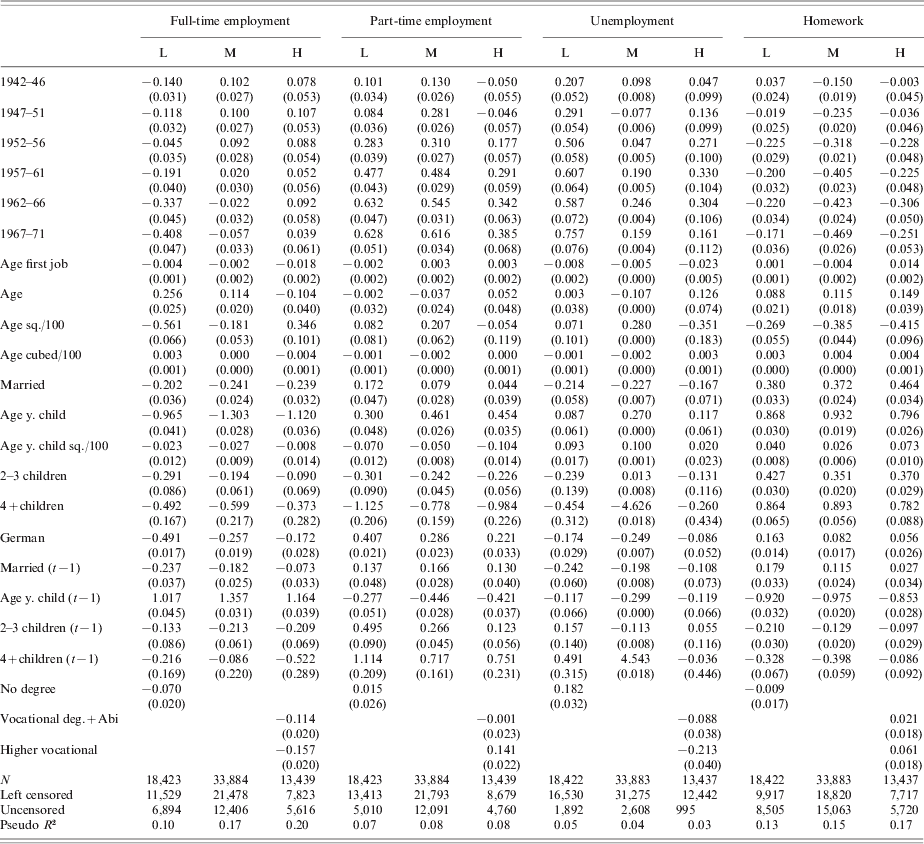
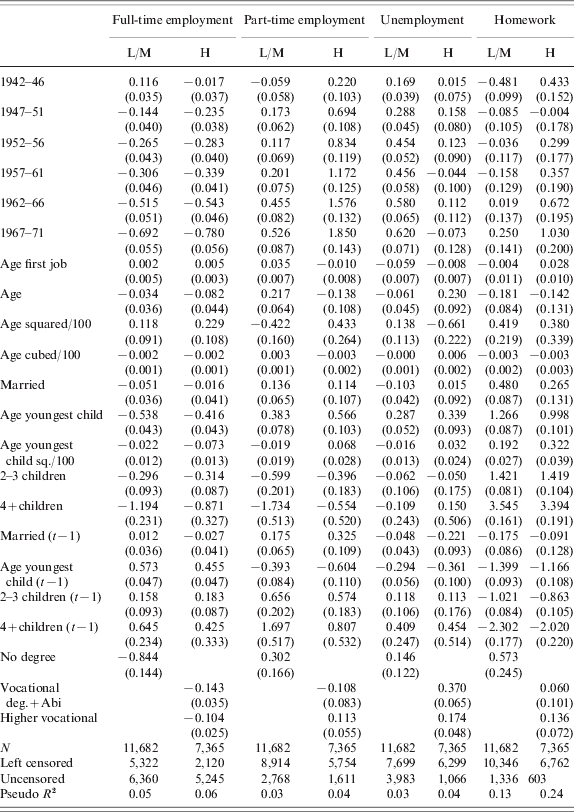
We estimate separate Tobit models for each of the subgroups defined by region (East and West Germany), gender, and by the level of education. Estimation is based on 21 waves of the SOEP for West Germany and 15 waves for East Germany spanning the period 1984–2005 and 1990–2005, respectively. The estimated coefficients are documented in Tables A.5–A.7 in the Appendix.
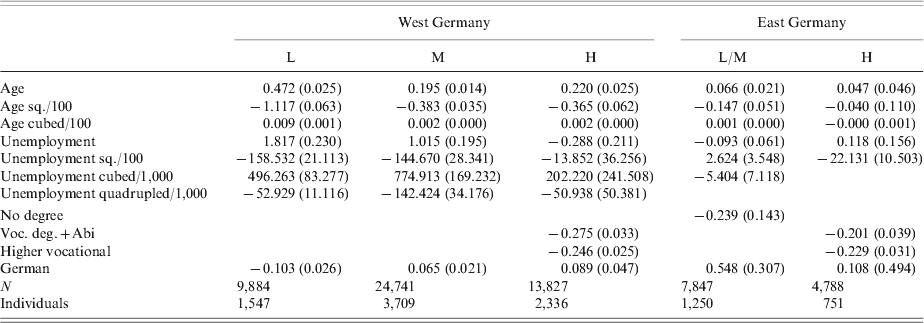
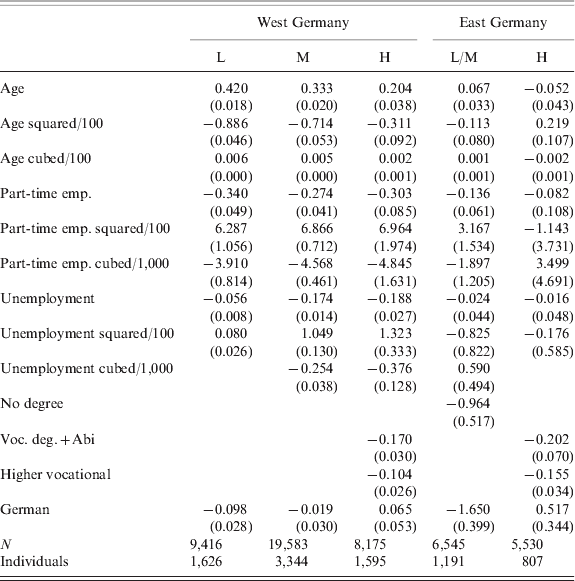
The dependent variable in the earnings equation is the logarithm of PP, the ratio of individual gross earnings to average earnings of the insured population in a given year. Explanatory variables are the age Ait, the cumulated duration of unemployment UEit and, for women, non-employment NEit and part-time employment PTEit. All of these enter as polynomials. We use the results from (3) to instrument the cumulated labour market variables. Since we include these as well as age, the duration of full-time employment cannot be identified separately. Cohort effects impact individual relative earnings through their effects on the duration variables. The control variables contained in Xit include time dummies, dummies for industry, firm size, and nationality.Footnote 10
The specification of the earnings equation for men (the equation for women includes NE and PTE as additional regressors) thus is:
 $$\openup3pt\eqalign{\tab \log {{w_{it} } \over {w_{t} }} \equals \beta _{\setnum{0}} \plus \alpha^\prime A_{it} \plus \zeta ^\prime UE_{it} \plus \lambda ^\prime X_{it} \plus u_{i} \plus v_{it} \comma \cr \tab E\hskip2pt\lsqb u_{i} \vert A_{it} \comma UE_{it} \comma X_{it} \rsqb \equals 0\comma \cr \tab E\hskip2pt\lsqb v_{i} \vert A_{it} \comma UE_{it} \comma X_{it} \comma \epsilon _{i} \rsqb \equals 0\comma \forall i\comma t\comma \cr} $$
where wit denotes earnings of individual i in period t and  $\bar{w}_{t} $ average earnings in that period. The error components ui and vit account for unobserved time-invariant individual effects and time-varying shocks to individual earnings, both assumed to be uncorrelated with any of the explanatory variables and independently normally distributed.
As in the estimation of cohort effects, we estimate the parameters in separate relative earnings equations for each of the subgroups. Estimation is based on a subsample of observations also used for the estimation of cohort effects, i.e., those with a wage income subject to social security contributions. The estimated coefficients are documented in Tables A.8 and A.9 in the Appendix.
The third model we estimate is used for the projection of labour market histories. The model is similar to (3) but includes annual differences as dependent variables and lagged explanatory variables.
 $$\eqalign{\tab D_{it}{\vskip-1pt\hskip-4pt\ast\vskip1pt} \equals Y_{it}{\vskip-1pt\hskip-3pt\ast\vskip1pt} \minus Y_{it \minus \setnum{1}}{\vskip-1pt\hskip-13pt\ast\vskip1pt\hskip8pt} \equals \tilde{\beta }_{\setnum{0}} \plus \tilde{\kappa }{^\prime} K_{i} \plus \tilde{\theta }{^\prime} A_{it} \plus \tilde{\tau }{^\prime} P_{t}{\vskip-1pt\hskip-3pt\ast\vskip1pt} \plus \tilde{\gamma }_{\setnum{1}} {\hskip-3pt^\prime\hskip1pt} X_{it} \plus \tilde{\gamma }_{\setnum{2}} {\hskip-3pt^\prime\hskip1pt} X_{it \minus \setnum{1}} \plus \tilde{\epsilon}_{it} \comma \cr\tab D_{it} \equals \max\lpar 0\comma Y_{it}{\vskip-1pt\hskip-3pt\ast\vskip1pt} \minus Y_{it \minus \setnum{1}}{\vskip-1pt\hskip-13pt\ast\vskip1pt\hskip9pt} \rpar \comma \cr\tab \tilde{\epsilon}_{it} \vert K_{i} \comma A_{it} \comma P_{t}{\vskip-1pt\hskip-3pt\ast\vskip1pt} \comma X_{it} \comma X_{it \minus \setnum{1}} \sim N\lpar 0\comma \tilde{\sigma }^{\setnum{2}} \rpar . \cr} $$
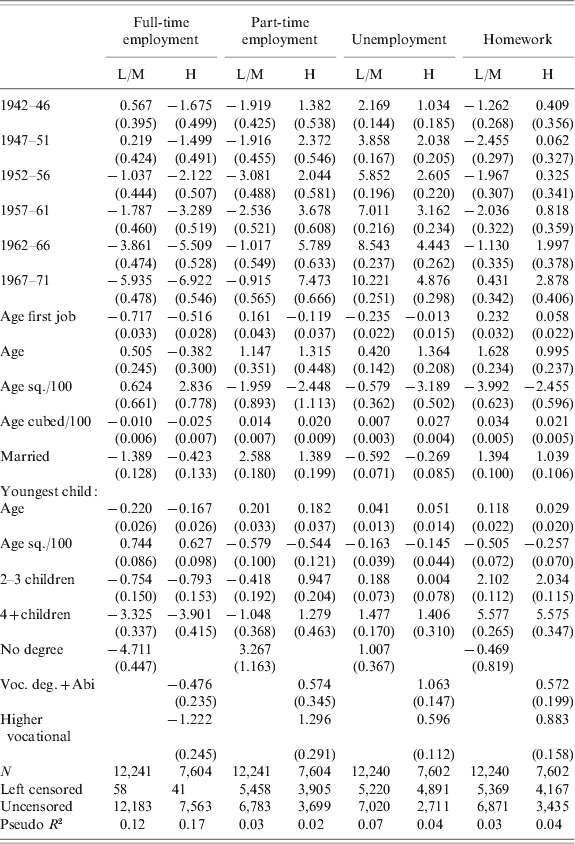
The estimated coefficients for all subgroups are documented in Tables A.10–A.13 in the Appendix.
3.3 Simulating future pension levels across birth cohorts
The estimates from the earnings and employment equations are used, together with individual pension entitlements in the base year 2005, to simulate the level of individual pensions at retirement age. Since our sample includes people born between 1937 and 1971, the simulation horizon varies greatly between birth cohorts. Whereas the majority of the oldest cohort (1937–41) is already retired in 2005, and already receiving pensions in the base year, the youngest birth cohort (1967–71) is aged 34–38 in 2005 and up to 33 years of their future life cycle have to be simulated. This simulation involves five steps.
First, based on the estimated Tobit models of (5), we project future individual cumulated employment and unemployment durations accounting for cohort effects. The time spent in a particular state at time t is simply the predicted value in that period.
Second, we simulate future relative earnings for each individual based on expected values derived from the estimated earnings equations with the employment/unemployment durations instrumented as described above. These simulations are based on the expected values of cumulated durations spent in a particular state as derived in the previous step. In addition to the mean, we also simulate the variance of projected earnings on the basis of the distribution of earnings observed in our estimation sample.Footnote 11
Third, putting together simulated future employment/unemployment durations and earnings at age a, we calculate for each individual the sum of PP until her/his retirement age. Adding these – adjusted by the amount of PP acquired for non-employment spells and the retirement age – to the amount of already acquired PP in the base year 2005 yields the expected total amount of PP an individual is expected to earn until retirement. Since early retirement is still the rule rather than the exception in Germany, we have to model the future evolution of the effective retirement age.
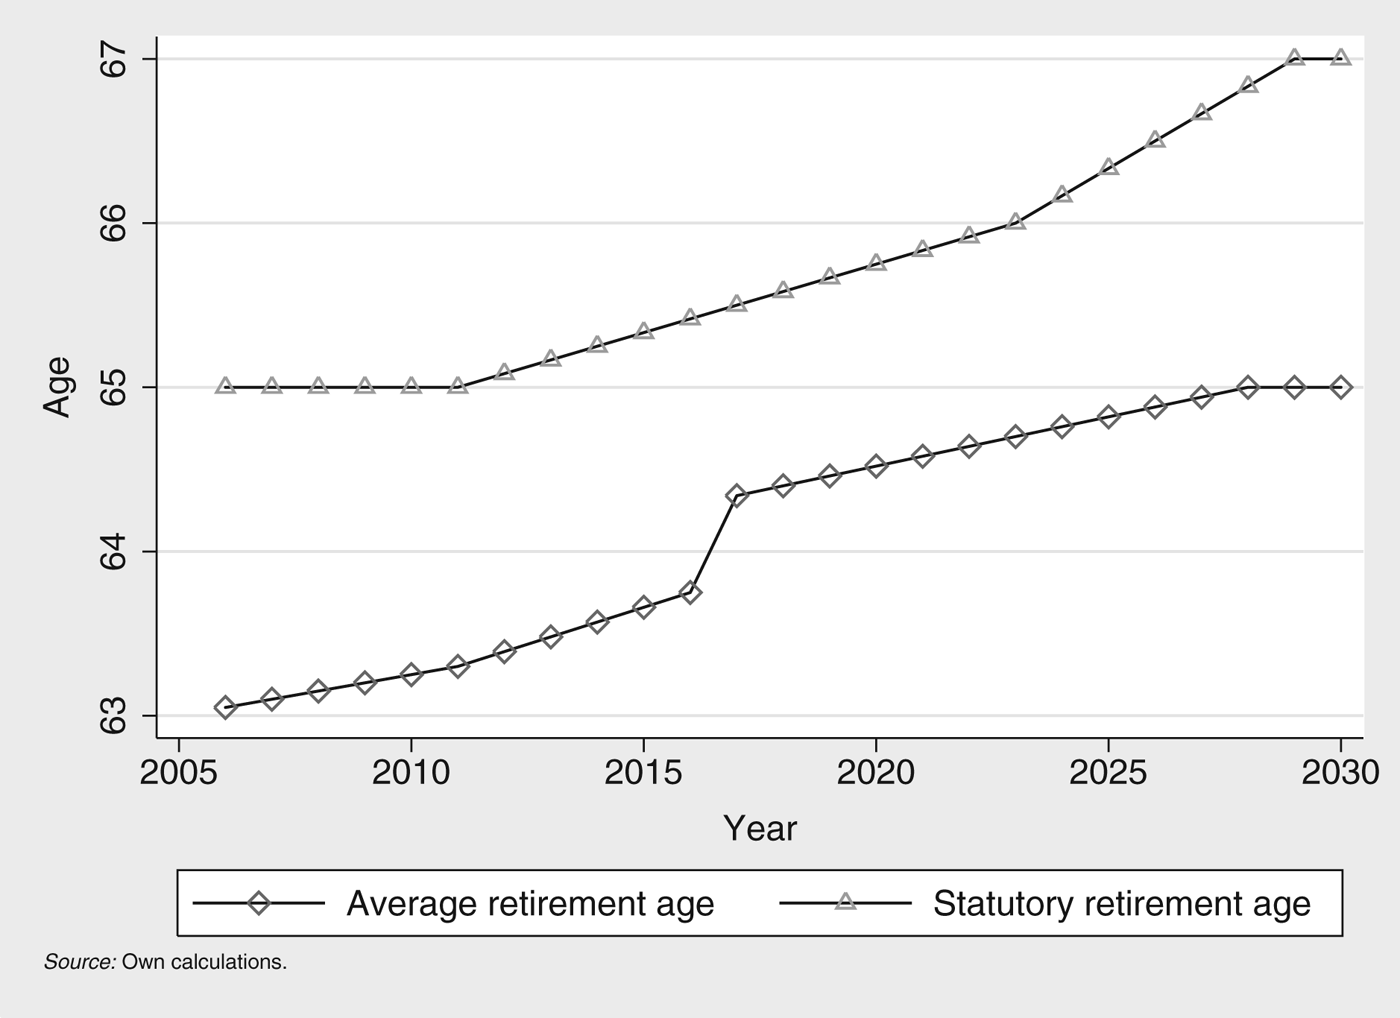
We do this in a simplified way by extrapolating the distribution of the effective retirement age of people retiring in 2006 by a common factor that reflects the recently enacted long-term increase of the statutory retirement age from 65 to 67 years. Since we focus on old-age pensions here, we apply the same factor to men and women and also to East and West Germany. The average effective retirement age in 2006 was about 63 years. We assume a long-term increase to 65 years in the simulation. As shown by Figure 1, the expected increase in the effective retirement age is not linear. This is due to the abolishment of early retirement options for the unemployed and women until 2011, which implies a relatively strong increase in the expected retirement age of birth cohorts.
Average effective and statutory retirement age.

Fourth, based on the simulated individual pension points and projections of the CPV we derive individual pension benefits. The CPV is determined by the growth rate of the average gross earnings in the economy and the pension formula according to Equation (2). Following the Ageing Working Group (AWG), the average real gross wage income in the economy is projected to grow at an annual rate of 1.6% (European Commission, 2005).
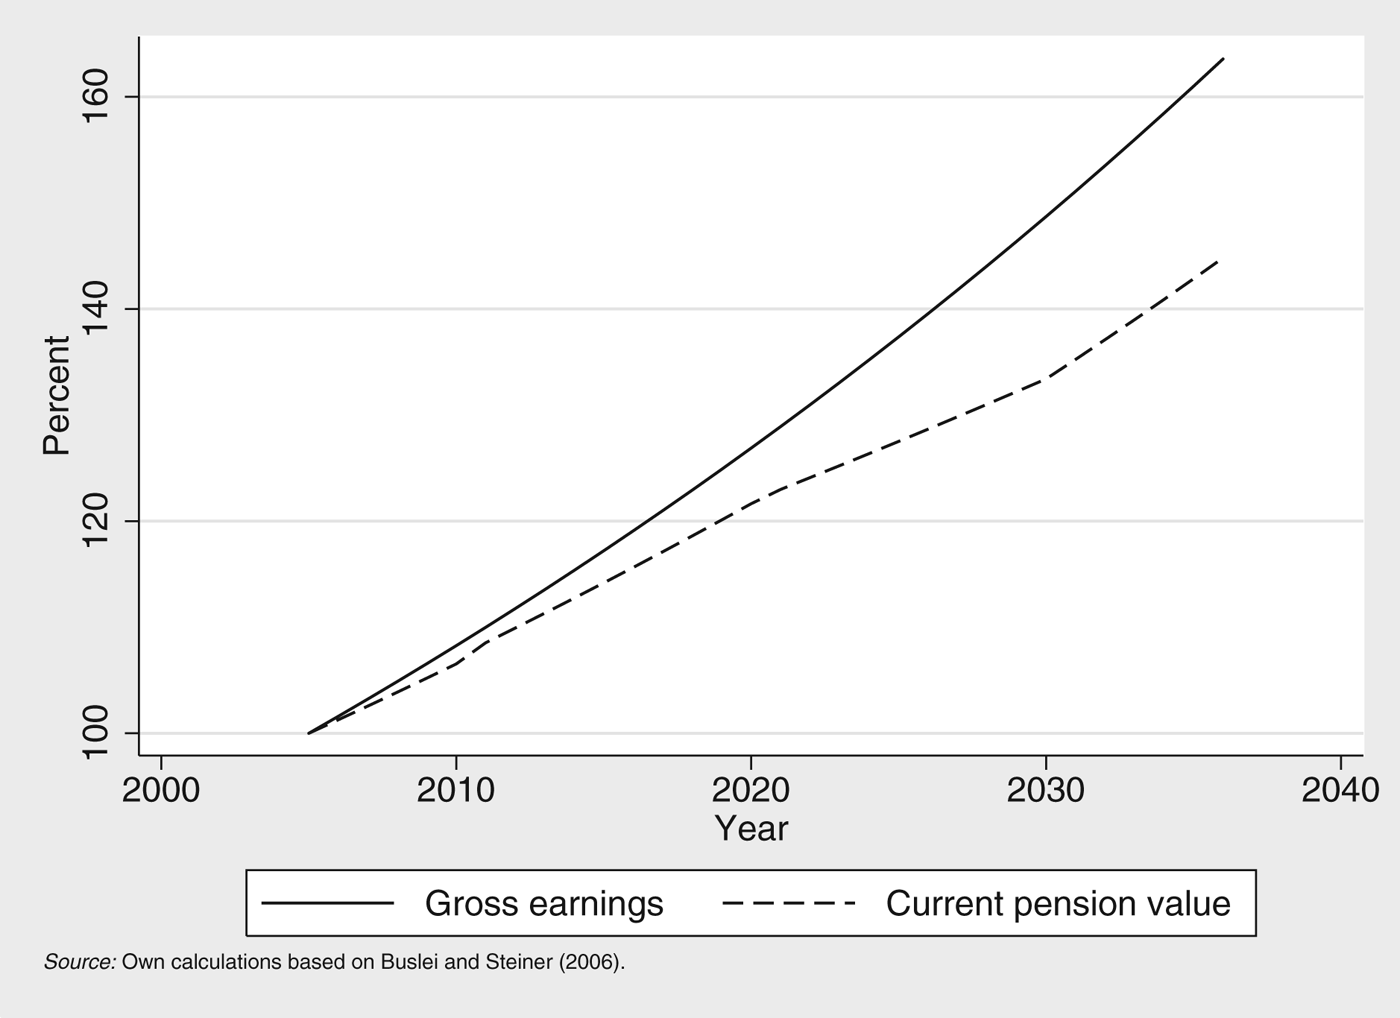
Figure 2 shows the development of gross earnings and the CPV in the simulation period. Owing to the adjustment factors in the pension formula, there is an increasing divergence between the average gross earnings and the CPV. Since population aging will peak during the 2030s, and since this is accounted for in the sustainability factor included in the CPV formula, the difference between gross earnings and the CPV will reach a maximum towards the end of the simulation period. By then, the CPV will fall short of average gross earnings by almost 20 percentage points.
Development of the average gross earnings and the current pension value in the simulation period.
The final step in the calculation of future public pensions is to project the population structure over the whole simulation period. Starting with a representative sample of the German population born between 1937 and 1971, we apply a ‘static ageing’ procedure which adjusts the SOEP weighting factors to the marginal distributions of a few demographic variables derived from a household projection of Buslei et al. (Reference Buslei, Schulz and Steiner2006, pp. 29–33). These variables include the age, gender and education of the household head, region of residence, and type of household (couples/singles, with/without children).
4 Estimation and simulation results
4.1 Simulated labour market histories and relative earnings
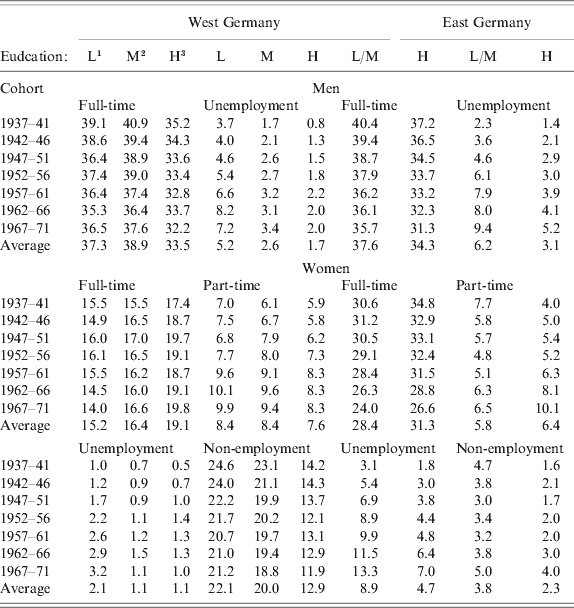
We find for nearly all groups significant cohort effects in labour market histories. This is true for both the models in levels and first differences. We find a general trend of increasing unemployment and decreasing employment for men and East German women. The estimated models are used to predict durations in the various labour market states until retirement (Table 1). Simulation results for West German men show that the cumulated duration of employment in the younger birth cohorts declines by about 3 years relative to the oldest cohort, and that this decline is similar for all education groups. For West German women, changes in the cumulated duration of full-time employment across birth cohorts differ by the level of education. In East Germany, younger male birth cohorts experience a dramatic decline in employment and an increase in unemployment durations. The predictions for the employment situation of younger birth cohorts of East German women are even worse than for men.
Simulated years of cumulated employment/unemployment durations until retirement by region, gender, and education
Notes: Cumulated durations at the time of retirement under the assumption that the legal retirement age is 65 years. Simulation results derived using SOEP weighting factors and static aging to forecast future population structure.
1 L, Low education.
2 M, Medium education.
3 H, High education.
The empirical age-earnings profiles derived from our estimated relative earnings equations differ substantially by education. The higher its level, the higher the relative earnings position, and the higher the acquired number of PP. Although this relationship holds for men and women in East and West Germany throughout the life cycle after the first few years of employment, the slope of the age-earnings profile differs markedly between these groups. Age-earnings profiles are relatively flat for persons with low or medium education and fairly steep for higher educated people. These profiles differ substantially by gender and region, especially for people with higher education. In West Germany, relative earnings of men in this group continuously increase with age until the age of 60 and will have almost doubled by then. In contrast, higher educated women experience a steep earnings increase until their early thirties, followed by a reduction and a subsequent rebound in their relative earnings. This pattern can be explained by the relatively weak labour force participation and a high share of part-time employment of West German women in their thirties and early forties due to child-care responsibilities. Since this used to be, and still is, much less true for women in East Germany, their age-earnings profiles are, on average, similar to those of East German men. For West German men and women with low education, relative earnings remain flat or even decrease with age, and only slightly increase for men with a medium level of education. In East Germany, relative earnings of both men and women with low or medium education also change relatively little over the life cycle.Footnote 12
On the one hand, these differences in empirical age-earnings profiles imply that people with a low level of education accumulate little earnings potential over their life cycle, in contrast to higher educated people. On the other hand, flat age-earnings profiles also imply that employment interruptions have long-term effects on future earnings and thus the level of the public pension.
4.2 Level and distribution of pension benefits in the base scenario
Our simulation results on the level and distribution of pension benefits across birth cohorts presented in this section refer to a simulation, which includes estimated cohort effects, the sustainability factor and the increase of the statutory retirement age. The analysis is restricted to pensions derived from the public pension scheme which are by far the most important source of income in old age for the great majority of the population. As we do not model income taxation in this paper, all pension benefits are gross amounts. However, we do subtract pensioners’ own contribution to health and long-term care insurance. That is, we report the effective amount of pension payment before taxes (‘Rentenzahlbetrag’). In general, we report gross pension benefits at the individual retirement age. In the case of two-person households, the simulations refer to the date when both spouses are retired. All pension benefits are discounted by the growth rate of real wages to make them comparable across birth cohorts. Owing to the lower growth rate of pension benefits relative to earnings, the current pension value for younger birth cohorts will decline, although pension benefits will continue to grow in real terms. In addition to pension levels, we report a replacement rate. The replacement rate is defined as the ratio of the amount of the pension benefit to the average gross earnings in East and West Germany, respectively. Average monthly gross earnings in 2005 were 2,433€ in West Germany and 2,057€ in East Germany.
Average pension levels and replacement rates
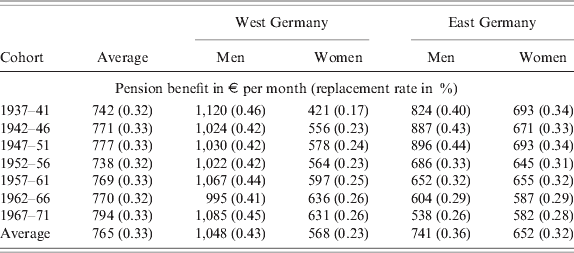
Table 2 shows remarkable differences in the amount and the replacement rate of individual gross pension benefits stratified by cohort, gender, and region.
Pension benefits and replacement rates across birth cohorts
Notes: The sample is restricted to persons who were not civil servants or self-employed in the base year 2005. The replacement rate is the ratio of the monthly pension benefit to the average monthly gross wage in East and West Germany, respectively.
Compared with all other groups, West German males across all birth cohorts can expect to receive the highest pension benefits. The slightly negative trend in this group's pension benefit is mainly driven by the lower CPV growth rate due to the sustainability factor. The youngest cohorts receive a pension that is still about 97% of the pension of the oldest cohort.
West German women's pensions are, on average across all birth cohorts, almost less than half as high as those of West German men. On average, their pension benefits are less than those received by women in East Germany. In contrast to all other groups, however, the pension benefit received by younger cohorts of West German women is substantially higher than that obtained by the older cohorts. This is the more remarkable as the older cohorts are not affected by the demographic CPV adjustment, and shows the importance of the increasing labour market attachment of younger women in West Germany. Still, the youngest cohort of West German women reaches a replacement rate of only 26%.
Looking at simulation results for East Germany, the evolution of pension benefits across birth cohorts is very different. Whereas the average pension benefit of East German women is 652€ per month, it is only 582€ for the youngest birth cohort.
For East German males the development is even more pronounced. Whereas East German men in the oldest birth cohort reach a pension benefit of 824€, birth cohorts 1952–56 and younger can expect a substantially smaller amount. The pension benefit of the youngest birth cohort of 538€ is only two-thirds of the amount received by the oldest cohort of East German men.
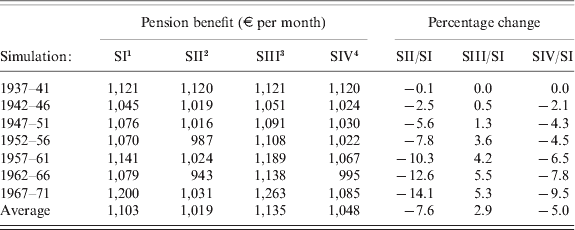
The evolution of pension levels and replacement rates is not only driven by labour market developments, but also by the pension reforms mentioned in Section 2. To show the relative impact of the sustainability factor and the increase of the retirement age to 67, Table 3 presents simulated pension benefits for four alternative reform scenarios for West German men: in the first two simulations, the statutory retirement age is kept at 65 while the sustainability factor is introduced in Simulation I (SI) but not in Simulation II (SII). This latter difference also distinguishes Simulations III (SIII) and IV (SIV) which also includes the increase in the statutory retirement age. We present these simulations only for West German men because the relative effects of the two reforms do not differ much between groups.
Impact of pension reforms on the average pension benefit by birth cohort – West German men
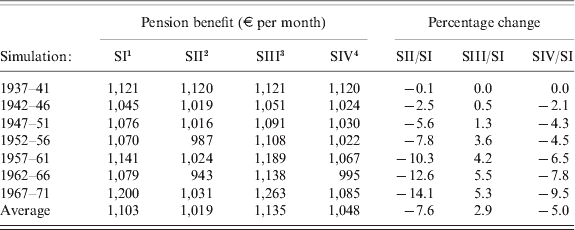
1 Simulation I: Retirement age=65, without adjustment of current pension value (CPV).
2 Simulation II: Retirement age=65, with adjustment of CPV.
3 Simulation III: Retirement age=67, without adjustment of CPV.
4 Simulation IV: Retirement age=67, with adjustment of CPV (base scenario).
The relative stability of employment histories across cohorts is reflected by the stability of pension benefits across cohorts under SI. In the absence of reforms, pension benefits remain well above 1,000€ per month for all cohorts. This changes when the slower growth rate of the CPV due to the sustainability factor is allowed for. In SII, the pension level of younger cohorts declines relative to the oldest cohort. As expected and as shown by the relative change in the pension benefit under SI and SII, the negative impact of the introduction of the adjustment factor is the stronger, the younger the age cohort. The youngest two age cohorts have to bear a reduction in the pension benefit of 13–14% due to this adjustment factor, compared with an average reduction across all cohorts of <8%.
Owing to the slow phase-in of the increase of the statutory retirement age, the largest effects of this policy change occur for the two youngest birth cohorts. As shown by the relative change in the pension value under SIII and SI in Table 3, the extension of the working life reduces the effect of lower pension growth for the two youngest birth cohorts by almost 5%.
Comparing the evolution of pension benefits across birth cohorts under SIII and SIV shows that the assumed adjustment of the effective retirement age to the increased statutory retirement age partly compensates for the slower CPV growth rate. As shown by SIV, the net effect of these two policy changes is a fairly stable level of pension benefits of West German men across birth cohorts. However, comparing this simulation to the one without adjustment of the pension formula and increase of the retirement age (SI) reveals that the pension benefit is reduced by almost 10% for the youngest birth cohort, compared with an average reduction of only about 5% across all cohorts.
4.2.2 The distribution of individual pension benefits
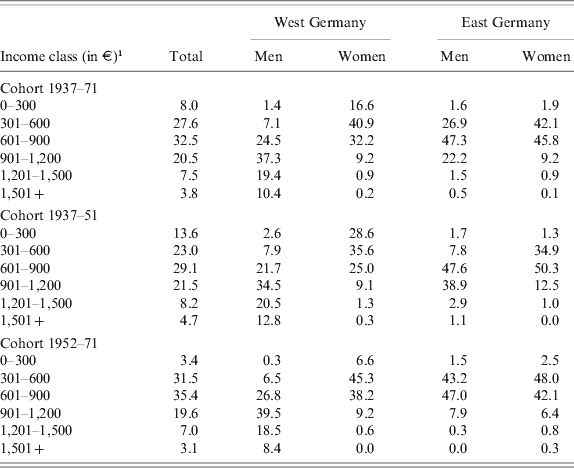
Table 4 illustrates how individual pension benefits are distributed across birth cohorts. To have a sufficient number of people in each income class, which we group by intervals of 300€, we pooled birth cohorts. The upper part of the table contains the distribution of pension benefits across all birth cohorts, the middle part for cohorts born 1937–1951, and the lower part for cohorts born 1952–1971.
Distribution of pension benefits across birth cohorts by region and gender, shares in %
1 Income class refers to the individual pension benefit.
On average across all cohorts, about 37% of all pension benefits of West German men fall in the income category of 901–1,200€, while 47% of all men in East Germany obtain pensions between 601 and 900€. The share of pensions exceeding 1,200€ per month is negligible for women.
From a policy perspective, the share of pension benefits below 600€ is important because this amount is close to the average means-tested subsistence level for single pensioners (‘Grundsicherung im Alter’).Footnote 13 A single pensioner with an income below that threshold would be entitled to receive social assistance up to that limit by the state. Since we focus on individual pensions and do not take into account other household income, we can, of course, make no strong statements concerning poverty issues. Still, the extent to which old-age pensions lift the retired out of poverty is of substantial interest for social policy.
Whereas the share of West German men receiving pensions below 600 € is less than 10% even among younger age cohorts, 28% of East German men in the younger birth cohorts will receive a pension below this level. While this share will change little in West Germany, it will increase dramatically from about 9 to more than 40% in East Germany. The already high share of low pensions among East German women will increase from about 35% in the older to about 50% in the younger cohorts. The share of low pensions is even higher among West German women, although it is expected to fall slightly from more than 60% for the older to 52% for the younger cohorts.
4.2.3 Pensions at the household level
From a policy perspective, the low level of pension benefits of women has to be assessed by taking into account other household incomes as well. Low old-age pensions of women need not imply a low living standard. Here, we focus on pension income from both spouses and analyse the distribution of pensions benefits at the household level. To this end, we simply calculate the average of the amounts of old-age pension benefits received in couple households to represent the individualized pension at the household level.
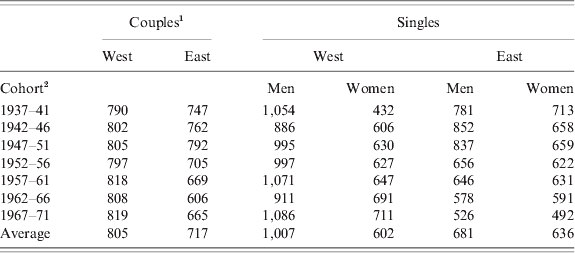
Table 5 shows that for West German couples the average pension benefit per person remains fairly stable at about 800€ across birth cohorts. This corresponds to the evolution of individual pension benefits in West Germany described above: the slight reduction in average pension benefits for men is compensated by an increasing pension for women. In contrast, for East German couples there is a decreasing trend in the level of average pensions across birth cohorts. Due to the relatively high pension benefits received by women, the level of the average pension benefit received by older birth cohorts of East German couples is similar to the level of West German couples in the same cohorts. The substantial decline of the average pension benefit of couples in East Germany from about 750€ to <670€ is the result of the drop of individual pensions among men and women in the younger birth cohorts. The evolution of pensions of singles, both in East and West Germany, is similar to what has been described above at the individual level.
Average pension benefits (per capita, € per month) at the household level across birth cohorts
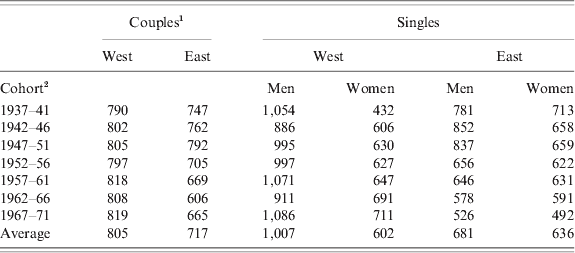
1 For couple households pension benefits are averaged.
2 The cohort is defined with respect to the age of the older spouse.
4.3 Alternative scenario: positive labour market East Germany
These simulations, which we henceforth refer to as our ‘base scenario’, assume that the cohort effects estimated over a period of high and increasing unemployment can be used to project labour market developments in the distant future. The effects of past unemployment on future pension benefits cannot be made to disappear but future employment may not decline and unemployment may not increase as strongly as observed in the past, in particular in East Germany. Therefore we also analyse a less pessimistic scenario for East Germany, which we refer to as ‘positive labour market East Germany’.
Instead of simulating future employment and unemployment durations using estimated cohort effects, we average these effects across all birth cohorts in this alternative scenario. Hence, the sharp increase in the future duration of unemployment among younger birth cohorts is diminished relative to the base scenario. Given the improvement in future labour market conditions in this alternative scenario, we also assume that the effective retirement age of East Germans increases by about 1 year to the West German level in the long-run.
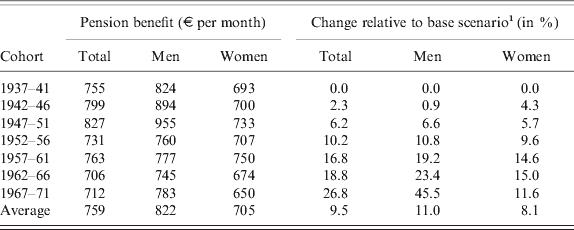
The left part of Table 6 shows the simulation results for the individual pension benefit and the replacement rate in this scenario, the right part shows the changes relative to our base scenario. Across all birth cohorts, the pension benefit increases by about 10%, on average, with a significantly stronger increase for men. Although the overall negative trend in the evolution of pension benefits across birth cohorts is not reversed, it becomes substantially weaker in this scenario. The reduction of the pension benefit in the youngest cohort is, on average, 26% less than in the base scenario.
Pension benefits across birth cohorts, scenario ‘positive labour market East Germany'
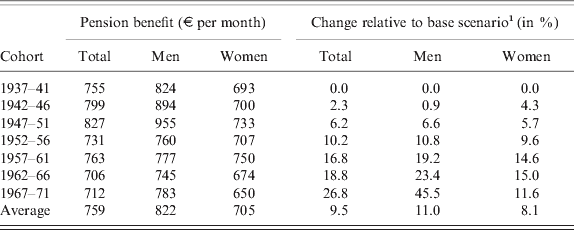
1 The average level of pension benefits in the base scenario is documented in Table 2.
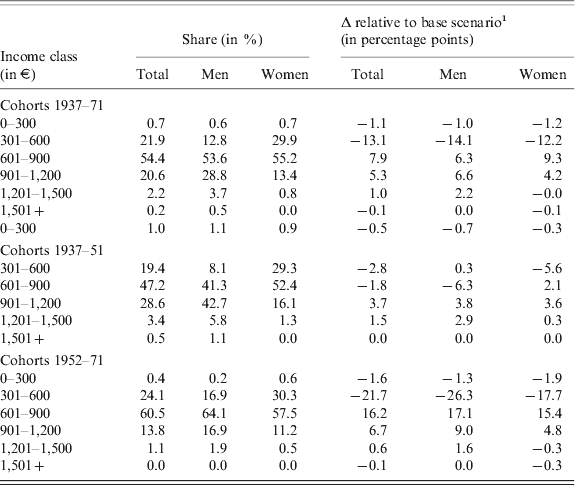
The comparison of the distribution of pension benefits across birth cohorts in our base and alternative scenarios in Table 7 reveals a relatively strong reduction in the share of very small pension benefits. The share of pensions below 600€ drops by 27 percentage points for men and 19 percentage points for women in the younger birth cohorts. This strong reduction would be accompanied by an increase in the share of monthly pensions of more than 900€ by 9 percentage points for men and 5 percentage points for women.
Distribution of pension benefits by income class across birth cohorts, scenario ‘positive labour market East Germany'
1 The distribution of pension benefits in the base scenario is documented in Table 4.
5 Conclusion
In countries with earnings-related public pension systems and high levels of long-term unemployment the adequacy of future pension benefits has become an important policy issue. This is of particular concern in countries like Germany where recent pension reforms were aimed at improving the long-term financial sustainability of the public pension system by substantially reducing income replacement rates. Our goal has been to quantify the likely impact of changing employment patterns and pension reforms on the future level of public pensions across birth cohorts in Germany. By looking at heterogenous labour market developments by region, gender, and education within one country we provide evidence on how these developments and public pension reforms may affect the adequacy of old-age income under earnings-related public pension systems.
To this end, we have developed a microsimulation model that accounts for cohort effects in individual employment and unemployment and earnings over the life cycle as well as the differential impact of recent pension reforms on birth cohorts. Our ‘base scenario’ takes into account the sustainability factor and the long-term increase in the statutory retirement age, which has recently been introduced to stabilize the contribution rate to the public pension system. For this scenario, we have shown that public pensions of East German men and women will fall dramatically among younger birth cohorts, not only because of policy reforms but also due to higher cumulated unemployment. For West German men, the small reduction of average pension levels among younger birth cohorts is mainly driven by the impact of pension reforms, while future pension levels of West German women are increasing or stable due to increasing labour market participation among younger birth cohorts.
Regarding the distribution of individual pension benefits, for the younger birth cohorts of East German men and women our simulation results imply high shares of pensions below the minimum pension recently introduced to avoid poverty among pensioners. Furthermore, the distribution of pension benefits in the total population disguises important differences in the level of education which is one of the major factors shaping life-time earnings. Even in the group of West German men, whose average pension level is still relatively high among younger age cohorts, a large share of those with a low level of education will obtain public pensions, which are very close to the minimum pension. Even the median pension of this group is only marginally above that level. While the very high share of individual pensions below the level of the social minimum among West German women will decline somewhat in the younger birth cohorts, it will increase dramatically for both men and women in East Germany. Also at the household level, the share of low pensions among married women will increase dramatically for younger birth cohorts in East Germany.
Since these simulation results are based on projecting labour market developments that have been observed in the past into the distant future for younger birth cohorts, which by necessity has to rely on highly uncertain assumptions especially for East Germany, we also simulated the evolution of future pensions across birth cohorts under a more optimistic labour market scenario. This scenario implies that future employment patterns of younger birth cohorts will resemble the average development over all cohorts since German reunification and that the effective retirement age of East Germans increases to the West German level. Even under this optimistic scenario, the overall negative trend in the evolution of pension benefits and the increasing share of low pensions across birth cohorts are not reversed, although they become substantially weaker.
In sum, we observe a growing population at risk of low public pensions in the future. Thus, the long-term policy goal of stabilizing the pension system's financial sustainability may come into conflict with securing the future adequacy of public pensions and the prevention of old-age poverty. In order to compensate for reduced public pensions, individuals may see the need to build up private and/or occupational pensions, both of which are associated with continuous labour market careers. Although generous subsidies for private savings were introduced in the wake of the recent pension reforms, private savings of low income households seem unlikely to prevent increasing old-age poverty. Not surprisingly, several potential reforms to increase the generosity of the pension system are currently debated, e.g., to increase pensions of low-wage earners. One such reform concerns the so-called ‘solidarity pension’ intended to top up very low pensions of individuals with a long insurance record of more than 30 years to prevent them to fall back on the means-tested social minimum. This and similar reform proposals face the severe problem, however, that, as shown by our simulation analysis, a fairly large share of future pensioners is likely to accumulate pension benefits only slightly above the means-tested social minimum. In earnings-related public pension systems such reforms would put the system's financial sustainability under pressure and would need to balance potential disincentive effects and distributional concerns. A possible solution would have to combine the extension of redistributional elements within the pension system for low-wage earners and unemployed and the improvement of the labour market situation of those groups with a higher risk of old age poverty. It is also questionable whether the current regulation to subsidize low income jobs by exemptions from the compulsory pension insurance should stay in place. A consistent strategy should also consider to stop these exemptions, e.g., for marginal employment, and to increase efforts to strengthen regular employment relationships.
Appendix
Matching – Before and after. Standardized bias. t-tests: men, West Germany
Matching – Before and after. Standardized bias. t-tests: men, East Germany
Matching – Before and after. Standardized bias. t-tests: women, West Germany
Matching – Before and after. Standardized bias. t-tests: − Women, East Germany
Tobit estimates for employment and unemployment experience by the level of education and region: men
Tobit estimates for employment and unemployment experience by level of education: West German women
Tobit estimates for employment and unemployment experience by level of education: East German women
Random effects wage regression by level of education and region: men
Random effects wage regression by level of education and region: women
Tobit estimates for annual changes in employment and unemployment experience by level of education: West German men
Tobit estimates for annual changes in employment and unemployment experience by level of education: East German men
Tobit estimates for annual changes in employment and unemployment experience by level of education: West German women
Tobit estimates for annual changes in employment and unemployment experience by level of education: East German women