


Introduction
Only a few studies have been conducted on the geochemistry of sea ice. These have mainly focused on brine chemistry and/or nutrients (e.g. Reference Clarke and AckleyClarke and Ackley, 1984; Reference MeeseMeese, 1989), while studies devoted to trace elements are rare (e.g. Reference Hoelemann, Schirmacher, Kassens and PrangeHoelemann and others, 1999; Reference GranskogGranskog, 2000). The importance of sea ice in redistribution of pollutants has been examined (e.g. Reference Pfirman, Eicken, Bauch and WeeksPfirman and others, 1995; Reference Lange, Pfirman and LeppärantaLange and Pfirman, 1998). Reference AckleyAckley (1996) discussed the possible role of sea ice as a source of trace elements in the seasonally ice-covered Sea of Okhotsk. Reference MelnikovMelnikov (1991) suggested that sea-ice and snow decay could cause an increase in the concentrations of lead and other toxic substances in under-ice water layers in Arctic waters. Reference Campbell and YeatsCampbell and Yeats (1982) concluded that sea ice with notably high particle content contributed Cd, Cu and Fe to surface waters during melting in Baffin Bay. Recent observations from the Arctic basin indicate that sediment-laden sea ice contributes Al and Fe to surface waters (Reference MeasuresMeasures, 1999).
Most sea-ice studies have focused on the Arctic and Antarctic regions; there are very few data for the seasonally ice-covered Baltic Sea. Reference Leppäranta, Tikkanen and ShemeikkaLeppäranta and others (1998) and Reference GranskogGranskog (2000) studied the composition of particulate matter in sea ice. Observations of the nutrient status of Baltic sea ice have been reported more frequently (e.g. Reference Norrman and AnderssonNorrman and Andersson, 1994; Reference Mock, Meiers and GiesenhagenMock and others, 1997). To date, however, the results in the Baltic have been obtained from only a limited number of samples and locations. Furthermore, trace-element studies in the Baltic Sea have been undertaken mainly during ice-free periods in pelagic waters (e.g. Reference Kremling and PetersenKremling and Petersen, 1984; Reference BrugmannBrugmann, 1986,Reference Brugmann1988). Hence we lack results from wintertime observations and observations from the coastal zone, where a considerable load of these elements are introduced to the Baltic Sea through river discharge. One can expect that the landfast sea-ice cover modifies the spreading of riverine waters, mainly due to reduced mixing during winter. Subsequently, nutrients and trace elements, and other substances in the river runoff, are transported further off the coast in winter than in summer (e.g. Reference Alasaarela and MyllymaaAlasaarela and Myllymaa, 1978).
The ice cover also accumulates atmospheric deposition. Nitrogen has been observed to be enriched in the topmost layers of the ice cover in the Baltic Sea due to atmospheric loading (Reference Rahm, Hakansson, Larsson, Fogelqvist, Bremle and ValderramaRahm and others, 1995). Considering the levels of Al, Cu, Fe and Pb in snow along the Finnish coast, reported by Reference Soveri and PeltonenSoveri and Peltonen (1996), one would also expect snow deposition to increase the levels of these elements in the ice cover. The potential importance of atmospheric deposition is revealed by the fact that precipitation accounts for about 35% of the gross fresh-water input to the Baltic Sea (HELCOM, 1991).
In this paper we present particulate-matter, trace-element and nutrient concentrations in sea ice and surface waters along the northern Baltic Sea coast. The objective of this work is to determine how salinity, particulate matter and ice structure is related to trace-element and nutrient concentrations in the ice. Furthermore, the observations give an indication of the concentrations of nutrients and trace elements in the ice-covered transition zone, and an implication of the role sea ice plays in wintertime dispersal of riverine waters.
Materials and Methods
Sample collection
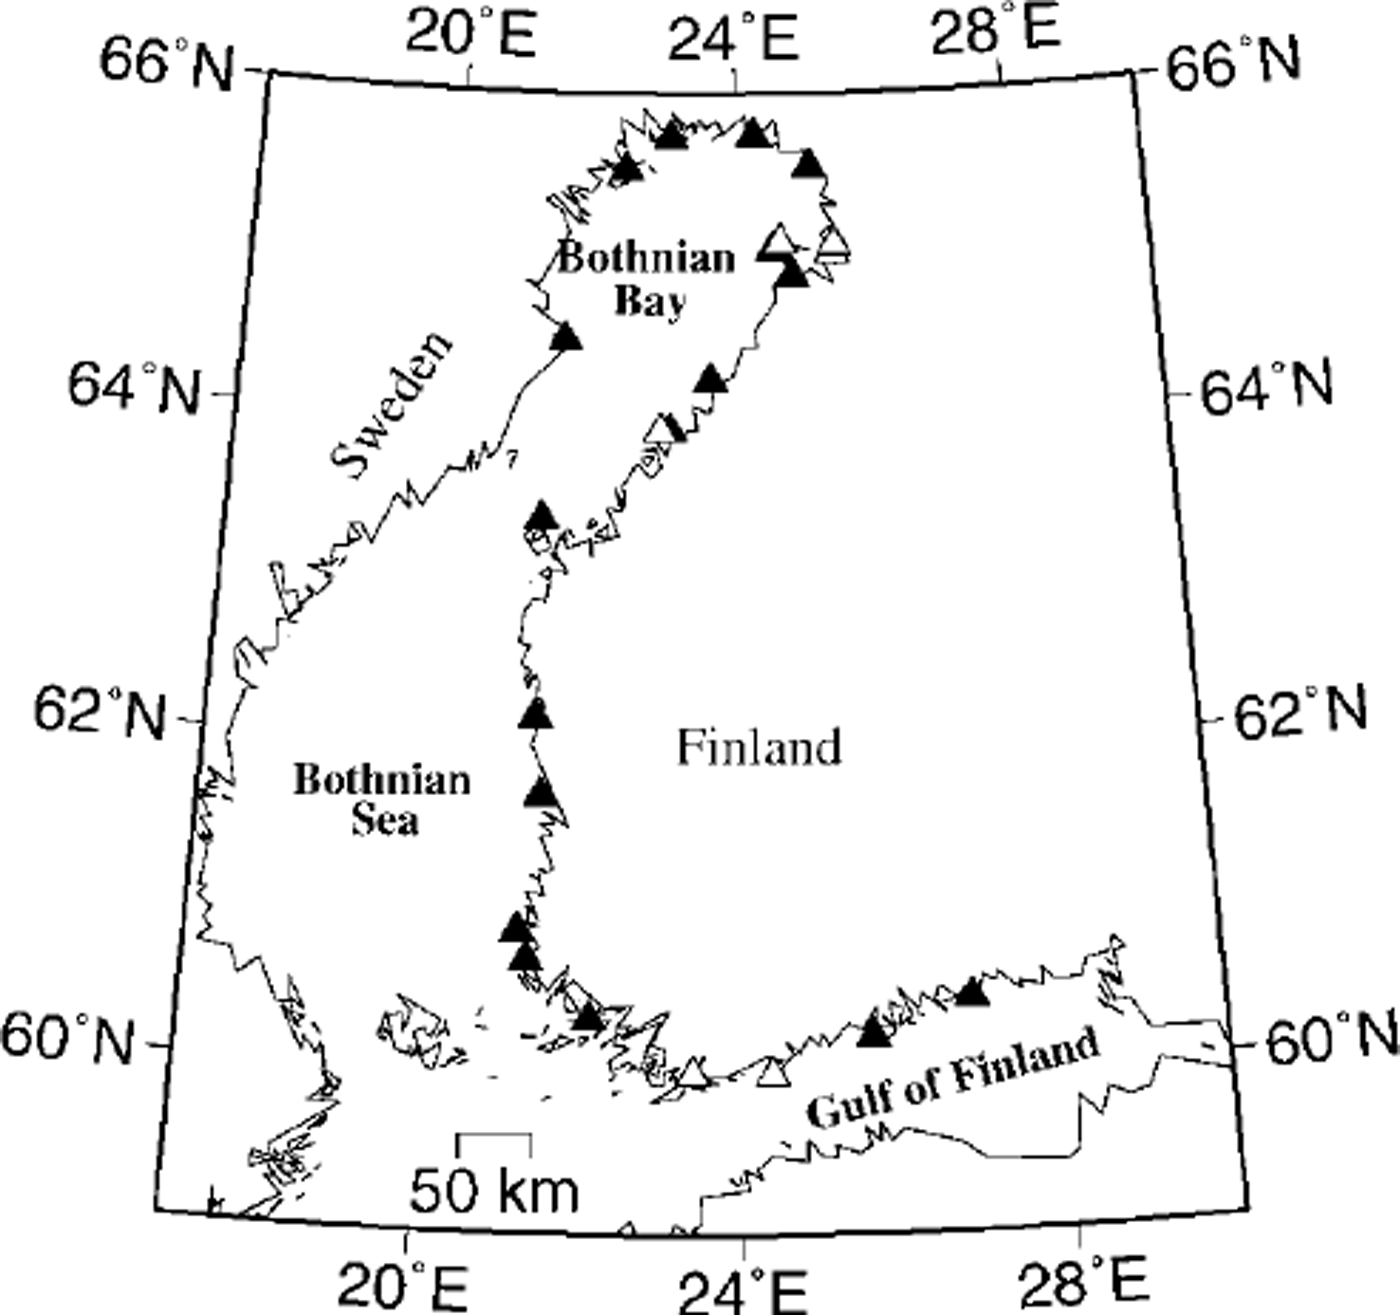
Sea-ice and surface-water samples were collected during January, March and April 1999 along the Finnish coast of the Gulf of Finland and the Gulf of Bothnia and the Swedish coast of the Bay of Bothnia (Fig. 1). Altogether 23 ice cores and 17 surface-water samples were collected from coastal sites with level landfast ice. The water depth at the sites was 5−20 m.
Map of the northern baltic sea and location of sampling sites. sites with both ice and water samples are denoted with ▲, whereas Δ indicates sites where only ice samples were collected.
A 13 cm diameter coring auger was used to collect ice cores. In the field some of the thicker cores were divided into two or three segments (in total 34 segments), with a stainless-steel saw, based on visual inspection of the ice core into opaque and clear parts. The segments were immediately put into plastic tubing and placed in a freezer, at approximately −15° to −20°C, within 1 hour from retrieval and kept frozen until chemical analysis.
Surface-water samples were collected through the core hole with a Limnos water sampler (Limnos Ltd), at about 1 m depth beneath the ice/water interface and put into 0.5 L acid-washed polyethylene bottles which were frozen until chemical analysis. For total particulate matter (TPM) analysis, 2 L samples were collected and then frozen until determination.
Analytical methods
Sediment content (TPM), salinity and nutrients (phosphorus, Ptot−P; nitrogen, Ntot−N; phosphate, P04−P; sum of nitrite and nitrate, N02+3−N) were determined in all samples. Total Al, Cd, Cu, Fe, Ni and Pb and dissolved Cu and Fe concentrations were determined from 20 selected ice-core segments and all water samples.
Prior to chemical analysis all samples were thawed at room temperature. Ice samples were carefully moved into acid-washed buckets before melting. Care was taken to remove all surfaces from the ice cores which had potentially been contaminated during sampling. The samples were shaken during the melting process to make sure that the sample temperature did not increase much above the melting point prior to the next step in the pre-treatment process.
TPM was determined as the material retained by a glass-fiber filter (Whatman GF/F, nominal pore size 0.7 μm). About 1000 mL of sample was filtered through pre-weighed filters. Several blanks were used (filtered with Nanopure water). Before weighing, filters were dried at 105°C and cooled in a desiccator. Weights for total mass were corrected by the average weight change of the blanks.
The fractions of P and N were analyzed according to Reference Grasshoff, Grasshoff, Ehrnhardt and KremlingGrasshoff (1983) and Reference Koroleff, Grasshoff, Ehrnhardt and KremlingKoroleff (1983). Phosphate was measured from a filtered sample, and Ptot−P from an unfiltered sample, after pressure digestion with peroxodisulfate (120°C, 30 min). N O 2 + 3 was determined using automated cadmium reduction method with an autoanalyzer. Total N was pressure-digested with peroxodisulfate (120°C, 30 min). The accuracy and precision of the methods have been controlled by use of certified reference materials and in intercalibration exercises.
The trace elements were analyzed according to national standards (SFS, 1990a, b). The dissolved metals were separated by filtering through a 0.45 μm membrane. Unfiltered samples were digested with HNO3 (67% p.a.) under pressure (120°C, 30 min) for total trace-metal analysis (acid-leachable) (SFS, 1980). The determination of trace metals was performed with flameless AA (Varian GTA 96). The concentration of metals in particulate matter was estimated by the difference between soluble and total metal concentrations. The accuracy and precision of the methods used have been controlled by participation in intercalibration exercises and by use of certified reference materials (VKI). An experiment is underway to detect any contamination during the sampling process itself.
The structural properties of the ice cores were studied by observing the optical behaviour of thin sections between crossed polarizers. The ice was divided into granular and columnar ice, the former being snow and/or frazil ice.
Results and Discussion
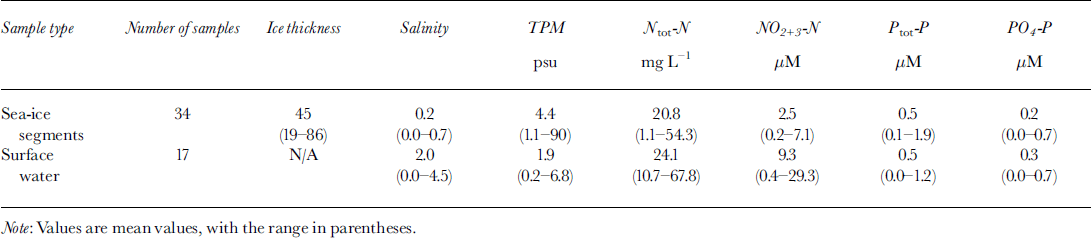
In general, the ice samples had a similar physical structure, with a granular-ice layer on the top and columnar ice in the bottom. However, the total thickness varied from 19 to 86 cm (Table 1), and the thermodynamic history of the cores might differ considerably, especially since surface melting had started at the southernmost sites at the time of sampling. The relative thickness of the granular-ice fraction decreased northwards; granular ice accounted for up to 30% of the total ice thickness in the Gulf of Finland, but only about 10% in the northernmost samples. In the Bay of Bothnia the ice was covered with a 10−30 cm thick snow layer, whereas in the southern sites there was a snow slush layer on the ice surface.
Summary of data on sea-ice core and surface-water properties and nutrients
Strong variabilities in space (and time) must be taken into account when studying the geochemistry of surface waters (and sea ice) in the large study area. Both natural and anthropogenic processes act upon the locations sampled in different spatial and time-scales. The atmospheric input generally tends to decrease northwards (e.g. N, Fe, Gd, Ni, Pb), and the riverine load is higher than atmospheric input into the Gulf of Finland (e.g. Gd, Gu, Zn, Pb) (HELCOM, 1991, 1993). In the Gulf of Bothnia the atmospheric load is generally higher than the riverine load, despite the high river discharge (HELCOM, 1991, 1993). Locally, sources such as industry and municipalities also determine the geochemical properties of surface waters. The main aim of this paper, despite the facts mentioned above which make the coastal waters rather heterogeneous in character, is to relate the geochemical properties of the sea ice to (1) its physical properties and (2) those of the underlying waters, not to study the spatial variability in the geochemistry of sea ice and surface waters in detail.
TPM
The results from TPM analyses show that sea ice contained, on average, twice as much particulate matter as the underlying water. On average there was 4.4 mg L-1 (1.1−90) in ice and 2.0 mg L-1 (0.2−6.8) in underlying water (Table 1). This can be expected, since after a (land-fast) ice cover has formed, mixing is reduced, causing suspended particles in the underlying water column to settle. Based on structural analyses of the ice cores, the highest values of TPM were associated with granular ice (not including snow ice), and the maximum value (90 mg L-1), observed in ice west of Hailuoto island in the Bay of Bothnia, was caused by entrapment of sand-sized particles from the sea floor from approximately 8 m depth. Sediment-laden sea ice has been observed previously in the same region (Reference GranskogGranskog, 2000).
Nutrients
Our results for nutrient analysis of sea ice and surface waters (Table 1) are in good agreement with previously published nutrient data from the Baltic (e.g. Reference Kangas, Alasaarela, Lax, Jokela and Storgärd-EnvallKangas and others, 1993; Reference Mock, Meiers and GiesenhagenMock and others, 1997).
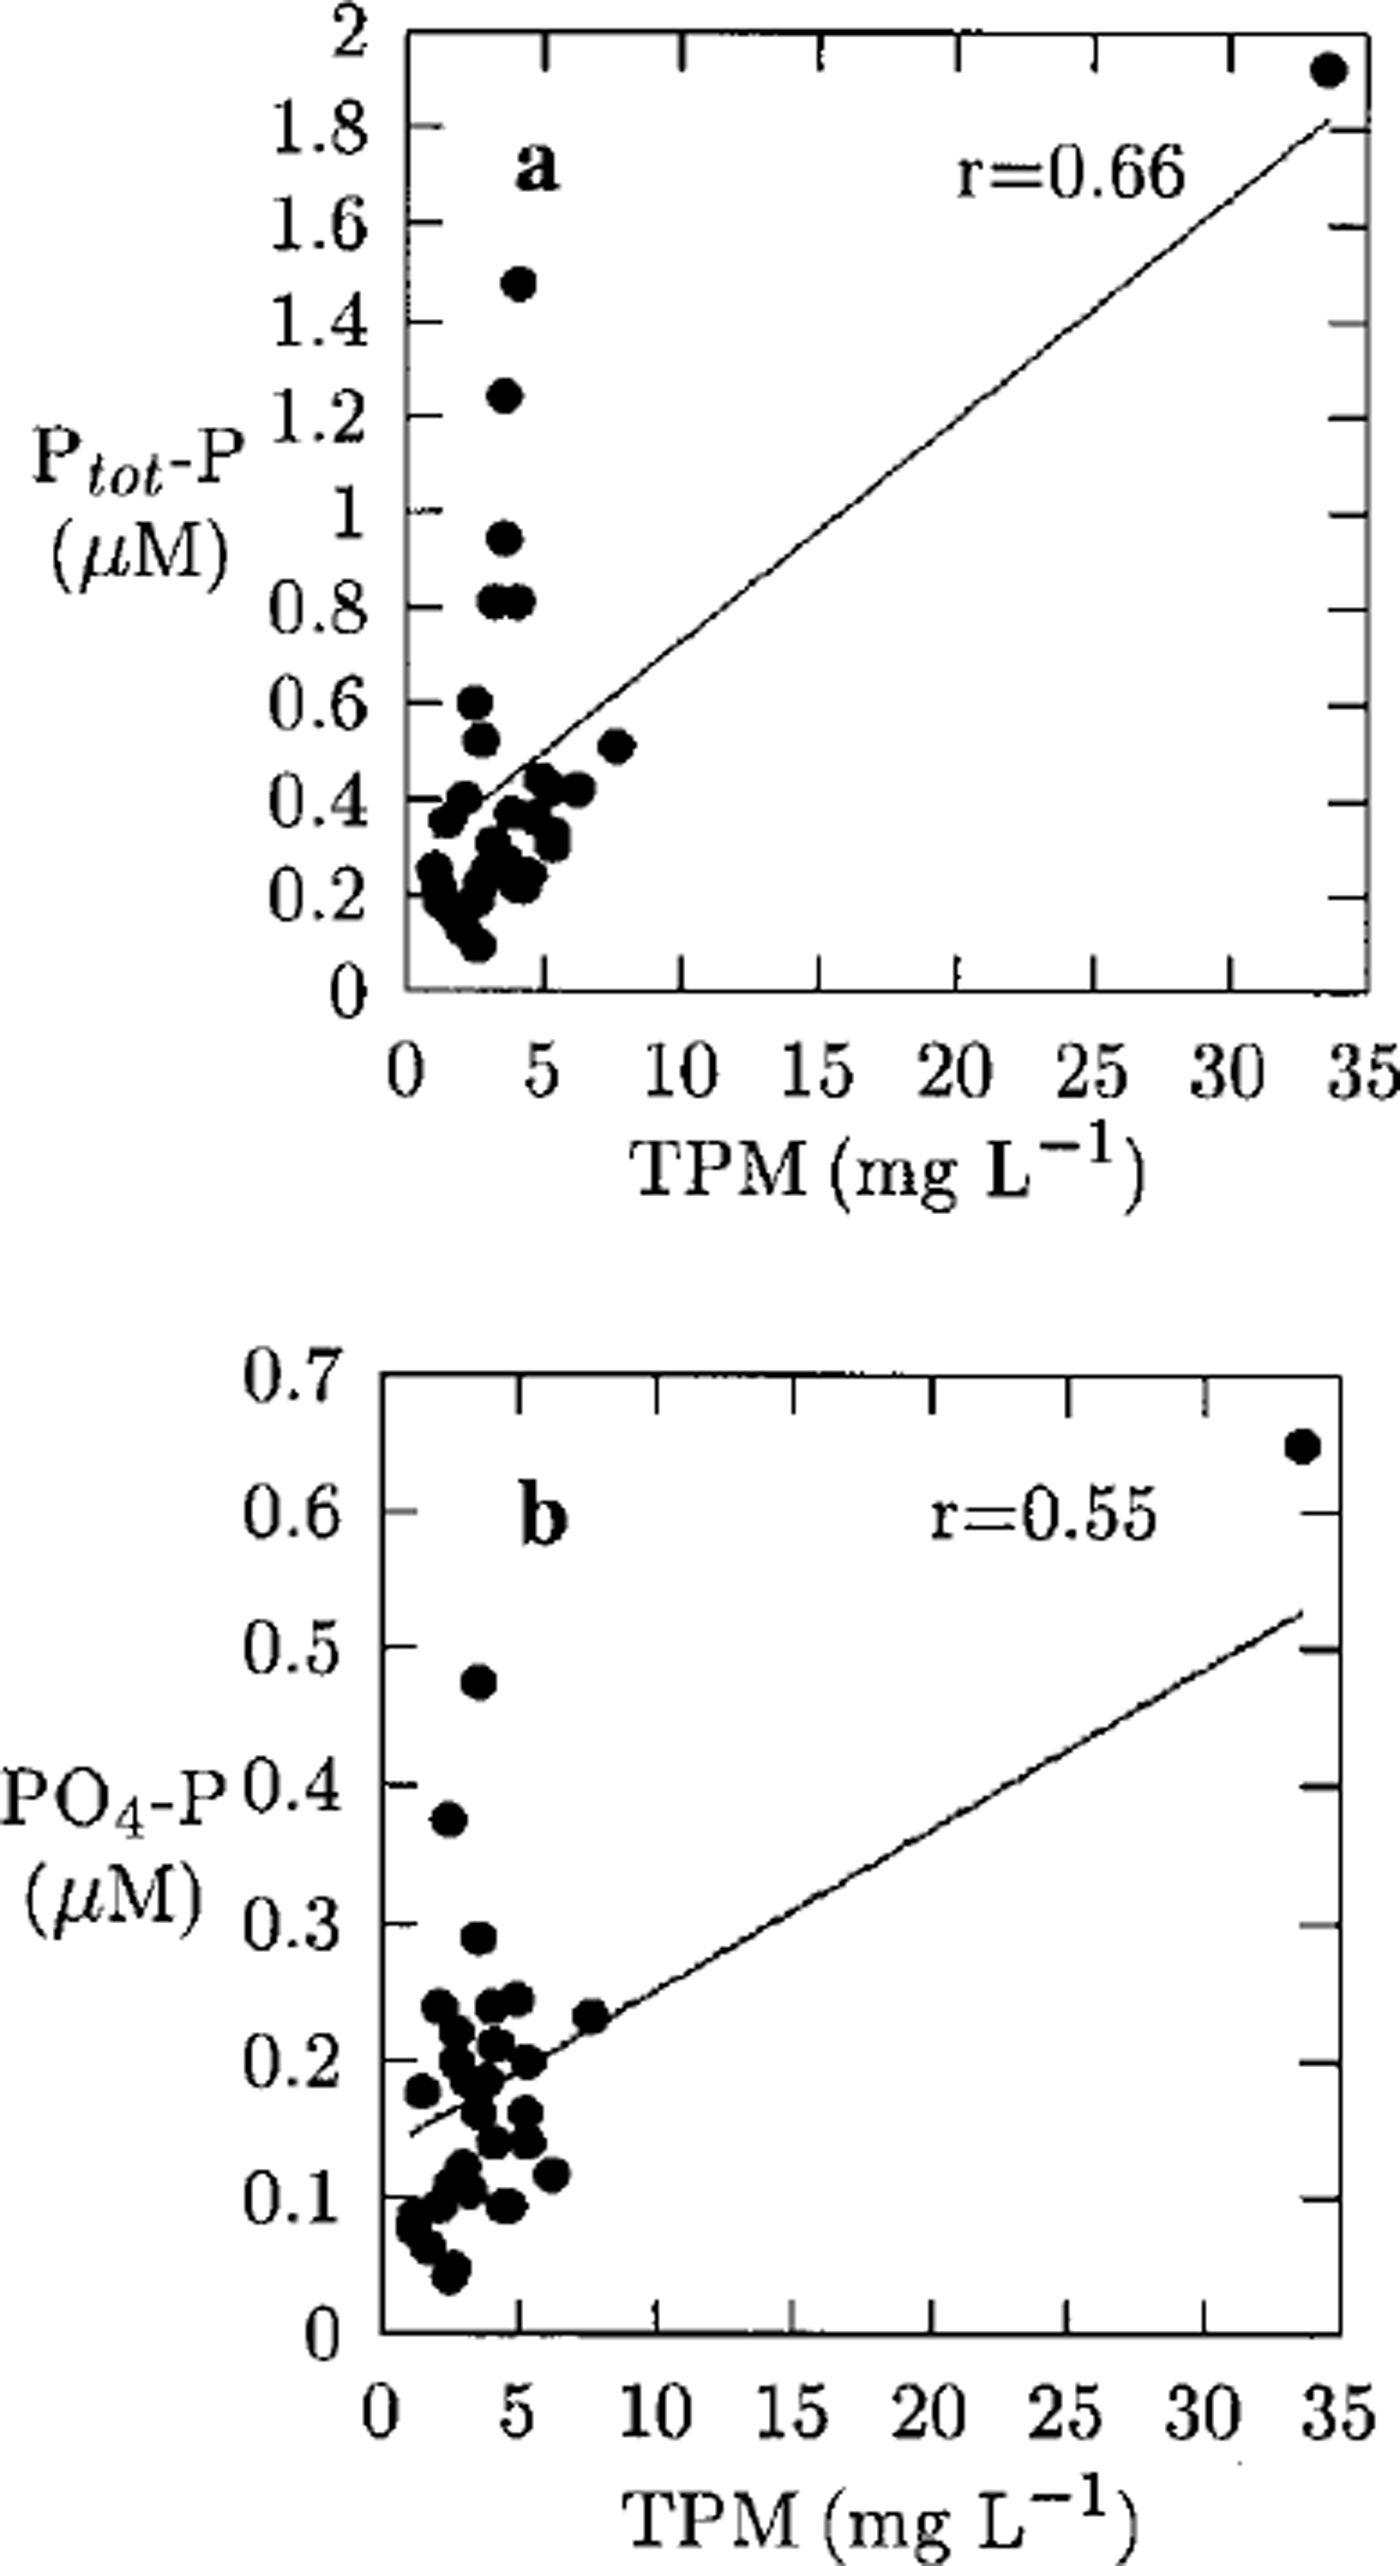
Correlation coefficients betweenTPM, salinity and nutrients in the ice samples were computed. The most significant correlations in the ice were found between TPM and Ptot−P (r = 0.66), TPM and PO4 −P (r =0.55) (see Fig. 2) * and Ptot−P and PO4 −P (r = 0.67), whereas Ntot−N and NO2 + 3 −N showed no significant correlations (r = 0.07 and r = 0.05, respectively) with TPM. This indicates that particle incorporation into the ice cover could explain some of the phosphorus and phosphate found in the ice, whereas nitrogen and nitrite+nitrate seem to be governed by other processes. From Figure 2a it can be seen that the Ptot−P values are divided into two subgroups by the regression curve. The subgroup associated with higher Ptot−P values, some of them also having high PO4 −P values, haveTPM values below the average and are from the topmost segment of nine samples, which mainly consisted of granular ice, possibly snow ice. Hence, snow-ice formation seems to affect phosphorus, and to some extent phosphate, concentrations in the ice. However, the highest values of phosphorus and phosphate (1.9 and 0.7 μmol L-1, respectively) were observed in young 19 cm thick ice with a notably high particle content (33 mg L-1), due to entrapment of silt-sized material into a 2 cm thick frazil-ice layer during a freeze-up storm.
Ptot−p vs tpm (a) and po4−p vs tpm (b) in the ice samples. best-fit linear regression line included (solid line). regression equations were calculated without inclusion of the samples with tpm of 33.6 mg l-1, and 90 mg l-1 (higher value also omitted from the figure).
Ntot−N and NO2 + 3 −N also show higher values in the topmost segments of those cores divided into two or three sections. This could be a result of snow-ice formation as observed by Reference Rahm, Hakansson, Larsson, Fogelqvist, Bremle and ValderramaRahm and others (1995) in the Bay of Bothnia. However, the values for nitrogen are considerably lower than those reported by Reference Rahm, Hakansson, Larsson, Fogelqvist, Bremle and ValderramaRahm and others (1995). Their results were based on only a few ice samples, and the nutrients were determined with higher vertical resolution (elevated values of nitrogen, nitrate and nitrite in the topmost 5 cm). The values presented in this paper, however, are bulk values and do not exclude the possibility of higher values in the pure snow-ice fraction. Also Reference Norrman and AnderssonNorrman and Andersson (1994) observed high nutrient concentrations in sea ice in the Gulf of Bothnia, and associated the high values with atmospheric precipitation. A comparison with the results presented by Reference Mock, Meiers and GiesenhagenMock and others (1997) from the western Baltic indicates that the longer ice season in the northern parts of the Baltic makes snow-ice formation, i.e. atmospheric deposition, more important for the nutrient status of sea ice than in the southern parts.
Comparing nutrient concentrations in the ice with those in the surface waters diluted to the salinity of the ice samples (i.e. normalized to the under-ice water salinity), the following conclusions can be drawn: Ptot−P, PO4−P, Ntot−N and NO2+3−N values in the ice were generally enriched relative to surface waters. However, in the northernmost samples NC-2+3−N was depleted when the surface-water salinities were low ( <0.3 psu (practical salinity units)) and the sample consisted of columnar ice with extremely low salinities ( <0.1 psu). The enrichment of NO2+3−N, and subsequently of Ntot−N, is possibly a result of bacterial activity in the ice or atmospheric deposition onto the ice, as discussed above. Phosphorus and phosphate, to some extent, are also governed by particle inclusions. Even though we do not know the nutrient concentrations in the surface waters during ice growth, we can assume that the maximum concentrations occurred at the time when the samples were collected, according to observations by Reference Kangas, Alasaarela, Lax, Jokela and Storgärd-EnvallKangas and others (1993).
Furthermore the nutrients showed poor correlations with salinity, indicating that nutrients were independent of salinity effects, as observed by Reference MeeseMeese (1989) in Arctic waters. This suggests that secondary processes, such as biological activity, atmospheric deposition and particle entrapment, govern the nutrient status of Baltic Sea ice in the coastal regions.
Trace elements
The high trace-element concentrations in this study, shown in Table 2, reflect the location of the samples in a transition zone between the fresh-water inputs and the more saline pelagic waters. For Al, Cu, Fe and Ni the observations in surface waters agree reasonably well with those in stream waters draining to the study area (Reference Lahermo, Vaananen, Tarvainen and SalminenLahermo and others, 1996). The dissolved levels of Cu (1.6−6.5 and 0.7−2.6 μg L-1 in the waters and the ice, respectively) and Fe (17.6−123.6 and 8.5−100.4 μg L-1 in the waters and the ice, respectively) are generally between the values reported by Reference Kremling and PetersenKremling and Petersen (1984) and Reference Lahermo, Vaananen, Tarvainen and SalminenLahermo and others (1996). The levels of Cu, Fe and Ni observed by Reference Campbell and YeatsCampbell and Yeats (1982) in Baffin Bay were in the lower range of our observations. The levels in the ice are considerably higher than those reported by Reference MelnikovMelnikov (1991) for sea ice in the Russian Arctic (Table 2). An exception is cadmium. Detectable Cd concentrations (>0.1 μg l-1) were observed in only a few of our water and ice samples. However, the observed Cd values are considerably higher than reported elsewhere (e.g. Reference Louekari, Saarikosko and Joki-KokkoLouskari and others, 1991) and must therefore be viewed with caution.
Summary of data on total trace metals (>? l-1) in sea ice and surface waters
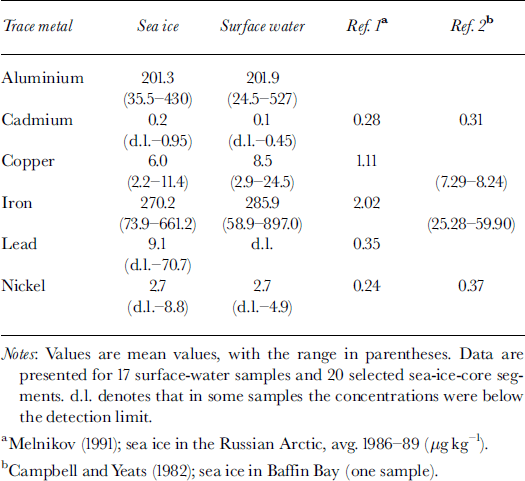
The mean (total) levels of Al, Cu, Fe and Ni in the ice were close to the observations in the surface waters (Table 2). Pb was observed in detectable concentrations (>1 μg L-1 ) in the ice only. This indicates that sources other than the sea water where the ice is formed have to exist for lead. This could reflect atmospheric deposition of Pb onto the ice-covered sea surface, as indicated by observations of the surface microlayer in the Baltic by Reference Brugmann, Bernard and van GriekenBrügmann and others (1992). Also Reference MelnikovMelnikov (1991) observed that sea ice in the Russian Arctic contributes lead to underlying waters during decay, and suggested atmospheric deposition as a reason.
This cannot be confirmed from our observations, although the levels of Pb in snow have been observed to be relatively high, up to 14 Mg L−1, at coastal sites in the Gulf of Finland (Reference Soveri and PeltonenSoveri and Peltonen, 1996). The relatively high element levels indicate that sea ice is a potential source of Pb to surface waters, and less important for Al, Cu, Fe and Ni, during sea-ice decay.
Frequently for Fe and Cu the particulate fraction represents concentrations that are several times higher than for their dissolved counterparts. On average, 82% and 66% of Fe and Cu, respectively, was in the particulate fraction in the ice. In surface waters the values decreased to 73% and 48%. Values for Fe are similar to, whereas values for Cu are much higher than, those reported by Reference Brugmann, Bernard and van GriekenBrügmann and others (1992) for pelagic waters in the Baltic. The decrease in the relative contribution of the dissolved fraction of the metals in the ice can be attributed to brine rejection during ice formation. Because sea ice excludes salts and other dissolved substances during growth, the ice has probably lower dissolved concentrations than the water it grew from. However, the conditions at the sampling sites are not constant during the ice season, with respect to salinity and trace elements. This makes quantitative estimates of the importance of brine expulsion impossible from the bulk concentrations measured. Temporal observations throughout the ice season would be necessary to be able to quantitatively determine the importance of brine exclusion for dissolved trace-metal concentrations in sea ice. In the northernmost parts of the Baltic, there is a tendency for decreased Fe and Al levels in the uppermost segments. This is probably caused by snow-ice formation because snow has considerably lower Fe and Al concentrations than the coastal waters in the Bay of Bothnia: about 50 and 500 μg L−1 Fe in snow and surface waters, respectively (Reference Soveri and PeltonenSoveri and Peltonen, 1996).
Extremely high Fe values (600−900 μg l-1) were observed in under-ice waters in the northernmost Bay of Bothnia. Concentrations in the ice were also high in this region, 200−600μg L-1FcThe particulate fraction composed > 8 5% ofFe in these ice samples. The high values of several elements (e.g. Fe and Al) in the Bay of Bothnia, in comparison to other parts of the Baltic, have been attributed to the high river discharge into this basin (e.g. Reference Kremling and PetersenKremling and Petersen, 1984). The high levels of Fe (and Al) in the under-ice waters indicate dispersal of riverine waters beneath the ice, as observed, for example, by Reference Alasaarela and MyllymaaAlasaarela and Myllymaa (1978).
All trace elements showed poor correlations with salinity and TPM in the ice samples analyzed. Several inter-element relationships were indicated by the correlation analysis (e.g. Fe/Al, Fe/Cu and Fe/Ni were closely related to each other). One striking exception was Pb, which showed poor correlation with all the other measured parameters, suggesting different mechanisms for incorporation of lead into the ice cover.
Conclusions
From our observations in the coastal regions of the northern Baltic Sea, the following conclusions can be drawn.
sea ice contains on average twice as much TPM as surface waters. To some degree this difference is caused by the time lag between the start of ice formation and the time of sampling (settling of particles in the water column after initial ice formation).
nutrients are independent of salinity effects. Particle entrapment, atmospheric deposition and snow-ice formation are important for the nutrient status of Baltic Sea ice. The influence of biological activity cannot be judged from our observations.
the levels of Al, Gu, Fe and Ni in the ice are similar to those in the surface waters, whereas Pb was observed at detectable levels in sea ice only. Therefore, we argue that incorporation of lead is governed by different processes than for the other elements studied.
the excess of lead in sea ice, compared to the underlying waters, indicates that sea ice contributes lead to surface waters during melting in the coastal areas.
sampling and analytical procedures could be improved in order to more accurately identify the mechanisms affecting the nutrient and trace-element status of sea ice in the Baltic Sea (see below).
The importance of biological processes could not be determined from our observations. In retrospect we can judge that observations of ammonium, nitrate and nitrite separately, silica, chl-a and snow properties (density, nutrients, trace elements, etc.) would have been useful. For future work, the ice samples for chemical analysis should be divided according to the physical structure obtained from thin-section analysis and not in the field. Differentiation of snow and frazil ice would also be useful (e.g. using stable oxygen isotopes), in order to be able to distinguish more accurately the different sources for nutrients and trace elements. Furthermore the temporal variability during the ice season affects the ice properties, so a monitoring throughout the whole ice season would be needed to study the processes affecting sea-ice geochemistry in more detail. Observations in the pelagic waters would also shed new light on the importance of sea ice on biogeochemical processes in other seasonally ice-covered parts of the Baltic Sea.
Acknowledgements
The authors are grateful to A. Blanco Sequeiros and P. Kosloff for providing some ice cores for this study. The comments of two reviewers and S. Pfirman improved the original manuscript considerably. This study has been funded by the Academy of Finland through project "Coastal sea ice and oceanography of the Baltic Sea in winter", and the Graduate School for Snow and Ice Research, University of Helsinki. M.A.G. acknowledges the Finnish Academy of Science and Letters for providing funding to participate in the symposium.



