I. INTRODUCTION
Zirconium (Zr) alloys are commonly used as the cladding and channel materials in reactor cores of water-cooled reactors. It is, therefore, necessary to investigate the irradiation-induced damage phenomena that can limit the lifetime of these components. Under neutron irradiation, Zr alloys exhibit irradiation-induced growth and creep, Reference Woo1,Reference Holt2 an anisotropic volume-conserving shape change that results in an axial elongation and radial reduction, the extent of which depends on the irradiation species and fluence, the flux and temperature, and the alloy composition, microstructure, and texture. Reference Gilbon, Soniak, Doriot, Mardon, Gabol and Moan3–Reference Zu, Sun, Atzmon, Wang, You, Wan, Busby, Was and Adamson8 For fully recrystallized material, this change occurs at an accelerated rate in the “breakaway” regime at fluences above ∼5 × 1025 n m−2 in light water reactors at 292 °C. Reference Adamson, Gabol and Moan4 Microstructural and microchemical analysis is important in determining the mechanistic factors that contribute to the macroscopic growth process, and such features have traditionally been studied by using laboratory x-ray diffraction (LXRD) and transmission electron microscopy (TEM) techniques. The focus of the present study is to demonstrate how advances in these two techniques allow for a more detailed analysis of irradiated material, and further, to show that the complementary nature of XRD and TEM can be used to draw wider conclusions about mechanistic processes.
XRD offers the ability to obtain statistically significant quantitative data that result from the sampling of bulk material. The hcp lattice parameters a and c of α-Zr can be obtained from Rietveld refinement of the diffraction profile, and line broadening analysis Reference Ribárik, Ungár and Gubicza9–Reference Balogh, Tichy and Ungár11 of the diffraction profiles yields dislocation population and density information. While laboratory XRD is valuable and easy to access, advances in synchrotron XRD offer higher flux, sharper resolution, lower background, and less instrumental effects, Reference Thompson, Parker, Potter, Hill, Birt, Cobb, Yuan and Tang12 which are beneficial to the study of dislocations and microstructures Reference Borbély and Ungár13 and the evolution of low volume fractions of secondary phases under irradiation. Reference Vizcaíno, Banchik and Abriata14,Reference Béchade, Menut, Doriot, Schlutig and Sitaud15
Developments in scanning/TEM (S/TEM) field-emission guns allow for brighter electron sources, and advances in aberration-correction lenses have produced subangstrom probes that are capable of chemical analysis on the atomic scale. Reference Akbashev, Roddatis, Vasiliev, Lopatin, Semisalova, Perov, Amelichev and Kaul16 The increasingly large collection angle of windowless electron dispersive x-ray (EDX) detectors has resulted in higher count rates and lower acquisition times than conventional detectors, such that meaningful spectral images can be obtained in minutes. The primary benefit of such systems to irradiated material is the detection of small concentrations of elemental segregation that occurs in regions such as at dislocation cores and grain boundaries. The only comparable technique with efficient detection at high spatial resolution, 3D atom probe tomography (APT), unfortunately provides limited sample volumes to interrogate. APT has been used to demonstrate segregation to grain boundaries in non-irradiated ZIRLO™ Reference Hudson and Smith17 and nanoclustering and segregation of Fe to dislocations in non-irradiated Zr oxide Reference Dong, Motta and Marquis18 and in neutron-irradiated Zr metal and oxide. Reference Sundell, Thuvander, Tejland, Dahlbäck, Hallstadius and Andrén19
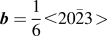
It has been suggested, and is generally accepted, that an increase in the density of <c + a>-type dislocation loops with a Burger's vector
 ${\bi{b}} = {1 \over 6} \lt 20\bar 23 \!\!\,>$
,
Reference Woo20
hereafter referred to as <c>-loops, is associated with an increase in irradiation-induced growth strain.
Reference Griffiths, Gilbert and Carpenter21
However, the role of alloying elements in the nucleation and distribution of such dislocation loops is an area of some controversy; a higher density of <c>-loops is commonly observed in close proximity to dissolving second phase particles (SPPs)
Reference Griffiths, Gilbert and Carpenter21–Reference de Carlan, Regnard, Griffiths, Gilbon, Lemaignan, Bradley and Gabol23
and yet overall alloy compositions with a higher Fe content have been shown to experience less macroscopic growth strain.
Reference Shishov, Peregud, Nikulina, Kon'kov, Novikov, Markelov, Khokhunova, Kobylyansky, Novoselov, Ostrovsky and Obukhov24
Additionally, Fe is known to enhance the diffusion of Zr self-interstitial atoms,
Reference King, Hood and Holt25
which must themselves be responsible for any macroscopic dimensional changes. Although a relatively uniform density of dislocation loops with an <a> component only, i.e., <a>-loops with
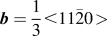 ${\bi{b}} = {1 \over 3} \lt 11\bar 20 \!\!\,>$
,
Reference Woo20
is another primary form of damage in Zr alloys, the effect of the irradiation-induced redistribution of alloying elements on the formation of <a>-loops is rarely studied due to the correlation of the striking <c>-loops and an accelerated growth strain. However, recent atomistic modeling has suggested that Nb acts to reduce their nucleation and that alloying elements such as Fe, Ni, and Cr would tend to segregate to these defects.
Reference Christensen, Wolf, Freeman, Wimmer, Adamson, Hallstadius, Cantonwine and Mader26
The effects of such segregation on the observation of irradiation damage by both TEM and XRD are a focal point of the following report. Additionally, the effect of precursors to dislocation loops, such as point defect clusters, on the investigation of irradiation damage, especially by XRD, is highlighted.
II. EXPERIMENTAL
A. Material
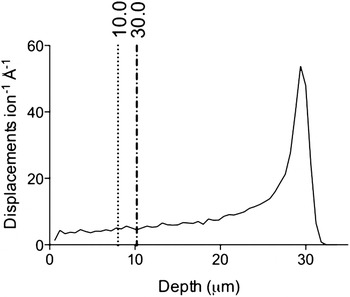
The nonirradiated and proton-irradiated material studied here is commercially processed Zircaloy-2 (nominal Zr–1.3Sn–0.1Fe–0.01Cr–0.005Ni, wt%; Westinghouse Electric Company), supplied in fully recrystallized sheet form with equiaxed grains of ∼5–15 μm diameter and a strong basal texture in the normal direction. This material was mechanically polished to electron backscatter diffraction quality and then proton-irradiated in the normal direction at the Michigan Ion Beam Laboratory's 1.7 MeV Tandetron accelerator facility at 2 MeV and 350 ± 9 °C to doses of 2.3, 4.7, and 7.0 dpa at a current of ∼0.2 μA mm−2. The damage in dpa was calculated from the atomic displacement profile generated by the stopping and range of ions in matter (SRIM) software package, with a Zr displacement energy of 40 eV Reference Was6 and the “Quick” Kinchin and Pease damage calculation. Reference Stoller, Toloczko, Was, Certain, Dwaraknath and Garner27 The displacement profile for 2 MeV protons in pure Zr is shown in Fig. 1.
The damage profile as calculated by the stopping range of ions in matter (SRIM) for 2 MeV protons in pure Zr. A displacement energy of 40 eV Reference Was6 was used for the “Quick” Kinchin Pease calculation. Reference Stoller, Toloczko, Was, Certain, Dwaraknath and Garner27 The damage in the region <20 μm is relatively uniform. The penetration depth of synchrotron x-rays at 5° tilt was 10 μm. Different reflections are sampled from different depths; the first reflection 10.0 and the twentieth reflection 30.0 are shown here to demonstrate that the variation is ∼2 μm.

Electropolished TEM foils were made from the proton-irradiated bars by carefully grinding from the nonirradiated side to a thickness of ∼160 μm and then electropolishing using a twin-jet Tenupol-5 electropolisher with a Julabo FP50 cooling unit. An electrolyte of 10% perchloric acid and 20% 2-butoxyethanol in ethanol Reference Tournadre, Onimus, Béchade, Gilbon, Cloué, Mardon, Feaugas, Toader and Bachelet7 was used to polish ∼12 μm from the irradiated surface and ∼148 μm from the nonirradiated surface until perforation, protecting the irradiated side with Agar Scientific's acid-resistant Lacomit varnish. The non-irradiated bulk material was prepared in a similar manner.
The neutron-irradiated Zircaloy-2 was supplied by Studsvik and Westinghouse in the form of electropolished TEM foils, Reference Valizadeh, Ledergerber, Abolhassan, Jädernäs, Dahlbäck, Mader, Zhou, Wright and Hallstadius28 irradiated in a BWR (280–330 °C) Reference Azevedo29 to fluences of 9.5 and 13.1 × 1025 n m−2. If a conversion factor of 1 dpa = 5 × 1024 n m−2 is used, Reference Griffiths, Gilbert and Carpenter21,30 then these fluences correspond to 19 and 26.2 dpa, respectively. The neutron-irradiated Low-Sn ZIRLO™ (nominal Zr–10.66Sn–0.96Nb–0.12Fe–0.127O–0.0038Si–0.0065C, wt%) TEM foil was also provided by Studsvik and Westinghouse at a fluence of 8.9–9 × 1025 n m−2 ∼ 17.8–18 dpa, given the above fluence conversion.
B. X-ray diffraction
1. Synchrotron XRD
Measurements were taken at beam line I11 at the Diamond Light Source synchrotron due to the beam line's sharp angular resolution, parallel beam, small energy spread, high flux, and low background. Reference Thompson, Parker, Potter, Hill, Birt, Cobb, Yuan and Tang12 The high angular resolution of 0.001° attained by using the detector setup of five multi-analysing crystal (MAC) detector arms, each consisting of 9 Si(111) analysing crystals coupled to 9 detectors, allows for accurate determination of the peak shape used for line broadening analysis, while the parallel beams and small energy bandwidth give a narrow instrumental profile that can be accounted for in the extended Convolutional Multiple Whole Profile (eCMWP) software Reference Ribárik, Ungár and Gubicza9–Reference Balogh, Tichy and Ungár11 to obtain quantitative information from synchrotron profiles. The high flux and low background allow for the study of minor phases such as SPPs in Zr alloys; the background is low enough that precipitate reflections can clearly be observed after a 30 min scan, even with an intensity as low as 0.5% of the maximum reflection intensity. This allows for the study of the evolution of precipitates with increasing irradiation damage.
The neutron-irradiated Zircaloy-2 samples were studied in transmission geometry through the thin central region of the electropolished TEM foils. The foils were manufactured such that the radial direction of the cladding was normal to the sample surface. As a result of the texture, the majority of basal poles are orientated parallel to the beam direction and so the basal reflections are weak. The neutron damage profile is uniform throughout the zirconium cladding. Therefore, the size and position of the sampling volume is only limited by the requirement that the diffracted x-rays must transmit through the sample. As the neutron-irradiated Low-Sn ZIRLO™ was only available at one fluence level, currently there has been no detailed study of this material by synchrotron x-ray diffraction (SXRD).
A beam wave length of 0.82616 Å and a 200 × 200 μm footprint were used, which was sufficient to produce high intensity, high quality peaks over 30 minute scans. The need to hold the samples in a TEM sample holder caused diffracted x-rays in the 60–120° region in 2θ to be absorbed by the holder, thereby reducing the range of detectable diffraction reflections. The wave length of the beam was determined using a silicon standard, and the peak profiles from this standard were also used to quantify instrumental broadening.
A 2 × 2 mm specimen was cut from the proton-irradiated bars and used for analysis by SXRD. A reflection geometry was used for the proton-irradiated specimens and so it was important to sample an irradiated depth of the specimen with a relatively constant damage level. With reference to Fig. 1, the first 20 μm is relatively uniform in terms of irradiation damage, and so a tilt angle of 5° was used to limit the x-ray penetration depth to 10 μm. The texture of the proton-irradiated bars was such that the majority of basal poles were orientated parallel to the normal face of the bars, resulting in strong sampling of basal planes in this geometry.
The penetration depth of diffracted x-rays is a function of 2θ, as shown in Eq. (1),
 $$x = 2l\left[ {{{\sin \alpha \cdot \sin \left( {2\theta - \alpha } \right)} \over {\sin \alpha + \sin \left( {2\theta - \alpha } \right)}}} \right]\quad {\rm{,}}$$
where x is the penetration depth, l is the attenuation length that is a function of the mass attenuation coefficient μ/ρ, and α is the tilt angle of the surface of the sample with respect to the direction of the beam. Equation (1) was derived by defining the penetration depth as the depth measured perpendicularly from the surface of the flat sample to the diffracting plane, while the beam travels a distance of twice the attenuation length in the material. For a beam with a wave length of 0.825634 Å, i.e., 15 keV beam energy, the μ/ρ in Zr is 24.63 cm2 g−1.
31
From Eq. (1), it is clear that x depends on the peak being measured. However, the variation in penetration depth between the first reflection
 $\left( {10\bar 10} \right)$
at 2θ = 17.0° and the twentieth reflection
 $\left( {30\bar 30} \right)$
at 2θ = 52.6° is ∼2 μm, demonstrated in Fig. 1.
The footprint of the beam on the surface of the sample was set to 1 × 1 mm2 and the scan time was 30 min. Sampling statistics were further improved by spinning the samples at 1200 rpm.
2. Laboratory XRD
The x-ray measurements were taken using a Bruker D8 Discover x-ray diffractometer. The x-ray diffractometer was set up with a cobalt x-ray source using a 0.2 mm slit and a 0.02 mm Fe filter. The diffraction pattern was measured from 35–140° in a step size of 0.02° per step and time per step of 10 s at ambient temperature using a point detector. Instrumental profiles were taken from a strain free corundum standard.
C. Transmission electron microscopy
All TEM bright field imaging and selected area electron diffraction work were performed on a FEI Tecnai F30 microscope, operating at 300 kV. Structural analysis was performed on the same microscope with the ASTAR automated crystal orientation mapping system, Reference Rauch and Dupy32 coupled with precession Reference Vincent and Midgley33,Reference Rauch, Veron, Portillo, Bultreys, Maniette and Nicolopoulos34 at an angle of 0.8° at a rate of 100 Hz to reduce dynamical effects using the NanoMegas precession system. The ASTAR system requires the scanning acquisition of convergent nanobeam electron diffraction patterns as a function of position and so a small probe in TEM mode is required. A 20 μm condenser C2 aperture and small spot size were used, resulting in an almost parallel probe with a diameter of ∼3 nm and a low probe current of ∼26 pA. Nanobeam diffraction patterns were then indexed by comparison to simulated kinematical patterns using the ASTAR Index software V1.4.
All chemical analyses were performed on a FEI Titan G2 80-200 kV S/TEM “ChemiSTEM™” microscope, benefiting from a combination of spherical aberration-correction, a bright field-emission gun (X-FEG) electron source and four energy dispersive x-ray (EDX) detectors in close proximity to the sample, resulting in a total solid collection angle of 0.7 srad. The microscope was operated at 200 kV with a probe current of 0.5 nA. The quantification of spectral images was performed using the Cliff–Lorimer approach assuming no absorption, and for neutron-irradiated material a blank background was subtracted to account for emitting radiation being detected by the ChemiSTEM™ system. Detailed chemical mapping of matrix chemistry is demonstrated for 7 dpa proton-irradiated Zircaloy-2 and mapping of an Fe–Ni type SPP in Zircaloy-2 neutron-irradiated to 9.5 × 1025 n m−2. A direct comparison of the effects of the different irradiative species on microchemical evolution is not given explicitly, but is alluded to in the text wherever appropriate. A detailed analysis of microchemical evolution in Low-Sn ZIRLO™ has been published by the same group previously. Reference Francis, Harte, Frankel, Haigh, Jädernäs, Romero, Hallstadius and Preuss35
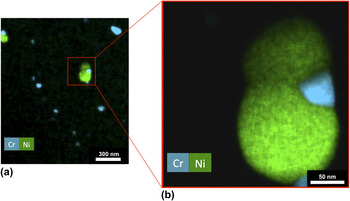
The use of low magnification (14k x) spectral imaging can be a very useful tool in quickly determining the size, shape, and number density of particles in irradiated material. Due to high brightness and spectrometers with large collection solid angles combined with high spatial resolution capabilities, the x-ray count rate is sufficiently high for quick and efficient detection of small quantities of chemical segregation in such systems. An example of such an experiment is given in Fig. 2; the main alloying elements that constitute SPPs in Zircaloy-2 are Cr and Ni for the Zr(Fe,Cr)2 (Ref. Reference Coaquira, Rechenberg and Mestnik Filho36) and Zr2(Fe,Ni), Reference Havinga, Damsma and Hokkeling37 respectively, and so a combined Cr and Ni map is shown in the figure. The contrast in such chemical maps is far better than HAADF or BF images and so the accuracy of number density and shape measurements is much improved. Additionally, dual SPPs, such as that shown in Fig. 2, can have complex morphologies that are easily missed by point identification spots and linescans. For SPP size and counting, 14 Fe and Cr maps were analyzed from nonirradiated Zircaloy-2 and 15 from Zircaloy-2 proton-irradiated to 7.0 dpa.
The combined Cr and Ni chemical maps, extracted from spectral images at (a) low magnification and (b) higher magnification. The two spectral images were collected for 5 and 30 min, respectively, the former giving an overview of the SPP size and number density, and the latter giving a more detailed picture of a complex SPP morphology.

For SPP number density calculations, thickness measurements in the STEM were approximated by the number of counts per channel detected by the low magnification spectral map for the Zr Kα peak. Each low magnification spectral image was obtained for exactly 300 s, and so any differences in Zr signal were attributed to the foil thickness. Absolute SPP densities are, therefore, not possible as true thickness is not determined. Rather, changes in relative SPP density are measured.
III. RESULTS
The following is divided into two sections; results pertaining to the study of dislocations and those to the study of SPPs. Dislocation analysis concerns Zircaloy-2 only, whereas analysis of SPPs concerns both Zircaloy-2 and Low-Sn ZIRLO™ alloys.
A. Dislocations
Figure 3 exemplifies SXRD and LXRD profiles of proton-irradiated Zircaloy-2 to 4.7 dpa and the SXRD profile for neutron-irradiated Zircaloy-2 to 13.1 × 1025 n m−2 for the (a) basal (0002), (b) prismatic
 $\left( {10\bar 10} \right)$
, and (c) pyramidal
 $\left( {10\bar 11} \right)$
reflections.
Synchrotron diffraction profiles (SXRD) of Zircaloy-2 neutron irradiated to 13.1 × 1025 n m−2 (blue) and proton irradiated to 4.7 dpa (green) and laboratory diffraction profiles (LXRD) of Zircaloy-2 proton irradiated to 4.7 dpa (black). (a) (0002) reflection, (b)
 $(11\bar 20)$
reflection, and (c)
 $(10\bar 11)$
reflection. The shoulder is clearest in the synchrotron diffraction profile of the (0002) reflection of the proton-irradiated Zircaloy-2, and is present but difficult to see in the dislocation broadened neutron-irradiated profiles and in the laboratory XRD profiles.

When comparing the full width half maxima (FWHM) of the 4.7 dpa proton-irradiated peaks in the SXRD profile, it can be seen that the main part of the (0002) reflection has not broadened whereas the
 $\left( {10\bar 10} \right)$
and
 $\left( {10\bar 11} \right)$
reflections have.
The other major feature clearly apparent in the SXRD data of the proton-irradiated sample in Fig. 3 is the duplex nature of the diffraction peaks, with each reflection containing the intense Bragg component and a weaker broad component, hereafter referred to as the shoulder, that is shifted toward a lower diffraction vector (K) relative to the Bragg reflection. This feature is most striking in the (0002) diffraction peak, and other reflections with a strong <c> component. The observation of the shoulder was aided by a high Bragg peak intensity and low Bragg peak broadening. The Zircaloy-2 data at 4.7 dpa are only shown as an example; this shoulder was also observed in Zircaloy-2 proton-irradiated to doses of 2.3 and 7.0 dpa.
Laboratory XRD data are also shown in Fig. 3. For any given counting time, the background in a LXRD profile relative to an α-Zr Bragg reflection is an order of magnitude greater than that of the SXRD background. This causes weak reflections that result from crystallographic texture, such as the
 $\left( {10\bar 10} \right)$
reflection shown in Fig. 3(b), to be barely above the LXRD background. Despite this, the intense (0002) doublet Bragg reflections in Fig. 3(a) can clearly be seen along with the weaker shoulder. Comparing the LXRD and SXRD (0002) reflections shown in Fig. 3(a), where the doublet is not observed, both techniques show that there is no broadening, suggesting that there is no <c>-loop formation at 4.7 dpa. However, for the prismatic reflection, the basal texture causes the LXRD
 $\left( {11\bar 20} \right)$
reflection to be weak, masking the shoulder clearly observed in the SXRD profile. In Fig. 3(c), a feature causing asymmetry can be observed in the left hand side of the LXRD Bragg reflection, but it is clear in the SXRD data that this is due to a shoulder in the tails of the Bragg reflection.
The final element of Fig. 3 is the SXRD profile of Zircaloy-2, neutron-irradiated to 13.1 × 1025 n cm−2. Since the diffraction profile of the neutron-irradiated sample was obtained in transmission geometry, the sample texture dictates that the SXRD (0002) reflection of the neutron-irradiated sample shown in Fig. 3(a) is weaker than the one of the SXRD of the proton-irradiated sample. However, the shoulder of the (0002) reflection can still be observed due to the low background and the relatively narrow Bragg component. The shoulder appears in Figs. 3(b) and 3(c) as an asymmetric broadening of the Bragg reflection rather than as an obviously separate component, which is due to the large <a>-loop dislocation broadening of the Bragg reflection.
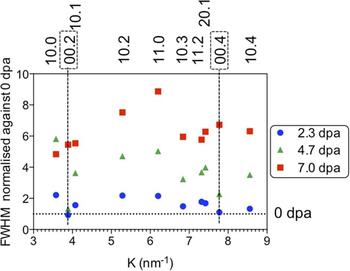
Figure 4 shows the Williamson–Hall plot comparing ten reflections of the proton-irradiated samples at 2.3, 4.7, and 7.0 dpa, normalized to the FWHM of the nonirradiated case. It is clear that all reflections have broadened significantly at 2.3 dpa except for the basal (0002) and (0004) reflections. At the 4.7 dpa level the basal reflections have still not significantly broadened, whereas the other reflections have continued to broaden from 2.3 dpa. At 7.0 dpa, the basal reflections have broadened, in line with the broadening of the other reflections.
Williamson–Hall plot for 2.3 dpa, 4.7 dpa, and 7.0 dpa proton-irradiated Zircaloy-2 samples, normalized against 0 dpa FWHM measurements. The dashed horizontal line indicates the normalized 0 dpa data, i.e., normalized FWHM at 0 dpa =1. For the 2.3 dpa and 4.7 dpa reflections, it can be seen that the 0002 and 0004 reflections do not exhibit any significant broadening relative to 0 dpa reflections, indeed much less than prismatic and pyramidal reflections, suggesting that <c>-loops have yet to form. These same reflections are shown to broaden considerably once the sample has been proton-irradiated to 7.0 dpa, suggesting the presence of <c>-loops. All other reflections show nearly linear increases in broadening with dose.

The
 $\left( {10\bar 10} \right)$
reflection shows the highest broadening for 2.3 and 4.7 dpa, but at 7.0 dpa the
 $\left( {11\bar 20} \right)$
exhibits the most broadening. The prismatic and pyramidal reflections show near linear increases in broadening between the irradiation doses, but comparatively little broadening between the nonirradiated material and 2.3 dpa.
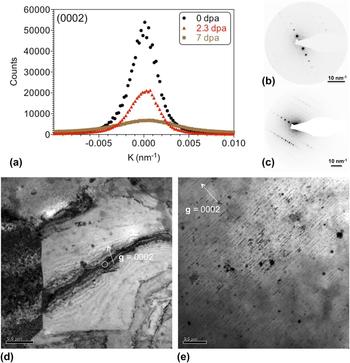
Figure 5 demonstrates the comparability between SXRD line broadening analysis and that dislocation evolution observed in the TEM. Figure 5(a) shows the (0002) reflection from the SXRD profiles of Zircaloy-2 in the nonirradiated state and at proton-irradiated doses of 2.3 and 7.0 dpa. The broadening, quantified by the full width at half maximum (FWHM) of the Bragg reflections, indicates that there is no significant increase in broadening from 0 to 2.3 dpa but a threefold increase in FWHM from 2.3 to 7.0 dpa. This suggests that the nucleation of <c>-loops occurs at a dose between 2.3 and 7.0 dpa. Figures 5(d) and 5(e) show dynamical and kinematical bright-field TEM images, respectively, of grains at the 2.3 and 7.0 dpa dose level at the g = 0002 diffraction condition. Although a bend in the grain of Fig. 5(d) has resulted in a large (0002) bend contour, there are no visible <c>-loops in the micrograph at 2.3 dpa. Figure 5(e) demonstrates the presence of <c>-loops parallel to (0002) planes at 7.0 dpa with a spacing along the <0002> direction of ∼50 nm, directly comparable to that observed in neutron-irradiated Zircaloy-2. These observations are in agreement with the variations in peak broadening measured by SXRD. Figures 5(b) and 5(c) give the selected area electron diffraction patterns at the g = 0002 condition for the 2.3 and 7.0 dpa dose levels, respectively.
Comparison of broadening of nonirradiated and proton-irradiated Zircaloy-2: (a) Bragg reflection for (0002) plane of nonirradiated Zircaloy-2 (0 dpa, black) and proton irradiated to 2.3 dpa (red) and 7.0 dpa (green). There is no increase in the FWHM of the (0002) Bragg reflection between 0 dpa (FWHM = 0.005) and 2.3 dpa (FWHM = 0.004), but a threefold increase between 2.3 and 7.0 dpa (FWHM = 0.007). (b) and (c) show selected area electron diffraction patterns from 2.3 and 7.0 dpa proton dose, respectively, both at the g = 0002 orientation. (d) and (e) are bright-field TEM micrographs demonstrating the lack of <c>-loops at a proton dose of 2.3 dpa and the presence of <c>-loops at a dose of 7.0 dpa. Images (d) and (e) correspond to diffraction patterns (b) and (c), respectively.

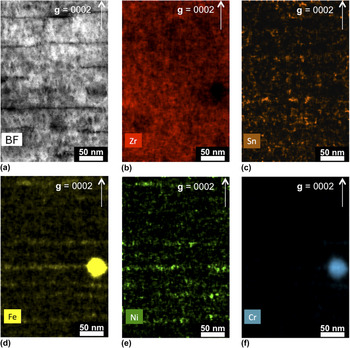
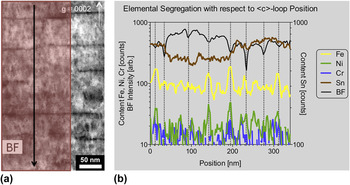
Chemical segregation to <c>-loops can be seen in Fig. 6, which shows Zr, Sn, Fe, Ni, and Cr chemical maps extracted from a spectral image. Clear segregation of Fe and Ni parallel to the trace of basal planes was observed and, to a lesser extent, Sn segregation. A linescan was extracted from the spectral image and is displayed in Fig. 7(b). The linescan area is shown in Fig. 7(a) and was averaged over the direction parallel to the (0002) basal plane, ensuring that the Fe–Cr SPP was not included in the data set. The linescan data in Fig. 7(b) also includes the bright-field (BF) STEM image intensity, in which dips in intensity correspond to the presence of dislocations. These dips are highlighted along the x-axis by small ticks and in the graphic by dotted vertical lines. Of the eight dislocations in the BF image, five contain peaks in Fe content and three of those five also contain a peak in the Ni content. There are an additional two peaks in Fe content, parallel to basal planes but not coincident with a <c>-loop. Although it is difficult to determine from the figure, there are no significant peaks in Cr content. There are two significant peaks in Sn content at positions of ∼130 and 220 nm, both of which are approximately half way between dislocation positions.
(a) Bright field and (b)–(f) chemical maps extracted from a spectral image of a precipitate in Zircaloy-2, proton-irradiated to a dose of 7.0 dpa for Zr, Sn, Ni, Fe, and Cr. Vector g = 0002, demonstrating the chemical segregation to basal planes in a similar manner to <c>-loop nucleation. An Fe–Cr SPP is also shown, from which Fe seems to be channeling into the matrix.

A linescan in the direction given by (a) and averaged over the direction parallel to the (0002) basal plane. The linescan and bright-field intensity data in (b) show that Fe (and, to a lesser extent, Ni) preferably sits on sites coincident with <c>-loop positions, which are indicated by dips in the BF intensity. These dips are highlighted along the x-axis by small ticks and in the graphic by dotted vertical lines. The two peaks in Sn occur approximately half way between dislocation positions.

B. Second-phase particles
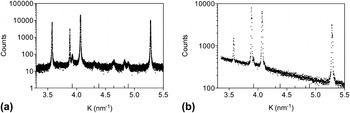
In Fig. 8(a), the SXRD profile displays Bragg reflections attributed to SPPs known to be in Zircaloy-2; the Laves phase Zr(Cr,Fe)2 (hcp, C14, space group 194 = P63/mmc) Reference Coaquira, Rechenberg and Mestnik Filho36 noted by small tick marks on the internal x axis and the Zintl-like phase Zr2(Fe,Ni) (tetragonal, space group 140 = I4/mcm) Reference Havinga, Damsma and Hokkeling37 denoted by large tick marks. All bar one precipitate reflection is subsumed into the background in the LXRD profile of Fig. 8(b), highlighting the requirement of synchrotron radiation for the study of precipitates with such a small volume fraction.
Diffraction profiles of nonirradiated Zircaloy-2: (a) synchrotron diffraction profile; (b) LXRD profile. The precipitate reflections from Zr(Cr,Fe)2 and Zr2(Fe,Ni) are evident in (a) due to the low background whereas only one possible precipitate reflection is visible in (b).

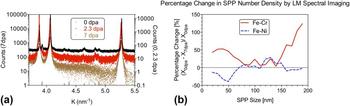
Figure 9(a) shows the evolution of the precipitate reflections after proton irradiation from the non-irradiated case to that of 2.3 and 7.0 dpa. The precipitate reflections are most clearly observed in the non-irradiated data, while decreasing in intensity at 2.3 dpa before reducing to background at 7.0 dpa. The decrease in the intensity of Zintl-like phase reflections was more noticeable than that of the Laves phase reflections. The results of SPP number density analysis by low magnification spectral imaging in the TEM, such as that shown in Fig. 2, can be seen in Fig. 9(b), in which the percentage change in number density from the non-irradiated state to the 7.0 dpa dose level is displayed. The data shown in Fig. 9(b) were obtained from 14 grains at 0 dpa and a total of 248 SPPs, resulting in a mean of 17.7 SPPs per grain with a standard deviation of 6.07 SPPs, and from 15 grains at 7 dpa and a total of 237 SPPs, resulting in a mean of 15.8 SPPs per grain and a standard deviation of 6.10 SPPs. The lack of change in standard deviation (ratio 0 dpa/7 dpa = 0.10) suggests that low magnification spectral imaging is a reliable and reproducible method of recording SPP numbers. When grain thickness is taken into account, the ratio of the standard deviations 0 dpa/7 dpa = 1.07 and so remains relatively unchanged. The fact that number populations are closer to the mean after irradiation may be a result of irradiation-induced dissolution. Additionally, it seems that the spacing between SPPs is large enough to reduce the effect of grain thickness in counting for thicknesses of up to ∼200 nm. From the Fe–Cr SPP data in Fig. 9(b), it can be seen that small (<70 nm) and large (>150 nm) SPPs increase in number density, whereas the number density of medium-sized (70–150 nm) SPPs remains roughly constant. From the Fe–Ni data, it can be seen that medium-large SPPs do not change in number density but that the number density of small SPPs decreases, most likely due to the relatively high dissolution rates of Fe and Ni in ?-Zr with respect to Cr. Reference Christensen, Wolf, Freeman, Wimmer, Adamson, Hallstadius, Cantonwine and Mader26,Reference Perez, Nakajima and Dyment38 It should be noted that statistical significance is difficult to achieve in the TEM and so the data are noisy to the extent that error bars shown in Fig. 9(b) would make it difficult to read. However, the overall decrease in the number density of Fe–Ni relative to Fe–Cr SPPs correlates to the larger decrease in Zr2(Fe,Ni) reflections' intensity in the SXRD profile at 2.3 dpa relative to the Zr(Fe,Cr)2 reflections shown in Fig. 9(a). No amorphization of any Fe–Cr SPPs was observed by TEM after proton-irradiation at 350 °C to 7.0 dpa most likely due to the higher temperature of irradiation; all the Fe–Cr SPPs were found to be completely amorphous in the neutron-irradiated material (280–330 °C). Reference Azevedo29
(a) Synchrotron diffraction profile of Zircaloy-2 nonirradiated (0 dpa, black) and proton irradiated to 2.3 dpa (red) and 7.0 dpa (brown); tick marks on the bottom axis mark the precipitate diffraction reflections. The precipitate reflections are clear in the nonirradiated profile, weaken after irradiation to 2.3 dpa before reducing to background after 7.0 dpa. The backgrounds have been adjusted for visual clarity. (b) The percentage change in precipitate number density between the nonirradiated and dpa dose level. The Fe–Cr data show that the number of small and large SPPs increase, whereas the number of medium-sized SPPs remains approximately constant. The Fe–Ni data show that the number density of small SPPs decreases and that of medium-large-sized SPPs remains approximately constant.

The preferential dissolution of an Fe–Ni SPP parallel to the basal plane is observed in neutron-irradiated Zircaloy-2 at a fluence of 9.5 × 1025 n m−2 in Fig. 11, which shows the chemical maps for Zr, Sn, Fe, Ni, and Cr, extracted from a spectral image. The vector <0002> was determined in STEM mode by observation of the Kikuchi lines surrounding the ronchigram. SPP dissolution parallel to (0002) is also evident from Fig. 6, in which the highest signal from Fe parallel to the basal plane is in line with a dissolving Fe–Cr SPP in proton-irradiated material.
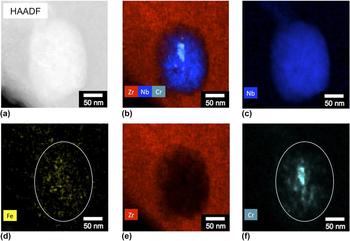
The chemical maps for Zr, Nb, Fe, and Cr shown in Fig. 12 are extracted from a spectral image of a SPP from neutron-irradiated Low-Sn ZIRLO™. Prior to irradiation, the Zr(Fe,Nb)2 type of SPP is known to contain a small amount of dissolved Cr.
Reference Sabol, Comstock, Weiner, Larouere, Stanutz, Garde and Bradley39
Under neutron irradiation, this type of SPP is known to undergo Fe dissolution and a hcp to bcc phase transformation.
Reference Shishov, Peregud, Nikulina, Kobylyansky and Ostrovsky40
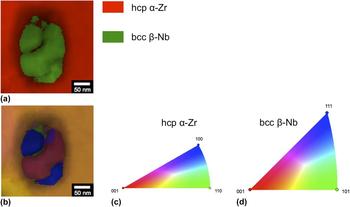
Although this figure was published recently in Ref. Reference Francis, Harte, Frankel, Haigh, Jädernäs, Romero, Hallstadius and Preuss35, it is repeated here due to its relevance to Fig. 12, which contains phase and orientation maps of that same SPP. The chemical data from Fig. 11 confirm that the SPP was Zr–Fe–Nb(–Cr)-type prior to irradiation and the phase map confirms the phase transformation. The region of ambiguity in the center of the SPP in the phase map is coincident with a Cr core, either side of which is shown to be a different orientation in the orientation map. The blue part of the orientation map has its normal parallel to the <656> axis and the pink part has its normal parallel to
 $\left[ {\bar 2\bar 1\bar 6} \right]$
, resulting in an absolute misorientation between the two orientations of ∼33°.
IV. DISCUSSION
The following is divided into two sections; discussion pertaining to the study of dislocations and that to the study of SPPs. Dislocation analysis concerns Zircaloy-2 only, whereas analysis of SPPs concerns both Zircaloy-2 and Low-Sn ZIRLO™ alloys.
A. Dislocations
The low background and minimal instrumental broadening present in SXRD profiles have enabled the observation of subtle asymmetries in Bragg reflections. <c>-loop dislocations have not formed in Zr at low irradiation doses and so there is no broadening on basal plane Bragg reflections, Reference Balogh, Brown, Mosbrucker, Long and Daymond41 such as that shown in Fig. 3(a) in the 4.7 dpa proton-irradiated Zircaloy-2 profiles. This lack of broadening of the main peak makes the weaker shoulder of these reflections easier to observe. However, as seen in Figs. 3(b) and 3(c), the shoulder also appears in prismatic and pyramidal reflections in proton- and neutron-irradiated Zircaloy-2. The shoulder's center is at a lower K compared to the Bragg reflections, and their visibility depends on the intensity and broadening of the Bragg reflection, so that the shoulder is more difficult to visualize in the higher dose neutron-irradiated samples and is commonly observed as an asymmetry in the Bragg reflection.
In previous diffraction line profile studies of deformed material, asymmetry has been attributed to dipolar walls Reference Groma and Monnet42 or dislocation cell walls, Reference Mughrabi, Ungár, Kienle and Wilkens43 which have been shown to be identical approaches. Reference Ungár, Groma and Wilkens44 However, this is unlikely to be a feature in irradiated material due to the stochastic nature of neutron irradiation and such structures not being reported from TEM studies. It has been hypothesized that diffuse scattering causes this shoulder from small dislocation loops Reference Larson and Schmatz45 or point defect clusters. Reference Dederichs46 Since the 4.7 dpa proton-irradiated SXRD (0002) reflection of Fig. 3(a) has not broadened and the shoulder center is at a smaller diffraction vector compared to the Bragg reflection, the diffuse scattering contributing to the shoulder is most likely to be caused by vacancy clusters. Reference Dederichs46 These clusters are most likely to habit the basal plane as the (0002) reflection exhibits the largest shoulder Reference Austerman and Miller47 and so this may be evidence of a precursor to <c>-loops. Alternatively, the presence of such a strong shoulder may simply be due to the lack of broadening of the (0002) Bragg reflection. As the shoulder also appears quite strongly on other families of reflections, there could be defect clusters that lie on other planes.
The shoulder can be observed in laboratory diffraction profiles, especially in Fig. 3(a) with the (0002) reflection due to the intensity of the reflection and the low broadening. In Fig. 3(c), the shoulder is present in the LXRD profile as an asymmetry similar to in the neutron-irradiated profile, but in Fig. 3(b), the Bragg reflection is so weak relative to the background that the shoulder has been subsumed by the background and so is not visible. In LXRD profiles, the shoulders are easily overlooked in comparison to the synchrotron data, especially for Bragg reflections with a texture dependence, adding a complication to obtaining quantitative information from such data sets.
Although the shoulder shares the features of diffuse scattered diffraction reflections, other techniques and further investigation are needed to confirm the nature and cause of these shoulders. Reference Chute and Walker48,Reference Sabine, Pryor and Hickman49
The relative broadening of the basal and prismatic reflections is an indication of whether <c>-loops have formed at that irradiation dose.
Reference Balogh, Brown, Mosbrucker, Long and Daymond41
As shown visually in Fig. 3 for 4.7 dpa, and displayed quantitatively in the normalized Williamson–Hall plot in Fig. 4, for 2.3 and 4.7 dpa the (0002) and (0004) reflections are narrower than the
 $(10\bar 10)$
and
 $(11\bar 20)$
reflections and all other reflections. As the Burger's vector of <c>-loops has a strong <c> component as
 $\lt 20\bar 23 \gt$
type
Reference Woo20
in neutron-irradiated Zr alloys, the lack of broadening suggests that there is no <c>-loop formation by 4.7 dpa. The basal reflections have broadened significantly by 7.0 dpa, which would indicate the presence of <c>-loops. It may therefore be surmised that the threshold dose for <c>-loop nucleation is between 4.7 and 7.0 dpa for 2 MeV proton-irradiated Zircaloy-2 at 350 °C.
While the broadening is shown to linearly increase for all other reflections, the interesting feature is the behavior of the
 $(10\bar 10)$
reflection with respect to that of the
 $(11\bar 20)$
reflection. For 2.3 and 4.7 dpa, the
 $(10\bar 10)$
peak displays the largest broadening of all the reflections, but the
 $(11\bar 20)$
peak is by far the most broadened reflection at 7.0 dpa. This is contrary to expectations; given that the Burger's vector of <a>-loops is known to be
 $11\bar 20$
Reference Woo20
in neutron-irradiated material, one would expect the
 $(11\bar 20)$
reflection to be the most broadened at all doses. TEM investigation into the nature, Burger's vector and habit plane of the <a> loops at all doses would shed some light on this matter.
The postulation that (0002) broadening in the SXRD data is due to the presence of <c>-loops at 7.0 dpa is supported by TEM and is demonstrated in Figs. 4 and 5, where <c>-loops have previously been reported to occur in proton-irradiated Zircaloy-4 under similar irradiation conditions at 11.5 dpa, Reference Tournadre, Onimus, Béchade, Gilbon, Cloué, Mardon, Feaugas, Toader and Bachelet7 although the authors of that particular study did not report the mode that they used to calculate this dose, and it is therefore difficult to compare results between that study and the present one. However, a full quantification of dislocation density by either SXRD or TEM has its limitations. Work is currently underway by the present group to quantify dislocation density by using the eCMWP software, which exploits the premise that distortion of the crystal due to microstrain, Reference Warren and Averbach50 mainly in the form of dislocations, Reference Wilkens51,Reference Wilkens52 or due to small size crystallites Reference Ungár, Tichy, Gubicza and Hellmig53 or faulting, Reference Balogh, Tichy and Ungár11 causes the Bragg reflections to broaden. The experimental set up also contributes to Bragg reflection broadening. The resulting measured profile is a convolution of all these individual components.
However, the shoulder has caused problems for the eCMWP fitting procedure, as it produces an extension in the tails of the Bragg reflections, which is interpreted by the eCMWP analysis as a faster decaying strain field. The shape of the tails predominantly affects a parameter that describes the dislocation arrangement, Reference Wilkens51,Reference Wilkens52,Reference Ungár, Gubicza, Ribarik and Borbely54 causing it to asymptotically decrease. This causes the dislocation density to increase Reference Ribárik55 to unrealistically high values in comparison to TEM observations. The effect of the shoulders was especially evident in the low dose proton-irradiated SXRD data, in which the Bragg reflections are narrower than the high dose neutron-irradiated material.
A further complication to the quantification of dislocation densities by XRD is the segregation of alloying elements to basal planes and dislocation cores, as exemplified in Figs. 6 and 7. Such segregation will have an effect on the strain field associated with dislocation cores, although the magnitude of this effect will need to be assessed by using a theoretical model. The segregation of alloying elements into a planar structure has recently been suggested in neutron-irradiated Zircaloy-2 by APT for Fe, Cr, Ni, and Sn alloying elements although no crystallographic information was recorded on the sample. Reference Sundell, Thuvander, Tejland, Dahlbäck, Hallstadius and Andrén19 The evidence presented here of the segregation of alloying elements to basal planes has not been reported so clearly previously, and is only possible due to advances in TEM and EDX detector capability.
The analysis of chemical segregation to dislocations is difficult because of the annihilation of dislocations at the large free surfaces of the thin TEM foil, which has been demonstrated by in situ heavy ion-irradiated Zr. Reference Idrees, Yao, Kirk and Daymond56 Therefore, thick regions of the foil are required for good imaging of dislocations. However, the resolution of spectral imaging is lower in those regions due to increased beam spreading and absorption. Reference Pennycook and von Ardenne57 Therefore, the regions in which dislocations can be identified are the most difficult to extract good chemical maps. This can be counteracted to some degree by decreasing the dwell time and/or current of the scanning probe such that the number of electrons in any pixel at any one time is reduced and so the effect of spreading and absorption is lessened. Clear chemical segregation to small <a>-loops has not been observed so far in the ChemiSTEM™ Titan by the present authors for this very reason, but it is hoped that APT will reveal if there is chemical segregation to such small defects.
The fine scale maps of Fig. 6 together with the linescan in Fig. 7 may be evidence of the segregation of Fe, Ni, and Sn into clusters that align parallel to the trace of the basal plane after proton irradiation to 7 dpa, with a separation between segregating planes in the <c> direction similar to that between <c>-loops. It may be the case that the lighter elements segregate to <c>-loop positions, and that Sn is enriched in between <c>-loops. Of course, the Sn data are noisier than the Fe data and are therefore more difficult to interpret. However, the difference in segregation behavior between a substitutional alloying element (Sn) and predominantly interstitial alloying elements (Fe, Ni) Reference Christensen, Wolf, Freeman, Wimmer, Adamson, Hallstadius, Cantonwine and Mader26 could be explained by the interaction of those elements and/or their clusters with point defects. Ab initio calculations show that substitutional Fe and Ni create a tensile region within the matrix and swap for Zr self-interstitials that are diffusing parallel to the basal plane, becoming favorable Fe and Ni interstitials themselves. Reference Christensen, Wolf, Freeman, Wimmer, Adamson, Hallstadius, Cantonwine and Mader26 Such interstitials would create compressive stress regions greater than that of substitutional Sn atoms, which would favor pairing with vacancies such as those found in <c>-loops, as is supported by the low energy configuration of Fe-vacancy pairs. Reference de Carlan, Regnard, Griffiths, Gilbon, Lemaignan, Bradley and Gabol23,Reference Christensen, Wolf, Freeman, Wimmer, Adamson, Hallstadius, Cantonwine and Mader26 Sn has the same elemental radius as Zr but is observed to behave as an oversized atom. Reference Hood58 Importantly, Sn clusters have been observed to trap vacancies by positron annihilation spectroscopy as discussed by Hood, Reference Hood58 and as such may not be expected to allow <c>-loops to collapse in its vicinity. The behavior of Fe, Ni, and Sn may therefore result in an alternating chemical rafting structure within the matrix. The preference of interstitials to segregate to <c>-loops rather than substitutionals is also likely due to the greater diffusional capacity of interstitial Fe and Ni Reference Christensen, Wolf, Freeman, Wimmer, Adamson, Hallstadius, Cantonwine and Mader26,Reference Perez, Nakajima and Dyment38 in α-Zr with respect to predominantly substitutional Sn, Reference Christensen, Wolf, Freeman, Wimmer, Adamson, Hallstadius, Cantonwine and Mader26 resulting in fast diffusion of the former to the dislocation core. It may alternatively be the case that Fe and Ni do not simply segregate to <c>-loops but that they aid in their nucleation; it may be the precipitation of alloying elements parallel to basal planes that cause <c>-loop formation by acting as vacancy sinks. Reference de Carlan, Regnard, Griffiths, Gilbon, Lemaignan, Bradley and Gabol23 It has been demonstrated here that SPPs act as Zr self-interstitial atom (SIA) sinks. As SIAs diffuse preferentially along the basal plane, Reference Christensen, Wolf, Freeman, Wimmer, Adamson, Hallstadius, Cantonwine and Mader26 the flux of SIAs toward the SPP would result in a flux in the opposite direction of alloying elements from the SPPs by a replacement mechanism. Reference Griffiths59 Therefore, both vacancy <c>-loops and alloying elements may cluster on basal planes by a cooperative rather than a sequential relationship.
B. Second phase particles
The SXRD precipitate reflections are weak, but clear in the nonirradiated state of Zircaloy-2 as shown in Figs. 8(a) and 9(a). The precipitate reflections are attributed to the two phases identified previously as the Laves phase Zr(Fe,Cr)2, and the Zintl-like phase, Zr2(Fe,Ni). It can be seen from Fig. 8(b) that all but the strongest of the precipitate reflections are absent from the laboratory XRD profile due to the high background and low intensity of the precipitate reflections, therefore the use of a synchrotron is necessary to study the precipitate evolution. Reference Motta, Erwin, Delaire, Birtcher, Chu, Maser, Mancini, Lai, Moan and Rudling60
Under neutron irradiation, amorphization of Laves phase has been reported to occur at normal LWR operating temperatures of 280–330 °C Reference Azevedo29 at a rate of ∼1–1.3 nm per fluence of 1024 n m−2. Reference Griffiths59,Reference Bajaj, Kammenzind, Farkas, Moan and Rudling61,Reference Gilbon, Simonot, Bradley and Gabol62 In the SXRD data presented here, the precipitate reflections are less intense after proton irradiation to 2.3 dpa, but are still visible in Fig. 9(a). As the relative intensities between α-Zr reflections within individual profiles show that the texture of the non-irradiated and irradiated bars is the same, the reduction in SPP reflection intensity is either due to amorphization, a reduction in volume fraction via dissolution, broadening of the reflections caused by microstrain in the precipitates or a reduction in the average size of the precipitates. Reference Motta, Erwin, Delaire, Birtcher, Chu, Maser, Mancini, Lai, Moan and Rudling60
In Fig. 9(a), between 2.3 and 7.0 dpa the precipitate reflections disappear from the diffraction profile entirely. From the TEM investigation in Fig. 9(b), the density of the medium-large SPPs remains approximately constant for Zr2(Fe,Ni) and even increases for Zr(Fe,Cr)2. As no amorphization of any SPPs was observed by ASTAR analysis in the TEM, the disappearance of Zr(Fe,Cr)2 reflections may be explained by an increasingly defective structure and the faster diffusion of Fe relative to Cr and Ni from SPPs, Reference Griffiths, Mecke, Winegar, Bradley and Gabol63 resulting in a change of crystallography and limiting the abilities of the SPPs to diffract coherently. However, no noticeable change in electron diffraction pattern quality from SPPs was observed. A synchrotron experiment that is better adapted to analyze small volume fractions of SPPs, such as with the use of a 2D area detector, could be performed to shed some light on this issue. It can be seen in Fig. 6 that the Fe and Ni segregate parallel to the basal plane in a similar fashion to the <c>-loops in the bright-field micrograph. The segregation of Fe to the basal plane is especially evident in the matrix close to the Fe–Cr SPP, suggesting that Fe dissolves from the SPP preferentially along basal planes, observed recently for Cr, Reference Valizadeh, Ledergerber, Abolhassan, Jädernäs, Dahlbäck, Mader, Zhou, Wright and Hallstadius28 and that there may be a channeling diffusion mechanism occurring out of the SPP.
Since the SXRD reflections are so weak, it has proven difficult to fit these precipitate reflections to obtain the FWHM and implement a modified Williamson–Hall plot Reference Williamson and Hall64,Reference Ungár and Borbély65 (or eCMWP analysis for the hcp Laves phase), so that an average precipitate size could be obtained. Likewise, it has not been possible to determine quantitatively via XRD whether the volume fraction is decreasing by dissolution or amorphization, even by the use of single peak fits. From a visual estimate of the intensities of the precipitate reflections, it appears that the Zintl-like phase precipitate reflections decrease in intensity more than the Laves phase precipitate reflections between 0 and 2.3 dpa. If the reduction in intensity is due to a decrease in volume fraction then this would suggest that the Zintl-like phase is decreasing in volume faster than the Laves phase. This hypothesis is supported by the percentage change in SPP number density in Fig. 9(b); although statistical data are difficult to obtain from the analysis of such small volumes, it may be concluded from the TEM data that the overall density of the Zr2(Fe,Ni) phase remains constant or even reduces from 0 to 7.0 dpa compared to the density of Zr(Fe,Cr)2.
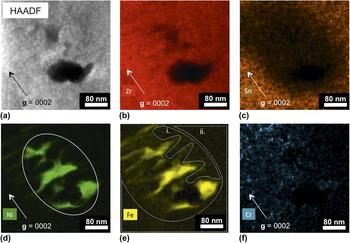
Spectral imaging is independent of dislocation-induced strain contrast and the extraction of chemical maps benefits from the deconvolution of surface contamination and oxidation. This is particularly important for the neutron-irradiated case in the unusual Fe–Ni SPP shape of Fig. 10, in which it is very difficult to discern the SPP shape from the HAADF image. It is clear from the chemical maps, however, that the SPP has dissolved preferentially parallel to the basal plane. Although this is an observation that has been demonstrated previously, and rather beautifully, through conventional imaging techniques, Reference Griffiths and Gilbert66,Reference Yang22 any ambiguity in interpretation Reference Griffiths59 is solved by the use of spectral imaging, which provides more mechanistic evidence. For instance, quantification in different regions of the spectral image may support the discussion by Griffiths that the dissolution of SPPs occurs due to the flux of Zr self-interstitial atoms (SIAs) toward the SPPs Reference Griffiths59 along basal planes. This concept may be evidenced in other studies by the nucleation of vacancy <c>-loops in close proximity to SPPs, Reference Griffiths, Gilbert and Carpenter21–Reference de Carlan, Regnard, Griffiths, Gilbon, Lemaignan, Bradley and Gabol23 and in Fig. 5(e) where there is higher strain contrast surrounding SPPs, suggesting that SPPs are an SIA sink. Evidence for this SIA flux mechanism may be found in the Zr and Sn chemical maps of Figs. 10(b) and 10(c), respectively. Qualitatively, it can be seen that when comparing the region where the SPP has dissolved and the surrounding matrix, the amount of Sn increases into the matrix but the amount of Zr does not increase so dramatically. Quantification of the spectral image in the region where the SPP has dissolved [Fig. 10(e)i.] showed that the Sn content is 0.03 wt% (Zr 99.13, Fe 0.36, Ni 0.34, and Cr 0.13 wt%). This amount of Sn (and Fe, Ni, and Cr) is essentially zero as the accuracy of such a measurement is only ±0.5 wt%. Conversely, the Sn content in the surrounding matrix [Fig. 10(e)ii.] is 0.65 wt% (Zr 97.97, Fe 0.62, Ni 0.65, and Cr 0.12 wt%). This concentration of Sn is less than the nominal composition for several possible reasons, mainly that there is an increase in alloying element concentration close to the dissolved SPP and that Sn has undergone irradiation-enhanced diffusion to grain boundaries Reference Cockeram, Leonard, Snead and Miller67 and irradiation-induced precipitation. Reference Woo and Carpenter68 If only ballistic mixing was involved in the SPP dissolution process then one might expect a higher concentration of Sn and other alloying elements within the dissolved region, or even a concentration of Sn equal to that in the matrix. The fact that this region consists primarily of Zr suggests that the Zr SIA flux mechanism may be responsible.
(a) HAADF and (b)–(f) chemical maps extracted from a spectral image of a precipitate in Zircaloy-2, neutron-irradiated to a fluence of 9.5 × 1025 n m−2 for Zr, Sn, Ni, Fe, and Cr. The Ni map contains a white ellipse demonstrating the probable initial shape of the SPP. The Fe map contains two regions outlined in white, i. and ii., which were used for quantification as inside and outside of the original SPP, respectively.

In addition to chemical information, it is also possible to quickly obtain structural information from SPPs via the ASTAR automatic crystal mapping system. This was used in conjunction with spectral imaging to obtain evidence for the phase transformation of the Zr(Fe,Nb)2 SPP in Low-Sn ZIRLO™ after neutron irradiation to a fluence of 8.9–9 × 1025 n m−2. The results from the ASTAR system are two-fold; both phase and orientation information can be obtained. The phase map in Fig. 12(a) demonstrates that the particle has the bcc Nb structure. However, the particle is not homogeneous in that there is an ambiguous region close to the center that has not indexed in the same way. The orientation map in Fig. 12(b) shows that this region of ambiguity is due to an internal boundary between two orientations. There is no overlap between the two regions of orientation because there is no matrix contribution to the SPP, i.e., the SPP extends throughout the whole thickness of the electropolished foil. From the ASTAR data alone it is difficult to determine why there might be two orientations within a single particle. However, when compared to the chemical data from the same SPP in Fig. 11 it is clear that the Cr core lies at the interface between these two regions of different orientation. It may therefore be possible that the Cr core acts as a nucleation site for the re-orientation of Nb atoms from the hcp structure of Zr(Fe,Nb)2 to the bcc structure of β-Nb after Fe-depletion. Alternatively, it may simply be the case that the β-Nb structure is only able to develop in regions where both Fe and Cr have depleted. This is an observation that would be impossible without the correlation between the two analytical TEM techniques; combining structural and chemical data is the only way to get a complete picture of evolution under irradiation.
(a) HAADF and (e)–(f) chemical maps extracted from a spectral image of a precipitate in Low-Sn ZIRLO™, neutron-irradiated to a fluence of 8.9–9 × 1025 n m−2 for the combined Zr–Nb–Cr elements and for Nb, Fe, Zr, and Cr. The Cr core demonstrates that, prior to irradiation, this SPP was of the Zr–Fe–Nb(–Cr) type, i.e., Zr(Fe,Nb)2, which contains some dissolved Cr. After irradiation, a Cr core remains.

The (a) phase map and (b) orientation map for the SPP shown in Fig. 11. The phase map confirms the hcp-to-bcc phase transformation. The orientation map suggests that the Cr core in Fig. 11(f) acts as a nucleation site for the phase transformation, resulting in two different orientations. (c) and (d) show the orientation legends for hcp α-Zr and bcc β-Nb, respectively.

V. CONCLUSIONS
The comparison of synchrotron and laboratory x-ray diffraction (S/LXRD) demonstrated here shows that there is a requirement for higher flux, sharper resolution, lower background, and less instrumental effects to study the irradiation-induced phenomena that are apparent in synchrotron profiles but easily overlooked in laboratory profiles (Figs. 3 and 8). The weaker shoulder associated with certain Bragg reflections is clear in proton-irradiated material, allowing a better interpretation of the asymmetry observed in neutron-irradiated profiles with broader Bragg reflections. It is thought that such shoulders are indications of defect clusters and could be precursors to dislocations.
The correlation of qualitative SXRD observations and TEM analysis has been used to demonstrate the effectiveness of utilizing one technique to predict results before confirming observations with another, such as the presence of <c>-loops (Figs. 4 and 5) and the dissolution of Zr2(Fe,Ni) at a higher rate than that of Zr(Fe,Cr)2 (Fig. 9). The use of spectral imaging in aberration-corrected, high-brightness STEMs with large solid angles for characteristic x-ray collection, and EDX analysis has demonstrated Fe and Ni segregation to basal planes and <c>-component dislocation loops (Fig. 6), Sn segregation between <c>-loops (Fig. 7), and the dissolution of the Zr2(Fe,Ni) SPP in neutron-irradiated Zircaloy-2 by an irradiation-induced Zr self-interstitial mechanism (Fig. 10). As TEM observations are obtained from small volumes, it is important to model the effect that such processes would have on the interpretation of more statistically significant SXRD data sets, highlighting challenges to quantitative analysis.
Advances in correlative TEM techniques allow for a detailed analysis of mechanisms on the nanometer scale, as exemplified by the chemical, phase, and orientation maps of a Zr–Fe–Nb(–Cr) SPP in neutron-irradiated Low-Sn ZIRLO™ (Figs. 11 and 12). The slower diffusion of Cr relative to Fe results in a Cr core that may act as a nucleation site for the precipitate's hcp to bcc phase transformation.
ACKNOWLEDGMENTS
This work is funded by an EPSRC Leadership Fellowship for the study of irradiation damage in zirconium alloys, and is supported heavily from industrial contributors and especially Westinghouse and Studsvik in terms of both material acquisition and useful discussions. The authors would like to thank Matthew Topping for useful discussions, Gary Was and Ovidiu Toader at the Michigan Ion Beam Laboratory for the use of their facility in the proton irradiation experiments, and the experimental officers at Diamond light source for their aid in implementing the SXRD experiments.