Introduction
Since the confirmation of the existence of subglacial lakes in the late 1960s (Robin et al. Reference Robin, Swithinbank and Smith1970), 675 subglacial lakes have been discovered beneath the Antarctic ice sheet (Livingstone et al. Reference Livingstone, Li, Rutishauser, Sanderson, Winter and Mikucki2022). Multiple studies have targeted these lakes because of their unique isolated environments buried under kilometres of ice and their influence on glacial dynamics (Humbert et al. Reference Humbert, Steinhage, Helm, Beyer and Kleiner2018, Couston & Siegert Reference Couston and Siegert2021). For example, subglacial lakes have been shown to affect ice velocity (Stearns et al. Reference Stearns, Smith and Hamilton2008). Additionally, subglacial lakes reduce bedrock friction (Gudlaugsson et al. Reference Gudlaugsson, Humbert, Kleiner, Kohler and Andreassen2016) and increase heat transfer at the bedrock/ice interface (Pattyn et al. Reference Pattyn, Carter and Thoma2016). Subglacial lakes may portend more regional melting, having implications for subglacial hydrology and hydrogeology (Wright et al. Reference Wright, Young, Roberts, Schroeder, Bamber and Dowdeswell2012, Ashmore & Bingham Reference Ashmore and Bingham2014, Fricker et al. Reference Fricker, Siegfried, Carter and Scambos2016) that can perturb the solid Earth temperature field (Siegert et al. Reference Siegert, Kulessa, Bougamont, Christoffersen, Key and Andersen2017). In addition, subglacial lakes are also sites of extreme environments that host life, serving as an analogue of possible life on icy moons (Siegert et al. Reference Siegert, Ellis-Evans, Tranter, Mayer, Petit, Salamatin and Priscu2001, Christner et al. Reference Christner, Priscu, Achberger, Barbante, Carter and Christianson2014, Thatje et al. Reference Thatje, Brown and Hillenbrand2019).
The vast majority of known subglacial lakes have been identified using remote sensing techniques. Radio-echo sounding (RES; Siegert, Reference Siegert2000) is the most effective method for detecting subglacial lakes. RES is an indirect observation technique that relies on radio waves to penetrate the ice sheet and reflect off subglacial water bodies. Smaller lakes can be difficult to resolve using this method as they blend into the bedrock background (Magnússon et al. Reference Magnússon, Pálsson, Gudmundsson, Hőgnadóttir, Rossi and Thorsteinsson2021). Ephemeral lakes resulting from the seasonal filling and drainage of basins may not be captured by RES; instead, these active lakes are more commonly discovered using satellite altimetry via the changes in ice elevation and specific surface morphology (Gray Reference Gray2005, Fricker et al. Reference Fricker, Scambos, Bindschadler and Padman2007, Horgan et al. Reference Horgan, Anandakrishnan, Jacobel, Christianson, Alley and Heeszel2012).
Despite the discovery of numerous subglacial lakes, it is likely that many remain undiscovered (Goeller et al. Reference Goeller, Steinhage, Thoma and Grosfeld2016, MacKie et al. Reference MacKie, Schroeder, Caers, Siegfried and Scheidt2020). For comparison, Canada is ~75% of the land area of Antarctica yet has nearly 880 000 lakes, most of which are glacial (Messager et al. Reference Messager, Lehner, Grill, Nedeva and Schmitt2016). Scandinavia, although much smaller, has a similar spatial density of lakes to Canada (Messager et al. Reference Messager, Lehner, Grill, Nedeva and Schmitt2016). While an ice sheet still covers Antarctica and the bedrock remains frozen over much of the continent (maximum estimated area covered by lakes = 95%; Siegert Reference Siegert2000, Goeller et al. Reference Goeller, Steinhage, Thoma and Grosfeld2016), there are probably many more subglacial lakes beneath the Antarctic ice sheet that remain undiscovered due to the limitations presented by current detection methods (MacKie et al. Reference MacKie, Schroeder, Caers, Siegfried and Scheidt2020).
Because remote sensing techniques are unlikely to identify all existing lakes, multivariate and machine learning (ML) methods have been demonstrated to help identify favourable lake-forming environments (Rodriguez-Galiano et al. Reference Rodriguez-Galiano, Sanchez-Castillo, Chica-Olmo and Chica-Rivas2015). For example, MacKie et al. (Reference MacKie, Schroeder, Caers, Siegfried and Scheidt2020) used logistic regression trained using five environmental variables and several derivative parameters to refine estimates of locations and areas of subglacial lakes. Their results provide a minimum estimate of 0.32% of Antarctica being covered by subglacial lakes. However, this result will only be a fraction of the total area of melting at the base of the ice sheet.
In this study, we build upon these previous studies to explore seven site characteristics that contribute to the thermal state of the ice sheet to develop multivariate methods to predict the source regions and classification of subglacial lake melt sources. Our tests include comparisons between distributions of individual variables at lakes within East Antarctica, principal component analysis (PCA) and ML using the subspace K-nearest neighbour (KNN) method. From these tests, we develop three separate models of subglacial lake melt source identification that can be applied to subglacial environments.
Background
Subglacial lakes
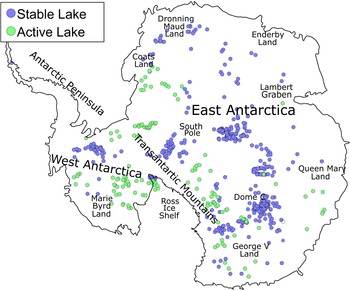
Subglacial lakes are classified as active or stable (Fig. 1), where stable lakes can be identified via RES (Oswald & Robin Reference Oswald and Robin1973, Carter et al. Reference Carter, Blankenship, Peters, Young, Holt and Morse2007, Wright & Siegert Reference Wright and Siegert2012) and active lakes can be identified via satellite observations of ice elevation (Gray Reference Gray2005). Stable subglacial lakes are believed to form when the melting point is reached under a geothermal gradient (Siegert Reference Siegert2000). With the exception of near-surface effects, the temperature increases with depth in ice (Paterson Reference Paterson1994). This increase in temperature results in the ice exceeding its pressure melting point under sufficiently thick ice, which then melts and collects in a low region to form a subglacial lake. For a typical geothermal gradient (with a surface temperature of -50°C, ice thermal conductivity of 2.3 W m-1 K-1 and basal heat flux of 40 mW m-2), the melting point is located at a depth of ~2.5 km based on simple back-of-the-envelope estimates using the heat equation, although this varies depending on regional heat flux (An et al. Reference An, Wiens, Zhao, Feng, Nyblade and Kanao2015, Martos et al. Reference Martos, Catalán, Jordan, Golynsky, Golynsky, Eagles and Vaughan2017) and local environmental factors such as surface temperature (King & Turner Reference King and Turner1997), ice velocity, mass accumulation rates (Llubes et al. Reference Llubes, Lanseau and Rémy2006) and subglacial geology (Willcocks et al. Reference Willcocks, Hasterok and Jennings2021). Active lakes (lakes where water is actively transported into or out of the lake) lead to the overlying ice sheet being raised or lowered accordingly due to ice buoyancy (Horgan et al. Reference Horgan, Anandakrishnan, Jacobel, Christianson, Alley and Heeszel2012). As these types of lakes may result from the inflow of external water sources, it is possible for lakes to form irrespective of the geothermal environment. Due to the transient nature of these lakes, active lakes can be temporary or seasonal (Lai et al. Reference Lai, Stevens, Chase, Creyts, Behn, Das and Stone2021).
Map of subglacial lake locations across Antarctica categorized into active (with active water inflows/outflows) and stable (with constant water levels). There are 535 stable lakes and 140 active lakes. Lake locations and designations are from Livingstone et al. (Reference Livingstone, Li, Rutishauser, Sanderson, Winter and Mikucki2022).

Predictive studies
Previous attempts at constructing predictive models have included those of Livingstone et al. (Reference Livingstone, Clark, Woodward and Kingslake2013) and Goeller et al. (Reference Goeller, Steinhage, Thoma and Grosfeld2016), who both used hydraulic potential to identify the drainage pathways under the Antarctic ice sheet and to locate points of pooling above the bedrock. Goeller et al. (Reference Goeller, Steinhage, Thoma and Grosfeld2016) identified 10 183 potential lake locations. Both models identified ~4–5% of the Antarctic ice sheet base to lie above a region where water can pool in the bedrock. Livingstone et al. (Reference Livingstone, Clark, Woodward and Kingslake2013) were able to reduce this percentage down to 2.7% by removing pooling locations where temperatures would be too cold for liquid water, while Goeller et al. (Reference Goeller, Steinhage, Thoma and Grosfeld2016) were able to reduce the percentage down to 0.6% by scaling the predicted lakes down to match those of known lake locations. Both of these models are highly dependent on the Bedmap2 dataset (Fretwell et al. Reference Fretwell, Pritchard, Vaughan, Bamber, Barrand and Bell2013), which has an unrealistically smooth bedrock topography due to interpolation (MacKie et al. Reference MacKie, Schroeder, Caers, Siegfried and Scheidt2020).
To address some of these issues, MacKie et al. (Reference MacKie, Schroeder, Caers, Siegfried and Scheidt2020) used ML methods to incorporate additional datasets in order to refine the number of lakes. To improve the limitations of the Bedmap2 dataset, MacKie et al. (Reference MacKie, Schroeder, Caers, Siegfried and Scheidt2020) generated a more realistic bedrock topography by simulating small-scale roughness using Fourier analysis. Derivative parameters including bedrock slope and curvature of the hydraulic potential were then incorporated into their analysis. In addition, MacKie et al. (Reference MacKie, Schroeder, Caers, Siegfried and Scheidt2020) included heat flux, ice velocity, strain, curvature of the hydraulic potential, ice-surface slope, ice thickness, flow accumulation models and distance along the ice flow path from the grounding line to form a linear regression. The estimated area covered by subglacial lakes in this study ranged from 0.32% to 0.60%. However, not all of these variables contribute meaningfully to the analysis.
We take a broader perspective, focusing not simply on lakes, but also on their source potential; that is, the base of the ice sheet that is melting and contributes to lake formation. We use the more recent and higher-resolution topography of the BedMachine model (Morlighem et al. Reference Morlighem, Rignot, Binder, Blankenship, Drews and Eagles2019) and examine several recent models of geothermal heat flux.
Datasets
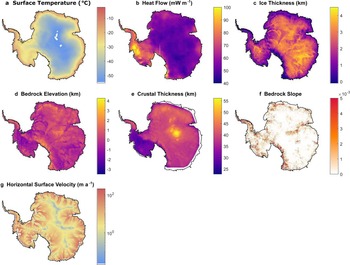
To classify the formation environment of subglacial lakes, we examine the seven site characteristics shown in Fig. 2. These parameters are chosen as direct or indirect proxies for temperature or thermal state at the ice sheet bedrock and can be easily observed/estimated. To prepare each dataset for analysis, they were projected onto Antarctic polar stereographical coordinates and interpolated into a common grid with a discretization of 10 km × 10 km.
Datasets used for developing lake melt source classification. a. Surface temperature is an averaging of multiple temperature measurements dating from 1979 to 2011 (van Wessem et al., Reference Van Wessem, Reijmer, Lenaerts, van de Berg, van den Broeke and van Meijgaard2014). b. Heat flow is an ensemble average from the following sources: Maule (Reference Maule2005), An et al. (Reference An, Wiens, Zhao, Feng, Nyblade and Kanao2015), Martos et al. (Reference Martos, Catalán, Jordan, Golynsky, Golynsky, Eagles and Vaughan2017), Shen et al. (Reference Shen, Wiens, Lloyd and Nyblade2020), Guimarães et al. (Reference Guimarães, Vieira and Hamza2020), Stål et al. (Reference Stål, Reading, Halpin and Whittaker2021). c. Ice thickness, d. bedrock elevation and f. bedrock slope have all been taken from Morlighem et al. (Reference Morlighem, Rignot, Binder, Blankenship, Drews and Eagles2019). e. Crustal thickness data are taken from Baranov et al. (Reference Baranov, Tenzer and Bagherbandi2017). g. Horizontal surface velocity data are taken from Palmer et al. (Reference Palmer, Dowdeswell, Christoffersen, Young, Blankenship and Greenbaum2013).

Surface temperature is an important boundary condition that influences the depth at which melting is reached under a positive thermal gradient. Temperature was recorded by averaging the updated Regional Atmospheric Climate Model (RACMO2) over a 32 year period (1979–2011; van Wessem et al. Reference Van Wessem, Reijmer, Lenaerts, van de Berg, van den Broeke and van Meijgaard2014). In Antarctica, the estimated surface temperature ranges from -5°C to -60°C, with the former being closer to the melting point of the ice. Therefore, we expect that subglacial lakes are more likely to exist in regions with warmer surface temperatures.
Basal temperatures of the ice sheet are influenced by the solid Earth geothermal gradient (Paterson Reference Paterson1994). Because there are relatively few direct estimates of Antarctic geothermal heat flux, we average six published geophysical proxy-based estimates of heat flux. We do this by interpolating all six models into the same 10 km × 10 km grid used for all other samples and then finding the mean heat flux in each cell. This ensemble heat flux map may improve the accuracy of the average by reinforcing heat flux estimates where they agree and averaging out large contrasting anomalies where the models agree poorly (Supplemental Appendix). These models include a satellite-based magnetic Curie depth model (Maule Reference Maule2005), a shear-wave tomography model (An et al. Reference An, Wiens, Zhao, Feng, Nyblade and Kanao2015), a Curie airborne-based magnetic model (Martos et al. Reference Martos, Catalán, Jordan, Golynsky, Golynsky, Eagles and Vaughan2017), an interpolated model based on current core heat flux measurements (Guimarães et al. Reference Guimarães, Vieira and Hamza2020) and two empirical seismic similarity models (Shen et al. Reference Shen, Wiens, Lloyd and Nyblade2020, Stål et al. Reference Stål, Reading, Halpin and Whittaker2021).
Although the heat flux is proportional to the thermal gradient, the absolute temperature at depth is critical for melting. Therefore, the thickness of the ice is also an important site characteristic to consider. For ice thickness, we use the BedMachine model (Morlighem et al. Reference Morlighem, Rignot, Binder, Blankenship, Drews and Eagles2019), which is higher resolution than the earlier Bedmap2 dataset (Fretwell et al. Reference Fretwell, Pritchard, Vaughan, Bamber, Barrand and Bell2013). While the depth at which melting will occur differs from region to region, we expect many areas of thick ice to have lake melt sources due to the vast depth causing even the lowest thermal gradients to reach the melting point of ice.
Large-scale elevation variations can be sensitive to tectonic activity and/or reflect thermal gradients in the lithosphere beneath (Hasterok & Chapman Reference Hasterok and Chapman2011, An et al. Reference An, Wiens, Zhao, Feng, Nyblade and Kanao2015, Hasterok & Gard Reference Hasterok and Gard2016). Although the ice represents a relatively uniform cover in the interior, bedrock elevation may help identify hidden thermal contributions to lithospheric buoyancy. The link between elevation and thermal structure can be made complicated by variations in compositional buoyancy (lateral variations in crustal thickness and rock density). Furthermore, we do not expect to find lake melt sources in regions of the highest topography, as the surface ice is often too thin and/or the surface temperatures are too cold for a sufficient gradient to create a lake melt source in these environments. We use the BedMachine model (Morlighem et al. Reference Morlighem, Rignot, Binder, Blankenship, Drews and Eagles2019) as the bedrock elevation model.
Crustal thickness can also be used as a proxy for tectonically active/stable regions, and it reflects total radiogenic heat flux (Hasterok & Webb Reference Hasterok and Webb2017, Goes et al. Reference Goes, Hasterok, Schutt and Klőcking2020). We acknowledge that the link between crustal thickness and the lithospheric thermal state can be tenuous, especially at the global scale (Mareschal & Jaupart Reference Mareschal and Jaupart2013), but there are good reasons to suspect that it may be a reasonable assumption for beneath Antarctica. First, the Cenozoic West Antarctic Rift has a thin crust and an estimated high geothermal heat flux (Behrendt Reference Behrendt1999, Jordan et al. Reference Jordan, Riley and Siddoway2020). The older East Antarctica has a thicker crust and lower geothermal heat flux (Krynauw Reference Krynauw1996). Second, the mantle has approximately an order of magnitude lower concentrations of heat-producing elements than the crust, so a thick crust may lead to higher radiogenic heat flux. We use the crustal thickness model of Baranov et al. (Reference Baranov, Tenzer and Bagherbandi2017), which has a grid spacing of 10 km × 10 km.
Furthermore, we will examine the topographical bedrock slope around lakes, as some models predict that topography can focus heat flux into valleys and away from peaks (van der Veen et al. Reference Van der Veen, Leftwich, von Frese, Csatho and Li2007). If correct, we would expect to see lake melt sources in areas of extreme topographical changes due to the amplification these cause in local heat flux at the base of valleys where lakes would not normally form (Palmer et al. Reference Palmer, Dowdeswell, Christoffersen, Young, Blankenship and Greenbaum2013). We define the topographical bedrock slope as the magnitude of the change in bedrock elevation using Equation 1:
 $$R = \sqrt {{\left({\displaystyle{{\partial z} \over {\partial x}}} \right)}^2 + {\left({\displaystyle{{\partial z} \over {\partial y}}} \right)}^2} $$
with respect to the slope in orthogonal directions.
Llubes et al. (Reference Llubes, Lanseau and Rémy2006) demonstrated how ice velocity in both the horizontal and vertical directions directly influences thermal profiles via advection dissipation and basal friction. As measuring velocity throughout the ice is impractical, we use surface velocity as a proxy for the underlying velocity value in the glaciers (Wolff & Doake Reference Wolff and Doake1986) as well as the thermal effects it applies. The surface velocity of the ice in the horizontal direction is taken from Rignot (Reference Rignot2019). As there is a high correlation between horizontal and vertical velocities, we used horizontal surface velocity as a proxy for velocity in both directions.
Complex physical processes can make it difficult to directly link these thermally sensitive proxies to temperature. Thus, the use of multidimensional methods can potentially reveal patterns between proxies that simpler analyses cannot.
Methods
We explore three techniques to characterize the environments associated with subglacial lakes: 1) comparative analysis, which is the simplest and least rigorous, 2) PCA, which is a multivariate method, and 3) ML methods, which are the most sophisticated methods, although offering less clear causal connections between observations and predictions.
Comparative analysis
When examining environmental parameters individually, specific parameters are expected to be identified as critical to an ideal lake melt source. We compared the distribution of lake parameters (both active and stable) against the whole of Antarctica with a resolution of 10 km × 10 km. Comparisons are made both visually and using the two-sample Kolmogorov-Smirnov (KS) statistic. Low KS values suggest similar distributions and therefore little influence of the environmental variable on lake melt source formation. High KS values indicate greater differences between the distributions and may indicate an influence of the environmental variable on lake melt source formation or as a possible predictor of lake occurrence (Maguire et al. Reference Maguire, Schmerr, Pettit, Riverman, Gardner and Della-Giustina2021).
Principal component analysis
PCA is a multidimensional method that determines a set of linear basis vectors that can be used to discriminate data. We use it in order to examine the source of variance in the data and to separate Antarctic regions based on the likelihood of finding active lake melt sources, stable lake melt sources or no melt sources at all. We perform a PCA to account for the fact that no single environmental variable can describe an ideal lake melt source environment. It is also used as a precondition to reduce noise in some of the ML experiments.
There are significant variations in the magnitudes and ranges of each of the variables with respect to each other, which can make it more difficult to resolve the sources of variance. To account for this, we centre and normalize all parameters using Equation 2:
 $$\hat{x}_i = \displaystyle{{x_i-{\bar{x}}_i} \over {\sigma _{x_i}}}$$
where xi is the observed data, x̄i is the mean and σxi is the standard deviation. Rather than use x̄i and σxi from the lakes, we use the parameters calculated from the Antarctic grids to perform the PCA analysis. This choice gives us a series of values for each of the lake parameters standardized in relation to Antarctica as a whole. It also ensures that as the database of lakes grows, the PCA vectors need not change. Using these unitless variables, we conduct a PCA on the normalized parameters to create a set of eigenvectors and eigenvalues for our principal axes. We then compare the scores of lakes with those of East Antarctica to identify regions with high potential for lake melt sources.
Machine learning methods
The third set of tests for lake melt source classification employs ML methods computed using the MATLAB ® ML classifier MLC application (MATLAB 2020). The classifier takes a set of identified multivariate data points (also referred to as training data) and applies multiple ML algorithms to the data variables in order to create a prediction function that can identify unidentified data points from their input variables. All tests were performed using 10% cross-validation to reduce the likelihood of overfitting. Tests were performed with and without PCA preconditioning, but it was found that this did not make a significant difference to accuracy and therefore it was not included in the preferred classifier. The resulting prediction function uses the training data to test its accuracy according to the number of correct classifications it makes. Unlike the previous two methods, the MLC has multiple methods at its disposal, which we use to find methods that accurately identify environments with lake melt source probabilities.
A null lake class (i.e. no lake present) is required to train the MLC to identify regions without lakes. Although we have a database of lake locations, there is no validated null lake dataset (i.e. locations without lakes). Therefore, we randomly assign several Antarctic locations as proxies for a null class (i.e. no lake present), with the only restriction being a minimum proximity to currently known lake locations. While randomly picking points can be a tenuous method for creating a null class (an undiscovered lake can be incorrectly assigned a null class), staying far away from known existing lakes is a simple and independent criterion that seems logically reasonable. Several tests were conducted by varying the minimum allowable distance from null points to known lakes. An optimal threshold of 200 km was determined for the null proxy cells (Supplemental Appendix). To prevent oversampling, 675 null proxy cells (the same as the number of subglacial lakes) were used for training.
We initially began by testing the training data against all 24 of the available classifiers using default settings to identify the most promising methods from their accuracy (see Supplemental Table 1). The best-performing methods were explored more thoroughly, testing a range of tuning parameters (see Supplemental Appendix). The subspace KNN method was found to deliver the highest percentage of correct classifications, and therefore this was used create our preferred classifier model. The subspace KNN model is an ensemble learner where KNN classifications are made using multiple subsets of the environmental properties. The classification is predicted via the majority response from the ensemble of predictions. To access the probability score for each class, we reverted to the command-line versions of the classification codes.
Results
Comparative analysis
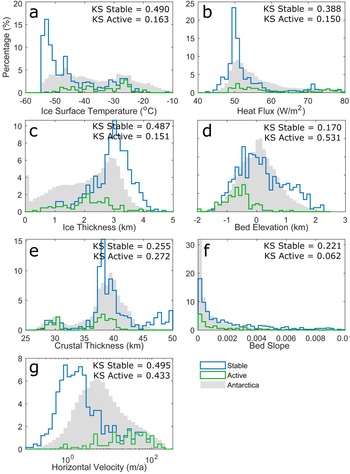
Surface temperature is one of the most distinct parameters when comparing lakes with Antarctica as a whole (Fig. 3). The estimated annual average surface temperatures for Antarctica range from -55°C to -10°C, with a relatively uniform distribution (Fig. 3a). Stable lakes are more common in regions with low surface temperatures, generally < -40°C, whereas active lakes are more common at warmer temperatures. The KS statistic for stable lakes is 0.490 and for active lakes is 0.163, indicating a greater difference between stable lakes and Antarctica than between active lakes and Antarctica.
Comparison of Antarctic and lake distributions for key environmental parameters: a. Ice-surface temperature; b. heat flux; c. ice thickness; d. bedrock elevation; e. crustal thickness; f. bedrock slope; g. horizontal ice velocity. Antarctica datasets have been resampled to a common 10 km × 10 km grid. The Antarctic datasets have been normalized to a percentage of the entire continent; lakes have been normalized to the total number of lakes (both active and stable). The Kolmogorov-Smirnov (KS) statistics are computed between the cumulative distributions of lakes distinguished by type and the Antarctic continent. Larger KS values indicate a greater difference between the distributions.

Both Antarctica and subglacial lakes skew towards lower basal heat flux values, with both peaking at ~50 mW m-2 (Fig. 3b). Although Antarctica has a long, smooth tail for high estimated heat flux values, stable lakes noticeably drop at > 57.5 mW m-2. The one exception is a small cluster of lakes at ~75 mW m-2. These high heat flux-related lakes are in regions of West Antarctic (Fig. 1) that experienced Cenozoic rifting (Schroeder et al. Reference Schroeder, Blankenship, Young and Quartini2014).
A large difference between Antarctic and stable lake distributions is found with ice thickness (Fig. 3c). Antarctic ice thickness values are relatively uniformly distributed, ranging from 0 to 4 km. However, lakes rarely occur beneath ice thinner than 1 km, and stable lakes generally skew strongly towards regions with thick ice (> 2.8 km). The peak in the lake distribution occurs at slightly higher than 3 km of ice, resulting in a KS statistic of 0.487 relative to the Antarctic continent. Active lakes are found beneath a wider range of ice-thickness values, from < 500 m to nearly 4 km. This distribution more closely reflects that of East Antarctica, with a KS statistic of 0.151.
The elevation of the Antarctic bedrock generates a relatively smooth normal distribution ranging from -2 to 2 km (Fig. 3d). In general, lakes are biased towards lower-elevation regions. Although stable lakes have a similar distribution to Antarctica as a whole, active lakes are biased towards lower values. The skew towards lower values is relatively minor for stable lakes, resulting in a KS statistic of 0.170. In contrast, active lakes are strongly skewed towards lower elevations, resulting in a high KS statistic of 0.531.
The bimodal crustal thickness distribution of Antarctica is reflected in active but not stable subglacial lakes (Fig. 3e). Active lakes exhibit the same bimodal nature, as they are found in both East and West Antarctica, whereas the vast majority of stable lakes are found in regions with the thickest crust (i.e. East Antarctica, > 37 km). This result is unsurprising given the geographical distribution of the identified lakes (Fig. 1) and the well-known East-West dichotomy of the continent (e.g. Baranov et al. Reference Baranov, Tenzer and Bagherbandi2017). Despite the lack of stable lakes above thin crust in East Antarctica, the KS values are reasonably similar for both types of subglacial lakes because the thin crust includes a relatively small area of Antarctica.
Bedrock slope is the least dissimilar environmental parameter between East Antarctica and its lakes. Both lakes and Antarctica as a whole skew towards topographically flat (Fig. 3f). Out of the seven parameters, bedrock slope demonstrates the least distinct difference between active and stable lakes. Bedrock slope is a poor factor for determining the ideal lake environment, which is consistent with Willcocks et al. (Reference Willcocks, Hasterok and Jennings2021), who showed how the topographical effect of local heat flux is probably the opposite of that theorized by van der Veen et al. (Reference Van der Veen, Leftwich, von Frese, Csatho and Li2007).
The surface-ice velocity of the Antarctic ice sheet peaks at 1–4 m year-1 (Fig. 3g). Neither active nor stable lakes are distributed in regions similar to East Antarctica. In a clear difference between stable and active lakes, stable lakes are skewed towards regions with slow-moving ice, whereas active lakes are skewed towards regions of fast-moving ice. The regions of slow velocities have high vertical advection, which depresses the thermal gradient, carrying colder temperatures down to the base of the ice sheet (Mony et al. Reference Mony, Roberts and Halpin2020). Thus, stable lakes can only form under regions of sufficiently thick ice where temperatures can reach the melting point of ice along these depressed thermal gradients. Active lakes, however, tend to form in regions where the ice is flowing rapidly, indicating that they are not the product of the geothermal gradient. The KS statistic is relatively high for both types of lakes: 0.495 for stable lakes and 0.433 for active lakes.
Principal component analysis
The PCA indicates relatively similar variances between five of the seven normalized and centred variables (Table 1). Horizontal velocity accounts for the largest variance (~29%), whereas bedrock slope accounts for 2% of the total variance. Because the variance contributed by bedrock slope is very small, we exclude it from the remainder of the PCAs. Excluding bedrock slope results in relatively minor changes to the basis functions and does not affect interpretations based on the results.
Variance in the environmental parameters associated with Antarctic subglacial lakes as well as their percentage of the total share of the variance. Most variance is found in the horizontal ice velocity, whose variance makes up over a quarter of the total variance. Bedrock slope makes up the least of the variance, at < 1.5% of the total.

Note: We have taken the log of horizontal ice velocity to account for the orders of magnitude difference between the maximum and minimum values.
The first three principal components account for > 90% of the total variance (Table II). The first principal component explains nearly 63% of the variance in the data. The analysis identifies crustal thickness and bedrock elevation as the most important variables, contributing to a positive score. On the negative side, horizontal velocity, surface temperature and heat flux are important. For the second principal component, ice thickness contributes to a negative score, whereas all other variables trend towards positive values.
Basis vectors determined from the principal component (PC) analysis of subglacial lakes and their explained variance. We can see that almost 63% of variance is held within PC1 and > 93% of the variance is contained within the first three PCs.

Note: We have taken the log of horizontal ice velocity to account for the orders of magnitude difference between the maximum and minimum values.
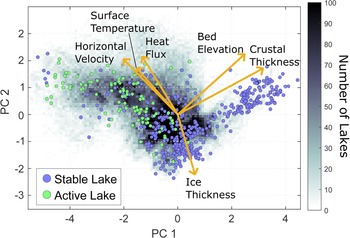
For the first two principal components, the projection of the basis vectors is quite simple, which makes it relatively straightforward to interpret the variance of the scores. The basis vectors fall into three groups: 1) bedrock elevation and crustal thickness, 2) surface temperature, geothermal heat flux and horizontal velocity and 3) ice thickness. An increase in group 1 vectors increases PC1 and PC2 scores. An increase in group 2 vectors increases PC1 and decreases PC2 scores. An increase in group 3 vectors has little influence on PC1 scores while strongly contributing to negative PC2 scores (Fig. 4).
Map of lake scores in the first two principal component (PC) axes overlying a heat map of the scores of a 10 km × 10 km terrestrial Antarctic grid. Scores are computed from the sum of the products of the centred and normalized environmental parameters with their associated principal vector components. Also shown are the projections of the environmental vector components illustrating the relative importance of each parameter to the score assigned to a location.

Unfortunately, the similarity between the distributions of the lake scores and the Antarctic grid prevents us from accurately predicting a lake melt source from the PCA results (Fig. 4). However, it is possible to discriminate between stable and active lakes and the regions they are most likely to be found from the PCA score. Stable lakes tend to have positive PC1 scores and/or negative PC2 scores, whereas active lakes tend to have negative PC1 scores and less negative PC2 scores. Stable lakes tend to follow the group 1 and 3 axes, whereas active lakes tend to project along the group 2 axes. While there are several stable lakes with negative PC1 scores (generally PC1 < -1), only two active lakes have a positive PC1 score. The stable vs active lake tendencies towards positive and negative PC1 scores, respectively, provide a means to classify regions as favourable for either type of lake.
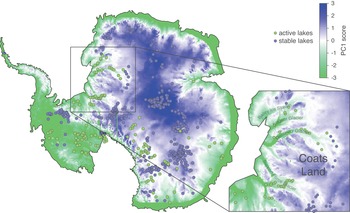
A map of PC1 scores illustrates the correspondence between PC1 scores and subglacial lake locations (Fig. 5). PC1 scores are generally positive in East Antarctica, except along the coast and within ice streams. PC1 scores are generally negative in West Antarctica and along the coast. This result is reflective of the general East-West dichotomy within Antarctica: thicker crust and higher bedrock elevation in the East and higher heat flux and surface temperatures in the West. The PC1 map shows good correspondence to the locations of lakes, even resolving the difference in classes at reasonably fine resolution in some regions (e.g. Coats Land).
The scores of each Antarctic cell along the first principal component (PC) axis, thus showing where active lakes are likely to form (green areas) over stable ones (blue areas). A larger-scale view of PC1 is also shown, illustrating the accuracy of predicted lake types of the region in the black box along with ice stream names.

Subspace KNN classifier
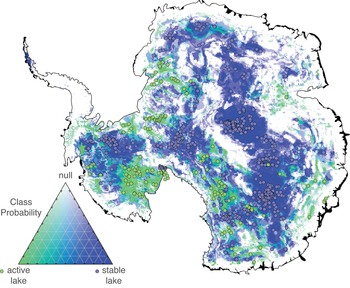
Our preferred subspace KNN classifier uses seven learners with four dimensions to generate the prediction function. The preferred model was determined by training classifiers to a range of learners and dimensions (Supplemental Appendix). The ideal model parameters were chosen according to a kink in the L-curve of the classification error rate. Model performance relative to each class was evaluated using multiple metrics computed from the confusion matrix (Table III). Across the three classes, the subspace KNN model resulted in precision > 73%, with the highest precision of 92% being obtained for stable lakes. Sensitivity is another metric of accuracy. Approximately 90% of stable lakes and null cells were correctly identified by the subspace KNN model. However, only 58% of active lakes were correctly identified by the model. Most incorrectly identified true lakes were misclassified as null. However, many of the misclassified lakes lie just outside of regions classified with high lake probabilities (Fig. 6). Perhaps the relatively low grid resolution of the environmental parameters plays some role in this accuracy.
Location of stable (blue) and active (green) lake melt sources classified by a machine learning classifier as having a high or low probability based of the six parameters identified in this paper. The classifier was created using a training dataset of 140 active and 535 stable Antarctic subglacial lakes parameters combined with 675 Antarctic null cell parameters. Null cells were identified based on them being > 200 km away from any currently observed lake.

Performance of the preferred classifier (seven learners, four dimensions). The confusion matrix reports the true and predicted classes following model training. Also shown are the percentages correct/total and incorrect/total in each respective row and column.

Visually, the predicted lake class map shows good spatial correspondence between lakes and class probability (Fig. 6). The ML model identifies the regions running from Dome C across central East Antarctica, around the South Pole and Pine Island Glacier as having high probabilities for stable lakes. High probabilities of active lakes are found in Marie Byrd Land, west of the Transantarctic Mountains and south of Mount Erebus and in the ice streams in Coats Land. Because of our colour scale, only null regions with very high probability null classes (> 90%) are clearly null (white). These regions tend to be relatively large and continuous and far from lakes. However, there also exist many regions with more moderate probabilities of a null class, which must contain misclassified lakes. We used a simple majority to determine the class; however, raising the threshold for null determination would reduce the number of lakes being classified as null.
Discussion
We find that multivariate methods provide valuable insights into the types of environments associated with source regions for subglacial lakes. While a comparative analysis is able to show unique trends in the distribution of lake properties compared to the Antarctic background, it can only be used in a qualitative way. Thus, to develop a reasonable map of subglacial melt sources and the types of lakes they fill, multivariate methods are required.
The comparative analysis is able to identify biases in the types of environments conducive to lake formation (Fig. 3). Only horizontal velocity shows clear differences between both lake types and Antarctica, although in opposite ways. Stable lakes tend to be found in regions of low-velocity ice, whereas active lakes are more common in regions of fast-moving ice. MacKie et al. (Reference MacKie, Schroeder, Caers, Siegfried and Scheidt2020) also identified a similar distinction in horizontal velocity correlation coefficients between the two types of lakes. Stable lakes tend to reside in regions with ice thicker than 2500 m (not the 3500 m identified by Pattyn et al. Reference Pattyn, Carter and Thoma2016), low surface temperatures and low heat flows. It is probable that the low heat flow increases the thickness of ice. This combination of properties is consistent with the geographical location of the most stable lakes in the interior of East Antarctica. In contrast, active lakes are found in regions with low bedrock elevation and high surface ice velocities, which are more commonly found in West Antarctica and along coastal ice streams. Bell et al. (Reference Bell, Studinger, Shuman, Fahnestock and Joughin2007) had previously made similar observations about active lakes found in ice streams. The lack of clear differences in heat flux, surface temperature and ice thickness suggests that active lakes may not have strongly thermal origins. Instead, active lakes form by melting elsewhere, which is subsequently transported to the lake locations. The low accuracy of the subspace KNN method for active lakes is probably related to our choice of environmental datasets that reflect the thermal conditions of the ice sheet. A different set of datasets may be required to improve the performance of ML methods when looking for active lakes.
The PCA provides a means to quantitatively map the multivariate distribution of properties that contribute to stable and active lakes (Fig. 5). The first principal component is the most significant for identifying lake types. The results are highly accurate in regions where both active and stable lakes are in close proximity, as is demonstrated for Coats Land (Fig. 5 inset). Although regions with high second principal component scores (> 1.8) are generally regions without lakes, most of the null randomized cells show little differences in their distributions compared to lakes (Supplemental Fig. 2b). These regions correspond to the Antarctic Peninsula and the Transantarctic Mountains. Hence, the PCA may only poorly identify regions where melt is unlikely.
ML can refine the predictions of lake types and melt source regions and can provide the means to assess confidence in such predictions. For example, the subspace KNN classifier is able to correctly classify regions where PCA poorly classifies stable lakes in West Antarctica (Fig. 6). By adding null locations, it identifies regions where melting is unlikely. Because the null cells are random and only based on a minimum proximity to known lakes, there is the potential that some of the null cells could still be regions of melting. However, the distribution of null regions is considerably greater than the area where the randomized null points are located, many of which have no null training points (Fig. 6 & Supplemental Fig. 2a).
Similarly to MacKie et al. (Reference MacKie, Schroeder, Caers, Siegfried and Scheidt2020), we find that the bedrock slope adds very little useful information for identifying lakes and potential melt sources. While other environmental properties have clear biases in lake distributions, bedrock slope does not (Fig. 3g). We initially ran ML models with bedrock slope, but we found that this did not produce significant improvements in the classification models. Therefore, we excluded bedrock slope from our preferred models. Previous studies included hydraulic potential (Livingstone et al. Reference Livingstone, Clark, Woodward and Kingslake2013, Goeller et al. Reference Goeller, Steinhage, Thoma and Grosfeld2016, MacKie et al. Reference MacKie, Schroeder, Caers, Siegfried and Scheidt2020), which may improve the precise prediction of lakes rather than melt regions. However, the large error in bedrock elevation (up to ± 1000 km in some locations; Morlighem et al. Reference Morlighem, Rignot, Binder, Blankenship, Drews and Eagles2019) can undermine the utility of using bedrock slope for predictions. Additionally, MacKie et al. (Reference MacKie, Schroeder, Caers, Siegfried and Scheidt2020) found a very low correlation between bedrock slope and lake probability predictions, further suggesting its limited contribution. It is more probable that the addition of distance along flow paths and a water routing algorithm would result in the differences in probability between the model in MacKie et al. (Reference MacKie, Schroeder, Caers, Siegfried and Scheidt2020) and our own.
The probabilities predicted for lake locations by MacKie et al. (Reference MacKie, Schroeder, Caers, Siegfried and Scheidt2020) are generally much lower than ours. Again, this difference is probably due to their addition of a water routing model and their attempt to precisely locate lakes rather than to identify potential source regions. However, there are some key differences that arise from other choices. Our model predicts a gap in central East Antarctica that is devoid of lakes (Fig. 6), whereas MacKie et al. (Reference MacKie, Schroeder, Caers, Siegfried and Scheidt2020) predicted no such gap. This difference probably arises due to our method for introducing null cells. It remains to be seen whether our method is valid. Another clear difference between our model and that of MacKie et al. (Reference MacKie, Schroeder, Caers, Siegfried and Scheidt2020) is situated beneath Pine Island Glacier in West Antarctica, where there are several stable lakes (Fig. 6). These lakes were included in the lake database at the time when MacKie et al. (Reference MacKie, Schroeder, Caers, Siegfried and Scheidt2020) trained their model. While MacKie et al. (Reference MacKie, Schroeder, Caers, Siegfried and Scheidt2020) did suggest there being a very slight probability (< 0.001) of such lakes existing beneath this region, our model suggests a much higher likelihood of this.
A number of new heat flux models of the Antarctic continent have been produced in the past few years. Current models can have a wide variety of values for the basal geothermal heat flux of Antarctica (Shen et al. Reference Shen, Wiens, Lloyd and Nyblade2020). MacKie et al. (Reference MacKie, Schroeder, Caers, Siegfried and Scheidt2020) included a global seismic tomography-based heat flux model by Shapiro & Ritzwoller (Reference Shapiro and Ritzwoller2004) and two magnetic Curie depth-derived heat flux models (Maule Reference Maule2005, Martos et al. Reference Martos, Catalán, Jordan, Golynsky, Golynsky, Eagles and Vaughan2017). The global tomography model is too low resolution to be very useful, so it is excluded from our study. We include several more recent heat flux models in our analysis in addition to the two magnetic-based models, including the continent-wide seismic tomography-based model by An et al. (Reference An, Wiens, Zhao, Feng, Nyblade and Kanao2015), two statistical-based models by Shen et al. (Reference Shen, Wiens, Lloyd and Nyblade2020) and Stål et al. (Reference Stål, Reading, Halpin and Whittaker2021) and a thermal-based model by Guimarães et al. (Reference Guimarães, Vieira and Hamza2020).
Our preferred model uses the ensemble heat flux model; however, we produced a subspace KNN map for each heat flux model separately. We find that the ensemble model gives results with the highest accuracy, although admittedly the variations in accuracy range from 86% to 91% (Supplemental Fig. 3d). Because an ensemble model averages out differences and amplifies agreement between models, it will often produce a better estimate of the true field. Hence, the best result is obtained using the ensemble heat flux.
When compared individually, the recent statistical-based models (which we believe are presently the most accurate estimates of heat flux) do not perform as well as the magnetic-based models. We hesitate to speculate as to why this may be so because there are clear issues with the magnetic models. For example, heat flux in some large regions of West Antarctica is estimated to be > 150 mW m-2 (Maule Reference Maule2005, Martos et al. Reference Martos, Catalán, Jordan, Golynsky, Golynsky, Eagles and Vaughan2017), whereas heat fluxes > 120 mW m-2 would cause regional melting of the middle to lower crust (Hasterok & Chapman Reference Hasterok and Chapman2011). Furthermore, the Curie depth models are highly sensitive to the initial depth estimates (Gard & Hasterok Reference Gard and Hasterok2021). In order to produce the predicted low heat flux in cratonic East Antarctica and higher heat flow in the Cretaceous West Antarctic Rift, the crustal thickness in West Antarctica was arbitrarily halved to produce the initial Curie depth (Maule Reference Maule2005, Martos et al. Reference Martos, Catalán, Jordan, Golynsky, Golynsky, Eagles and Vaughan2017). Thus, the Curie depth-based heat flux estimates may have biases introduced that make them less accurate. However, none of the heat flux models perform well when compared with conjugate terranes in Australia, India and Africa (Pollett et al. Reference Pollett, Hasterok, Raimondo, Halpin, Hand, Bendall and McLaren2019).
Regardless of the heat flux model used to train the lake classifier, the results are generally similar (Supplemental Fig. 4). The largest differences occur in West Antarctica, although even there the models share broad agreement of there being no lakes on the Antarctic Peninsula, stable lakes in the vicinity of Pine Island Glacier and active lakes in Marie Byrd Land. Another region of some difference appears beneath Victoria Land to the west of the Transantarctic Mountains.
Given the large variations in heat flux models, there is probably still some significant improvement that can be made in the future. Some of the discrepancies between heat flux models result from differences in the sensitivity of the geophysical fields to temperature as opposed to other factors such as composition. However, a significant fraction of the differences are probably due to uncertainties regarding the physical properties of the crust that are poorly constrained (Pollett et al. Reference Pollett, Hasterok, Raimondo, Halpin, Hand, Bendall and McLaren2019). Physical property uncertainties also affect statistically based methods, as they tend to resort to average behaviour rather than accurately capturing the range and wavelength of spatial variations (Shen et al. Reference Shen, Wiens, Lloyd and Nyblade2020). Therefore, improving heat flux models requires better estimates of heat production and thermal conductivity variations both laterally and vertically within the crust. It may be possible to improve physical property estimates using empirical relationships between thermal properties and geophysical proxies such as crustal seismic velocity or density (Hasterok & Webb Reference Hasterok and Webb2017, Hasterok et al. Reference Hasterok, Gard and Webb2018, Jennings et al. Reference Jennings, Hasterok and Payne2019). Near-surface variations in thermal conductivity can also cause refractive effects that are not incorporated into geophysical proxy-based heat flux estimates (Willcocks et al. Reference Willcocks, Hasterok and Jennings2021). Incorporating these estimates will require models of subglacial geology, specifically the location of geological contacts, which could be developed from a combination of gravity and aeromagnetic observations.
Conclusion
Multivariate methods have the potential to improve our understanding of subglacial lake distributions and their source regions. Using a combination of comparative analysis, PCA and the ML methods, we find that stable lakes are more likely to occur in regions with thick ice and low geothermal heat flux, while active lakes lie in regions with fast ice concentrated in coastal ice streams and West Antarctica. PCA is able to distinguish between the environments that typically form active lakes compared to stable lakes, but it cannot identify regions that are unlikely to contain lakes. ML methods can improve the prediction of lake types, as well as identify regions without lakes. The subspace KNN method was found to be the most accurate ML method for this purpose. Producing more accurate maps that identify ideal subglacial lake melt sources requires improved resolution of environmental characteristics. Such maps will also benefit from improved heat flux estimates that incorporate sub-ice geology to predict thermal properties.
Acknowledgements
The authors would like to thank the editor, Cliff Atkins, and two anonymous reviewers for constructive comments that significantly improved this manuscript.
Financial support
SW is supported by the Australian Government Research Training Program Scholarship. DH is supported by the Australian Government through the Australian Research Council's Discovery Projects funding scheme (project DP180104074).
Supplemental material
To view supplementary material for this article, please visit https://doi.org/10.1017/S0954102023000032.