Introduction
Mastitis in dairy cattle is a challenging and costly disease for the dairy industry. Consequently, the majority of dairy producers have management strategies in place to control mastitis. In Denmark such a strategic tool is based on bacteriological culturing of milk samples (pathogen information) taken from cows with clinical mastitis (CM) or subclinical mastitis (SCM). Pathogen information is primarily used not only to choose the appropriate treatment but also for on-farm monitoring of specific pathogens and subsequent planning of preventive measures in the dairy herd. Nonetheless, even with effective strategies in place, mastitis remains the most consequential and costly disease in Danish dairy herds with an average treatment frequency of 0.33 per cow per year (Martin, Reference Martin2007).
In the long term, mastitis in dairy cattle may to some extent be controlled through breeding by altering the natural resistance of the population against mastitis-causing organisms. Production of more resistant animals through genetic modification is possible (Wall et al., Reference Wall, Powell, Paape, Kerr, Bannerman, Pursel, Wells, Talbot and Hawk2005), but this may only provide resistance against one species or even strain of bacteria and may not be considered ethical. In contrast, improved resistance obtained through genetic selection is permanent, may be non-specific, and results in cows that are less susceptible to udder infections.
In Denmark, Finland and Sweden, breeding values for udder health are predicted using direct information on treatments of mastitis and indirect information from somatic cell score, fore udder attachment, udder depth and dairy form (Johansson et al., Reference Johansson, Eriksson, Pôsô, Toivonen, Nielsen, Eriksson and Aamand2006). Information on treatments of mastitis consists of four distinct traits: treatments of mastitis from (1) −15 to 50 days after calving in first parity; (2) 51 to 300 days after calving in first parity; (3) −15 to 150 days after calving in second parity and (4) −15 to 150 days after calving in third parity. The reason for using only 150 days in second and third parities is two-fold: (1) to avoid problems with censored data due to culling and (2) to get information faster for prediction of breeding values. Each trait does not distinguish between different pathogens causing mastitis. Furthermore, each trait is binary as only the first incidence in a period is considered. The four mastitis traits are all characterized by a low heritability (h 2 = 0.024 to 0.034) when analyzed as continuous traits using a linear model (Johansson et al., Reference Johansson, Eriksson, Pôsô, Toivonen, Nielsen, Eriksson and Aamand2006).
Potentially, pathogen information may be an extra source of information for prediction of breeding values for udder health in dairy cattle because it is a direct measure of udder infections and of the disease-causing pathogen. If more information is available, the response to selection for better resistance to mastitis may become greater. However, standard procedures for submitting cows to bacteriological testing and culturing of milk samples do not exist in Denmark. Thus, recorded pathogen information may lead to biased (i.e. sampling bias) or less-precise inferences if sampling occurs in a non-random matter. Despite this, pathogen information may still be useful in an animal breeding context as suggested by a number of studies. Nash et al. (Reference Nash, Rogers, Cooper, Hargrove, Keown and Hansen2000) estimated pathogen-specific heritabilities for mastitis using data from 1860 cows. They found heritabilities (s.e.) of 0.03 (0.002), 0.25 (0.01) and 0.19 (0.005) on the observable binary scale using a linear model for coagulase-negative staphylococci (CNS), streptococci other than Streptococcus agalactiae and coliform species, respectively. In contrast, De Haas et al. (Reference De Haas, Barkema and Veerkamp2002a) and Schafberg et al. (Reference Schafberg, Rosner and Swalve2006) found only indications of pathogen-specific heritabilities on the underlying continuous scale due to large uncertainty of the heritability estimates. They used data from 28 695 and 786 cows, respectively. De Haas et al. (Reference De Haas, Barkema and Veerkamp2002a) reported estimated heritabilities (s.e.) of 0.05 (0.02), 0.10 (0.06), 0.06 (0.03), 0.05 (0.03) and 0.04 (0.04) for Staphylococcus aureus, CNS, Escherichia coli, Streptococcus dysgalactiae and Streptococcus uberis, respectively. Schafberg et al. (Reference Schafberg, Rosner and Swalve2006) estimated heritabilities (s.d.) of 0.093 (0.048) and 0.068 (0.052) for CNS and S. aureus, respectively. To our knowledge, no studies have estimated genetic correlations among different pathogen-specific mastitis traits. These estimates are essential for determining whether mastitis caused by different pathogens should be considered as different traits.
Phenotypically, lactation curves for somatic cell count (SCC) around the time of infection were found to reflect the pathogen causing the infection as deviations from a normal SCC lactation curve estimated from cows without mastitis (De Haas et al., Reference De Haas, Barkema and Veerkamp2002b). Moreover, it is likely that different genes control resistance to different pathogens. In a study by Sørensen et al. (Reference Sørensen, Guldbrandtsen, Thomasen and Lund2008) it was found that quantitative trait loci (QTL) affecting the genetic value for general resistance towards mastitis to some degree increased resistance to specific pathogens.
Common for the studies investigating pathogen-specific heritabilities of mastitis is a relatively low number of observations from a few herds resulting in considerable uncertainty about the genetic parameters. Also, in some cases inappropriate models have been used for analysis of binary data (e.g. Nash et al., Reference Nash, Rogers, Cooper, Hargrove, Keown and Hansen2000; De Haas et al., Reference De Haas, Barkema and Veerkamp2002a). In this study a more suitable threshold model was used to analyze mastitis data from the Danish Holstein population including pathogen information collected nationwide from 1998 to 2006. We hypothesized that the heritability of mastitis in Danish Holstein cattle depends on the pathogen causing the infection (i.e. heritability is pathogen-specific) and that the genetic correlations among pathogen-specific mastitis traits are less than unity (i.e. pathogen-specific mastitis traits may be considered as different traits). Hence, the objectives of this study were: (1) to estimate genetic variation and heritability of pathogen-specific mastitis using field data of Danish Holsteins, and (2) to estimate genetic correlations among pathogen-specific mastitis traits caused by different pathogens.
Material and methods
Data and edits
Records of mastitis treatments (both CM and SCM) were extracted from the Danish National Cattle Database. Only records from first parity Holstein cows that had calved between January 1998 and October 2006 were included in the analysis, because the amount of pathogen information was relatively sparse before 1998 (approximately 13% of total). Additionally, age at first calving was required to be between 19 and 36 months (at least 572 days and at most 1084 days of age), and herds should have at least 30 first calvings per year. The latter was chosen for the following reasons: (1) to avoid problems with extreme category problems during analysis (e.g. Moreno et al., Reference Moreno, Sorensen, García-Cortés, Varona and Altarriba1997), (2) so that genetic parameters should better represent presumed future herd size and (3) to reduce the amount of data to a manageable size for analyses. Only records from −15 to 300 days after calving (period at risk) were included and cows with calving date less than 300 days from the end of the collection period were removed from the data set to reduce bias due to data censoring.
In Denmark, cows with mastitis are treated by veterinarians or farmers with a special health agreement, which permits the farmers to treat animals themselves for certain diseases such as mastitis. These persons are also responsible for reporting treatments of mastitis to the national cattle database. However, not all veterinarians and farmers do this on a regular basis. This implies that not all herds can be considered as having reliable disease recording. Requirements for active participating in disease recording were as follows. Considering sliding windows of 9 months, each herd should have at least 10 calvings and at least 0.3 treatments per calving in each 9-month interval. These summaries were done separately for each calving month. Treatments were combined in four main categories: udder diseases, reproductive diseases, digestive diseases, and foot and leg diseases. For example, if the requirements were fulfilled in the interval January–September but not February–October, only records from January were included (Nielsen et al., Reference Nielsen, Aamand and Mark2000). These requirements are currently used for prediction of breeding values for disease traits in Denmark, Finland and Sweden and are assumed to reduce bias due to inadequate reporting of disease treatments.
Pathogen information was extracted from the database. The date entered in the database for pathogen information may have been either the day of sampling or the day of recording of pathogen information into the national database. These dates may not be the same and may not be the date the cow actually was treated for mastitis. 76.8% of all bacteriological samples were recorded −3 to 4 days after the recording date of mastitis treatments (56.2% on the same day) when requirements for calving age, data censoring and period at risk (−15 to 300 days after calving) had been fulfilled. Hence, this interval was chosen for merging pathogen information and mastitis treatments. In a few cases (10%) more than one and up to four different pathogens were recorded from the same cow on the same date. This may indicate that samples have been collected from all four quarters (the database did not contain information on single quarters). In these cases it was assumed that the number of treated quarters resembled the number of identified pathogens as the presence of a pathogen is equivalent to an infection, unless the milk sample was contaminated. Finally, to ensure a certain amount of pathogen information, only herds that have pathogen information for at least 50% of the registered mastitis cases every year of disease recording were considered.
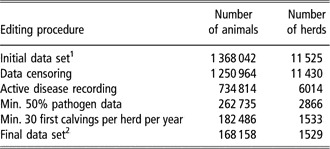
From the original 1 475 222 first lactations records from 11 525 herds, 168 158 cows were included in the analyses. The cows were distributed in 1529 herds, 17 calving-age subclasses (average calving age = 27 months), 96 year-month subclasses and descended from 5871 sires with an average of 28.6 daughters per sire, ranging from 1 to 10 913. Effects of major editing steps are shown in Table 1.
Numbers of animals and herds after major editing steps

1After requirements for calving age have been fulfilled.
2After removal of animals with unknown sire.
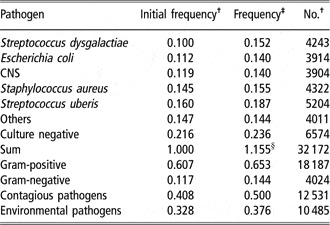
The mean frequency of unspecific mastitis in the final data set was 0.23 per first lactation (n = 38 770 cows). Following the restriction on the amount of pathogen information (pathogen information on minimum 50% of mastitis treatments within herd), the frequency of cases of mastitis with pathogen information was 0.72 per first lactation (72% of 23%). The incidences of the different pathogens are given in Table 2. The frequency of animals not completing a full lactation was 17.2%. Among these animals 67.9% were slaughtered, 17.3% were sold to other herds, 14.6% died in the herd and 0.2% were exported to other countries. The share of culled cows was slightly higher for animals with mastitis, 19.1% v. 16.6% for animals without mastitis. The mean length of period at risk was 292.2 days.
Distribution of pathogens from data used in this study and in the initial unedited data set with pathogen information

CNS = coagulase-negative staphylococci.
The total number of mastitis cases with pathogen information was 27 859.
†In the unedited data set without considering mastitis treatments.
‡In the edited data used for genetic inferences. Frequency of mastitis cases caused by the different pathogens.
§The sum of the pathogen-specific frequencies does not add to one in the final data set because in several cases more than one pathogen was found for the same case of mastitis.
Statistical models and analyses
Data were analyzed with a threshold model (Wright, Reference Wright1934) using a full Bayesian approach implemented by the Gibbs sampling. This approach takes the binary nature of the data into account. The five most common bacteria (S. dysgalactiae, E. coli, CNS, S. aureus and S. uberis) in the Danish dairy herds were chosen for analysis of pathogen-specific mastitis. The pathogen-specific mastitis traits were differentiated from unspecific mastitis by distinguishing between mastitis with and without pathogen information. The trait unspecific mastitis contained all recorded treatments of mastitis (i.e. both treatments with and without growth of pathogens).
The threshold model assumes the presence of an underlying continuous random variable called liability, λ. The relationship between the observed binary variable y and the unobservable λ is
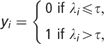
where τ is a fixed threshold and yi = 1 and 0 correspond to the presence or absence of mastitis for observation i, respectively. It is assumed that λ is normally distributed with mean vector μ and covariance matrix  . Because the threshold and
 were unknown, they were set to the arbitrary values τ=0 and
 such that

The probability (πi) that observation i is scored as 1 given the model parameter vector, θ, is
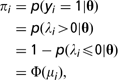
where Φ(.) is the standard normal cumulative distribution function.
For both unspecific and pathogen-specific mastitis, the following sire model was used to describe liability to mastitis:

where  is the liability to mastitis of daughter m of sire l calving in year–month class i at calving-age class j and herd–year–season class k, YMi is the ‘fixed’ effect of year–month of calving, AGEj is the ‘fixed’ effect of calving age, hysk is the random effect of herd–year–season, sirel is the transmitting ability of sire l, b is the ‘fixed’ regression coefficient of λ on the length of the period at risk, tijkl is the period at risk for daughter m of sire l, defined as the number of days from 15 days before calving to the date of culling or to the end of the risk period. It was assumed that all cows with mastitis had a completed risk period. Following Heringstad et al. (Reference Heringstad, Rekaya, Gianola, Klemetsdal and Weigel2001), this should eliminate the recursive relationship between mastitis and the length of the risk period and eijklm is the residual~N(0,1) and independent.
In matrix notation the model is

where λ is an n−1 vector of the underlying liabilities of mastitis, b is a vector of ‘fixed’ effects of order p, h is a vector of random herd–year–season effects of order q, s is a vector of sire effects of order r and e is a vector of residual effects. Xb, Xh and Z are corresponding incidence matrices.
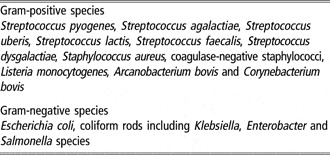
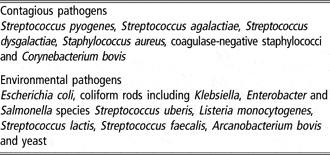
Heritabilities for both unspecific and pathogen-specific mastitis traits on the underlying continuous scale were estimated using univariate models. Genetic correlations between the different traits were estimated by pair-wise bivariate analysis of pathogen-specific mastitis traits. Additionally, mastitis caused by Gram-positive bacteria was analyzed together with mastitis caused by Gram-negative bacteria (Table 3) for estimation of genetic parameters of and between these two major groups. Also, contagious pathogens were analyzed together with environmental pathogens. Categorizing pathogens into these two groups is not straightforward as a few pathogens show characteristics from both groups. For example, S. uberis is known for its ubiquitous environmental nature (e.g. Hillerton and Berry, Reference Hillerton and Berry2003), but within-cow and between-cow transmissions have also been observed for a limited number of S. uberis strains. Also, CNS and S. dysgalactiae seem to share characteristics from both groups. In the present study, S. uberis was considered an environmental pathogen whereas CNS and S. dysgalactiae were considered as contagious pathogens (Table 4). This categorization was primarily based on current knowledge and experience from Danish dairy farms (Danish Agricultural Advisory Service, 2003). Genetic correlations between unspecific mastitis and the pathogen-specific mastitis traits were not estimated due to the part–whole relationship between the traits. The Bayesian implementation is described for the bivariate model only, but is similar for the univariate model.
Differentiation of bacterial species recorded in the Danish National Cattle Database after bacteriological analyses of milk samples into Gram-positive and Gram-negative species

Differentiation of pathogens recorded in the Danish National Cattle Database into contagious and environmental pathogens

In matrix notation the bivariate models can be expressed as
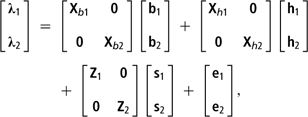
where components for each trait were the same as for the univariate model. The variance components of the bivariate model were
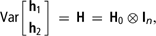
where  and In is an identity matrix of order (n) equal to the total number of records for both traits and ⊗ defines the Kronecker product
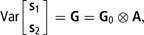
where  and A is the additive genetic relationship matrix containing the relation between sires. Relationships among sires were traced back as far as possible (i.e. 1 to 8 generations)
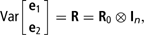
where  .
A full Bayesian approach via the Gibbs sampling implemented in the DMU package (Madsen and Jensen, Reference Madsen and Jensen2006) was used to fit the models and analyze data. Conditionally on θ the distribution of the observed binary data was assumed to be the product of n independent Bernoulli trials with conditional probability distribution:

where  and
 ,
 and z′ are the ith row vector of Xb, Xh and Z.
Adopted prior distributions of the parameters of the bivariate model were






In (2) to (7) MVN[.,.] is the multivariate normal distribution. IWj[.,.] is the j–j scaled inverse Wishart distribution where j = 2 is the dimension of the herd and genetic covariance matrices H0 and G0, respectively. CIWj is the conditional scaled inverse Wishart distribution of dimension j = 2 equal to the dimension of R0 given the residual variance for the liability to mastitis.  are known scale parameters (prior values) and degrees of freedom for the IW (degrees of belief) for herd–year–season, additive genetic and residual covariances, respectively. Prior values were 0.026 for the additive genetic variance, 0.065 for the herd–year–season variance, 1.0 for the residual variance and zero for all covariances. Degrees of belief were chosen to represent vague a priori information (
 ). The residual covariance matrix was sampled using the approach of Korsgaard et al. (Reference Korsgaard, Andersen, Madsen and Ødegaard2005). This approach combines the findings of Korsgaard et al. (Reference Korsgaard, Lund, Sorensen, Gianola, Madsen and Jensen2003) and González (Reference González2004) and allows for non-zero residual covariances among binary traits.
Finally the joint posterior density of all unknowns was given as the product of the densities in (1) to (6):

The joint posterior density in (8) was augmented with the unknown liabilities λi (Tanner and Wong, Reference Tanner and Wong1987). The conditional posterior distributions of the model parameters were normal for the location parameters, scaled inverted Wishart for the sire and herd–year–season variance, and truncated normal for the liabilities.
Convergence diagnostics
Convergence of the Gibbs chain was determined using a standardized time series method of batch means (Glynn and Iglehart, Reference Glynn and Iglehart1990; Geyer, Reference Geyer1992). The chain of length r was divided into s batches of equal size. Then the batch means

converge to independent, identically distributed normal random variables. Convergence of the batch means was then checked by standard one-way analysis of variance and by estimating the lag correlation between batch means. The effective sample size (ESS) was calculated as ESS = V w/V B, where V w is the variance within batches and V B is the variance between batches. The information criterion was set to ESS ⩾ 100. The Gibbs sampler was run as a single long chain and every tenth sample was saved for post-Gibbs analyses. Mixing properties of the bivariate analyses were poorer than for the univariate analyses; thus the burn-in was longer for the bivariate analyses (Table 5).
Details of the performed analyses including model, traits, chain-length and burn-in

†No. of samples.
Heritability and weighted means
Heritabilities of both unspecific and pathogen-specific mastitis were calculated as
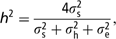
where  is the sire variance,
 is the herd variance and
 is the residual variance.
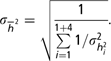
Weighted means of heritabilities of pathogen-specific mastitis were calculated using estimates from both uni- (n = 1) and bivariate (n = 4) analyses for each trait. The weighted means were calculated as

where  is the variance obtained from the posterior distribution of heritabilities, and the standard deviations of the weighted means were calculated as
Results
Heritabilities
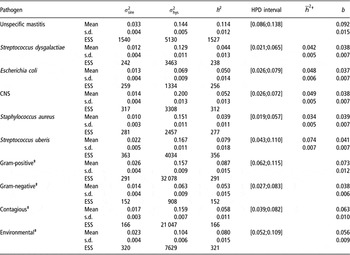
Summary statistics of variance components and heritabilities from the univariate analyses of the underlying liability to unspecific and pathogen-specific mastitis are given in Table 6. Also, the weighted heritabilities are shown to summarize the results from uni- and bivariate analyses. The posterior distributions of heritabilities were similar for both uni- and bivariate analyses. The posterior distributions of heritabilities were all symmetric and therefore are not shown.
Mean, standard deviation (s.d.) and effective sample size (ESS) of the posterior distributions of sire ( ) and herd–year–season (
 ) variances and heritability (h 2) of liability to unspecific and pathogen-specific mastitis from univariate analyses, 95% highest posterior density (HPD) interval (in brackets), weighted heritability (
 ) and regression coefficient (b) of the period at risk from the univariate analysis

CNS = coagulase-negative staphylococci.
†Weighted average of univariate (n = 1) and bivariate (n = 5) analyses.
‡Only results from bivariate analysis.
The heritabilities of pathogen-specific mastitis (Table 6) were in all cases lower than the heritability of unspecific mastitis, but different from zero. The lowest heritability was found for mastitis caused by S. uberis (s.d.),  , and the highest heritability was found for mastitis caused by S. uberis (s.d.),
 The heritabilities of mastitis caused by S. dysgalactiae, E. coli and CNS were of the same magnitude,
 = 0.044 0.049 and 0.051, respectively. The posterior mean of the heritability of mastitis caused by Gram-positive bacteria was higher than the heritability of mastitis caused by Gram-negative bacteria, 0.087 and 0.053, respectively. Finally, the posterior mean of the heritability of environmental pathogens was higher than the heritability of contagious pathogens.
The posterior standard deviations of the heritability estimates were low because of the large number of observations in this study. Although the heritability of S. uberis mastitis was 2.2 times higher than that for S. aureus mastitis, the heritabilities of the pathogen-specific mastitis traits did not differ significantly from each other as all 95% highest posterior density (HPD) intervals overlapped. Despite the number of mastitis cases caused by specific pathogens (Table 2) being much lower than the total number of mastitis treatments (n = 38 770), the 95% HPD interval of the heritabilities was not larger for the pathogen-specific traits.
Genetic and residual correlations
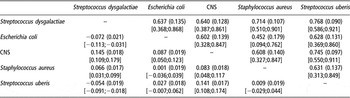
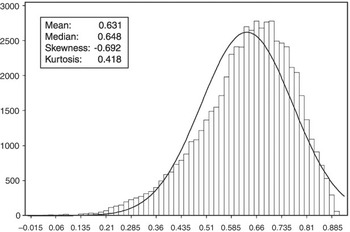
Posterior means of the additive genetic correlations among pathogen-specific mastitis traits are given in Table 7. The posterior distributions of the genetic correlations were in all cases slightly left-skewed (Figure 1). Genetic correlations among different pathogen-specific mastitis traits were all significantly less than one, positive and moderate to high (0.45 to 0.77). Thus, the five pathogen-specific traits can supposedly be considered as different traits, and the genetic basis for mastitis resistance depends on the disease-causing pathogen. The posterior mean of the genetic correlation (s.d.) between Gram-positive and Gram-negative bacteria was 0.73 (0.09), and between environmental and contagious pathogens it was 0.83 (0.06). In general, the 95% HPD intervals were large, but different from unity, so caution should be taken when interpreting the results.
Posterior means of genetic (above diagonal) and residual (below diagonal) correlations (s.d.) among different pathogen-specific mastitis traits and 95% highest posterior density (HPD) intervals (in brackets)

CNS = coagulase-negative staphylococci.
Posterior distribution of genetic correlation between Staphylococcus aureus and Streptococcus uberis is shown as an example. Genetic correlation on the X-axis and counts on the Y-axis. The remaining plots of posterior genetic correlations were of similar shape. Skewness ranged from −0.952 to −0.487 and kurtosis ranged from −0.044 to 1.305.

The residual correlations among the pathogen-specific traits were different from zero in a few cases only; between S. aureus and S. dysgalactiae, between S. aureus and CNS, and between S. uberis and CNS.
Regression coefficients for days at risk
The b-value (Table 6) for the period at risk for unspecific mastitis was slightly positive, b = 0.092. The b-values for pathogen-specific mastitis were lower than for unspecific mastitis but different from zero and of similar magnitudes, b = 0.038 to 0.041. The b-value for mastitis caused by Gram-positive pathogens was twice as large as the b-value for mastitis caused by Gram-negative pathogens, b = 0.073 and 0.038, respectively. Finally, b-values for mastitis caused by environmental and contagious pathogens were similar, 0.056 and 0.063, respectively.
Discussion
The estimated heritability (weighted) of unspecific mastitis,  = 0.109, in this study was similar to previously published results in Holsteins, which ranged from h 2 = 0.099 to 0.124 on the underlying continuous scale (Lund et al., Reference Lund, Jensen and Petersen1999; Kadarmideen et al., Reference Kadarmideen, Rekaya and Gianola2001) but high compared with results from other dairy breeds; e.g. Heringstad et al. (Reference Heringstad, Rekaya, Gianola, Klemetsdal and Weigel2001) who estimated a heritability of 0.074 in Norwegian Cattle using a similar model.
The heritabilities of the pathogen-specific mastitis traits were in all cases lower than the heritability of unspecific mastitis. The reason for the lower heritability of pathogen-specific mastitis is two-fold: (1) the sire variance was 1.5 to 3.3 times lower for the pathogen-specific mastitis traits compared to unspecific mastitis (Table 6), and (2) it considered the variance of unspecific mastitis as the sum of all elements of the covariance matrix of n pathogen-specific mastitis traits (X), i.e. Var as the pathogen-specific mastitis traits are correlated. The heritability will be higher if the residual covariances are low relative to the covariances for the effects of sire and herd–year–season. Because no covariances exist between traits in estimation of heritability for the pathogen-specific mastitis traits, a low residual covariance will not counteract a larger relation between the additive genetic and phenotypic variance, and therefore the heritabilities will be lower for the pathogen-specific mastitis traits compared to the heritability of unspecific mastitis.
Also, in this study we did not have pathogen information for all observed cases of unspecific mastitis, which implies that the true incidence (unknown) of each pathogen may be higher than the incidences given in the present study (Table 2). Thus, the pathogen-specific heritabilities presented (Table 6) may be biased.
The estimates of heritability of S. aureus mastitis given by Schafberg et al. (Reference Schafberg, Rosner and Swalve2006) and De Haas et al. (Reference De Haas, Barkema and Veerkamp2002a) were consistent with the heritability,  , estimated in the present study when taking the uncertainty in those studies into account. However, in the study by De Haas et al. (Reference De Haas, Barkema and Veerkamp2002a), a logistic regression model was used, which may make the results from that study less comparable. The posterior mean of the heritability,
 , of CNS mastitis was consistent with the estimate given by Schafberg et al. (Reference Schafberg, Rosner and Swalve2006) who also used a threshold model and a Bayesian approach. In the study by De Haas et al. (Reference De Haas, Barkema and Veerkamp2002a), the heritability of CNS was higher, but it may be biased by a low incidence rate. The heritabilities estimated for S. dysgalactiae and E. coli mastitis,
 and 0.048, respectively, in the present study were similar to the estimates given by De Haas et al. (Reference De Haas, Barkema and Veerkamp2002a). The heritability of S. uberis was high in this study compared to the other pathogens. However, the result was not consistent with the estimate given by De Haas et al. (Reference De Haas, Barkema and Veerkamp2002a) where the heritability of S. uberis mastitis did not differ from zero. The posterior mean of the heritability of mastitis caused by Gram-positive pathogens was higher than the heritability of mastitis caused by Gram-negative pathogens. Pooling of pathogens into these two groups may be seen as a compromise between considering unspecific mastitis and considering the pathogen-specific mastitis traits as done in the present study since: (1) the two groups pool information from a total of 18 groups of pathogens instead of five, (2) fewer traits to evaluate and (3) higher incidences per trait. The pathogens were also pooled into groups of environmental and contagious pathogens. However, grouping of pathogens such as S. uberis, CNS and S. dysgalactiae is not straightforward as these pathogens share characteristics from both groups. Depending on the production system, country, etc., these pathogens may be placed in either group. In the present study the pathogens were grouped according to current knowledge from the Danish cattle population. Allocating these pathogens to another group would change the heritabilities of the two groups. Another possibility could be to place these pathogens in a third ‘mixed’ group.
Genetic correlations
The posterior means of the genetic correlations among the different pathogen-specific mastitis traits ranged from 0.45 to 0.77 (Table 7). This implies that all the pathogen-specific mastitis traits can be considered as different traits. The lowest genetic correlation (0.45) was found between mastitis caused by S. aureus and E. coli. This is consistent with results from immunological studies. For example, Bannerman et al. (Reference Bannerman, Paape, Lee, Zhao, Hope and Rainard2004a) found that S. aureus and E. coli elicit differential innate immune responses as well as systemic responses (i.e. fewer). Increases in interleukin-8 and tumor necrosis factor alpha were only observed in quarters infected with E. coli. Also, differences in concentrations of the component cleavage product C5a and interleukin-10 were observed at different time points for the two pathogens. This indicates that expression of genes controlling the release of immune factors (i.e. cytokines) may differ for different pathogens. SCC patterns (results of different cytokine patterns) have been found to differ between infections caused by E. coli and S. aureus (De Haas et al., Reference De Haas, Barkema and Veerkamp2002b). This provides further evidence for differing immune response to these pathogens.
Bannerman et al. (Reference Bannerman, Paape, Lee, Zhao, Hope and Rainard2004a and Reference Bannerman, Paape, Goff, Kimura, Lippolis and Hope2004b) provide evidence for differentials in immune responses to Gram-positive and Gram-negative bacteria. However, Bannerman et al. (Reference Bannerman, Paape, Lee, Zhao, Hope and Rainard2004b) also showed that immune responses to different Gram-positive bacteria are highly variable. S. uberis induces production of cytokines (interleukin-8, tumor necrosis factor alpha and interleukin-1β), which were completely absent after infection with S. aureus (Riollet et al., Reference Riollet, Rainard and Poutrel2000). This may explain why the genetic correlation between E. coli and S. uberis (0.63) is larger than the genetic correlation between E. coli and S. aureus (0.45).
In general, interpretation of the genetic correlations among the different pathogen-specific traits is difficult. To our knowledge, immune responses have not been compared for all the pathogens used in this study. However, it seems like the genetic correlations were highest when the bacteria were more alike. For example, the highest correlation (0.77) was found between S. dysgalactiae and S. uberis, which both belong to the same genus. Furthermore, S. dysgalactiae and S. aureus share some characteristics; for example they are both known to invade mammary epithelial cell and thereby cause chronic infections (Almeida et al., Reference Almeida, Matthews, Cifrian, Guidry and Oliver1996; Calvinho et al., Reference Calvinho, Almeida and Oliver1998). This may be the reason for the high genetic correlation (0.71) between these two pathogens, which indicates that mammary immune responses to these pathogens share some characteristics. The genetic correlations between E. coli (Gram-negative) and other pathogens were generally lower than the genetic correlations between the remaining four pathogens (Gram-positive), indicating different immune response to these two groups. However, this contradicts the result of the genetic correlation (0.73) between Gram-positive and Gram-negative bacteria found in this study.
The genetic correlation between environmental and contagious pathogens was high (0.83). This fairly large value may reflect similarities between pathogens in the two groups and difficulties with categorization of pathogens such as S. uberis, CNS and S. dysgalactiae. Allocating these pathogens to a different group would without doubt change the genetic parameters. More specific identification of the different strains of each pathogen could help in placing these pathogens in the correct group. However, currently the bacteriological test used at the veterinary practices is not specific enough for this purpose.
Regression coefficient for days at risk
The relationship between the liability to mastitis and the length of the period at risk is recursive. In the present study we used the method described in Heringstad et al. (Reference Heringstad, Rekaya, Gianola, Klemetsdal and Weigel2001) for inclusion of the length of the period at risk; it was assumed that all cows treated for mastitis had a completed period at risk (315 days), thus eliminating the recursive relationship. However, the value of the regression coefficient is positive by construction using this method because of the large number of full lactations, and the relationship between liability to mastitis and the length of the period at risk may not be linear throughout the lactation; i.e. most cases of mastitis happen in the first 50 days after calving. Using the results from this study, it can be concluded that the risk of infection with Gram-positive pathogens was always higher than the risk of infection with Gram-negative pathogens regardless of days at risk, simply because Gram-positive pathogens were far more present. Regarding contagious and environmental pathogens, the risk of infection was the same. In the present study exclusion of the regression coefficient for days at risk did not affect the posterior means of the variance components. However, it may have an effect of predictive abilities of the model.
Implications
Genetic evaluation of udder health in dairy cattle based on pathogen-specific mastitis traits in contrast to a non-specific mastitis trait may be beneficial because pathogen-specific mastitis is a direct measure of udder infections, but most important because the economic values of mastitis caused by different pathogens may be different. Also, if the heritabilities of different pathogen-specific mastitis traits were specific, this would further increase the advantage of using pathogen-specific mastitis traits. Non-specific mastitis also contains cases where no growth of bacteria has been detected or recorded, thereby including non-informative data in the prediction of breeding values. However, one drawback is the low heritability of the pathogen-specific mastitis traits.
In Denmark the cost for mastitis caused by contagious pathogens has been estimated to be €483 per case, while mastitis caused by pathogens of environmental origin has been estimated to be €272 per case using a detailed stochastic simulation model at herd level with updated prices (Østergaard et al., Reference Østergaard, Chagunda, Friggens, Bennedsgaard and Klaas2005; S. Østergaard, personal communication). This indicates that more economic weight should be put on mastitis caused by pathogens of contagious origin compared to mastitis caused by pathogens of environmental origin, which is possible only when pathogen-specific breeding values are available. Use of an udder health index including pathogen-specific mastitis traits is likely to give a higher economic response than the current index. However, this has to be verified using simulation or selection index calculations with appropriate economic weights for the concerned production system. Furthermore, it is important to assess economic values of each single pathogen because grouping into environmental and contagious pathogen is non-trivial. Finally, it is a disadvantage that pathogen information is not available for all recorded cases of mastitis. One solution to this problem could be to define an average economic value based on pathogen frequencies for these non-specific cases to be used in a selection index together with pathogen-specific mastitis traits.
Data recording should preferably be improved. At present, mastitis treatments and pathogen information are not recorded together, which make merging of mastitis treatments and pathogen information problematic. Also general options as, e.g. ‘mastitis’, should be removed from the reporting schemes; instead it should only be possible to report mastitis treatments in categories depending on severity (acute, mild, subclinical, etc.). From May 2008 it has been possible to report mastitis treatments and pathogen information on quarter level in Denmark, which makes it easier to deal with cases where more than one pathogen has been observed per treatment. However, the biggest challenge is to encourage farmers and veterinarians to report all treatments of diseases and to take samples for bacteriological analysis from all cows suspected to suffer from mastitis.
Conclusions
The posterior mean of heritabilities on the underlying continuous scale for pathogen-specific mastitis (0.035–0.076) was lower than that for unspecific mastitis (0.109), but could not be considered pathogen-specific as the different pathogen-specific heritabilities did not differ from each other. The genetic correlations among pathogen-specific mastitis traits ranged between 0.45 and 0.77, indicating that the pathogen-specific mastitis traits should be considered as different traits. The heritabilities of groups of pathogens were higher than the pathogen-specific heritabilities but lower than the heritability of unspecific mastitis. The genetic correlations tended to be lower for bacteria that induce different mammary immune responses than those for bacteria that induce more similar immune responses. Results from the present study indicate that it could be beneficial to replace mastitis treatments in the current Nordic udder health index with an index consisting of several pathogen-specific mastitis traits, especially as the economic values of mastitis caused by different pathogens differ.
Acknowledgment
Data for this study were kindly provided by the Danish Cattle Federation, Udkaersvej 15, DK-8200 Aarhus N.