Introduction
In recent years, obesity and overweight have been considered an epidemic and described as a global crisis that requires urgent action (Schwartz & Brownell, Reference Schwartz and Brownell2007). Despite the efforts of health authorities around the world, the trend of obesity continues to grow and the Centers for Disease and Control has stated that obesity is overtaking smoking as a cause of avoidable deaths (CDC, 2004). The increased incidence of obesity has only recently been recognized as a public health issue (WHO, 2000; NCHS, 2000; Hardy et al., Reference Hardy, Harrell and Bell2004; US Department of Health and Human Services, 2007), and research has confirmed Hippocrates' (470–377 BC) hypothesis that people with body fat above the ideal for their morphology have a higher predisposition to disease and tend to die earlier. Studies on obesity have shown it to be linked to a wide range of problems with the respiratory system (Shepard, Reference Shepard1992; Gennuso et al., Reference Gennnuso, Epstein, Paluch and Cerny1998; Reichmuth et al., Reference Reichmuth, Austin, Skatrud and Young2005; Seicean et al., Reference Seicean, Kirchner, Gottlieb, Punjabi, Resnick and Sanders2008), heart (Strauss et al., Reference Strauss, Barlow and Dietz2000; Baker et al., Reference Baker, Olsen and Sorensen2007; Bibbinns-Domingo et al., Reference Bibbins-Domingo, Coxson, Pletcher, Lightwood and Goldman2007), joints (Cicuttini et al., Reference Ciccuttini, Baker, Hart and Spector1996; Goulding et al., Reference Goulding, Jones, Taylor, Williams and Manning2001; Jenkins, Reference Jenkins2004) and liver (Stampfer et al., Reference Stampfer, Maclure, Colditz, Manson and Willet1992; Khare et al., Reference Khare, Everhart, Maurer and Hill1995; Strauss et al., Reference Strauss, Barlow and Dietz2000), and to metabolic problems (Gidding, Reference Gidding2001; Thorpe et al., Reference Thorpe, Debora, Marx, May, Helgerson and Frieden2004), among others.
However, the negative effects of obesity are not only associated with pathological health conditions. The consequences of obesity can be felt in areas as diverse as academic performance (Falkner et al., Reference Falkner, Neumark-Sztainer, Story, Jeffrey, Beuhring and Resnick2001; Gutiérrez-Fisac et al., Reference Gutiérrez-Fisac, Regidor, Banegas and Artalejo2002; Datar et al., Reference Datar, Sturm and Magnabosco2004; Taras & Potts-Datema, Reference Taras and Potts-Datema2005), self-esteem (Deckelbaum & Williams, Reference Deckelbaum and Williams2001; Ackard et al., Reference Ackard, Neumark-Sztainer, Story and Perry2003; Barrigas et al., Reference Barrigas, Fragoso, Vieira, Fragoso, Carnide and Vieira2007; Reference Barrigas, Fragoso, Vieira, Hume and Stewart2009), social discrimination (Janssen et al., Reference Janssen, Wendy, Boyce and Picket2004; Mahoney et al., Reference Mahoney, Lord and Carryl2005) or even the acquisition of risk behaviours (Strauss, Reference Strauss2000).
Although some studies have shown the existence of an inverse relationship between obesity and intelligence (Li, Reference Li1995; Li et al., Reference Li, Dai, Jackson and Zhang2008) or academic performance (Canning & Mayer, Reference Canning and Mayer1967; Mo-Suwan et al., Reference Mo-Suwan, Lebel, Puetpaiboon and Junjana1999; Falkner et al., Reference Falkner, Neumark-Sztainer, Story, Jeffrey, Beuhring and Resnick2001; Gutiérrez-Fisac et al., Reference Gutiérrez-Fisac, Regidor, Banegas and Artalejo2002; NYC Vital Signs, 2009), others have shown that obesity in adolescence is associated with maturity (Deutsch et al., Reference Deutsch, Mueller and Malina1985; Demerath et al., Reference Demerath, Jones, Hawley, Norris, Pettifor and Duren2009), whilst others have concluded that socioeconomic status influences either obesity or academic performance (Sobal & Stunkard, Reference Sobal and Stunkard1989; Jeffery & French, Reference Jeffery and French1996; Ball et al., Reference Ball, Crawford and Kenardy2004). However, the authors are not aware of any study that analysed simultaneously morphological characteristics, reasoning ability, socioeconomic status and, in particularly bone maturity, in order to understand the complex reality that involves academic performance. This paper intends to verify whether academic performance and reasoning ability are associated with obesity and to determine whether chronological age, maturity and socioeconomic status interfere with this association.
Methods
The sample was composed of 792 children aged between 6 and 12 years – 394 boys and 398 girls – who were all students in the first six grades of eight schools in Lisbon.
The academic performance of the students from the first four grades was obtained from the average evaluation of their performance in Portuguese, Mathematics and Sciences, as assigned by a questionnaire filled in by their teachers, and also from the results of assessment tests in the same subjects. The academic performance of the students in the 5th and 6th grades was obtained from the average of the school test results in these three subjects obtained at the end of the second term. These were carried out by year and subject by a team of expert teachers. The small number of participants with very low educational attainment (results below 49%) were put into class 1 (unsatisfactory results). The remaining students were grouped into the following classes: class 2, satisfactory results (50% to 74%); class 3, good results (75% to 84%); and class 4, very good results (85% to 100%).
Reasoning ability was assessed using Raven's Coloured Progressive Matrices Test (RCPM; Raven, Reference Raven1963; Raven et al., Reference Raven, Raven and Court2003). The participants were grouped into five classes. Classes 1, 2, 3, 4 and 5 included students with reasoning ability results lower than the 10th percentile, between the 10th and 50th percentile, between the 50th and 75th, between the 75th and 90th percentile, and higher than the 90th percentile, respectively.
Socioeconomic status (SES) was calculated using parents' occupation and literacy, and home location and characteristics as indicators. These were scored according to the Graffar Scale (Graffar, Reference Graffar1958) and participants were grouped into five social classes. Due to the small number of participants in the lower classes all the children in the Graffar lower class and lower middle class were combined into a single class called ‘lower class’ or ‘class 1’, while the others were grouped into middle class (class 2), upper middle class (class 3) and high class (class 4).
The maturity indicator was obtained from the difference between chronological age and bone age obtained using the TW3 method (Tanner et al., Reference Tanner, Healy, Godstein and Cameron2001).
The sum of skinfolds was obtained through the sum of triceps and subscapular skinfolds. Body mass index (BMI) was calculated according to Cole's cut-off points for children (Cole et al., Reference Cole, Bellizzi, Flegal and Dietz2000, Reference Cole, Flegal, Nicholls and Jackson2007). As there were only a small number of participants in thinness classes 1, 2 and 3, these were combined into a single class called ‘thin’, or class 1, while the remaining children were classed as normal weight (class 2), overweight (class 3) or obese (class 4). These anthropometric measures were collected according to the ISAK (International Society for the Advancement of Kinanthropometry) procedures (Marfell-Jones et al., Reference Marfell-Jones, Olds, Stuart and Carter2006).
The data were processed using the program PASW 18.0. Descriptive statistics were performed using the mean and standard deviation. A t-test was used to assess differences between variables. Analysis of variance (one-way ANOVA) was used to ascertain whether there were differences between groups of data in academic performance and in reasoning ability. Analysis of covariance (univariate ANCOVA), using chronological age, socioeconomic status and maturity as covariates, was used to evaluate the influence of these variables on academic performance; and with socioeconomic status and maturity as covariates, it was used to evaluate the influence of these variables on reasoning ability. Level of significance was set at p≤0.05.
This study complies with the requirements of the Helsinki Declaration and was approved by the Ethics Committee of the Faculty of Human Kinetics, Technical University of Lisbon. The objectives and procedures of the study were explained to parents and only those children whose legal guardians had signed an informed consent were included in the sample.
Results
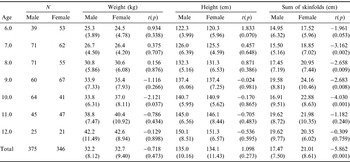
Table 1 presents the means, standard deviations and p-values between boys and girls (results of t-test and significance level) for weight, height and sum of skinfolds by chronological age. Girls were found to be heavier than boys at 10 years of age (p=0.037), but no significant differences in height were found at any age. For sum of skinfold thicknesses, however, girls had higher values than boys in all age ranges except at 11 and 12 years (p=0.053, 0.002, 0.009, 0.008 and 0.001, respectively, for 6, 7, 8, 9 and 10 years of age and for total sample).
Weight, height and sum of skinfolds by chronological age and gender, means (SD)

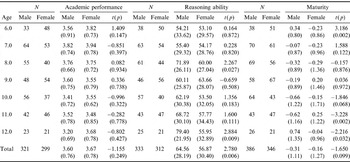
Table 2 presents the means, standard deviations and p-values between boys and girls (t-test results and significance level) in academic performance, reasoning ability and maturity for each year of chronological age and gender. No differences in academic performance were found between boys and girls. However, boys had higher levels of reasoning ability than girls at age 8 (p=0.027) and 12 (p=0.009) and in the total sample (p=0.006). Regarding maturity, boys were found to be more mature at 6 years of age (p=0.002), but this condition reversed at 11 (p=0.002) and 12 years age (p=0.032) in girls.
Academic performance, reasoning ability and maturity by chronological age and gender, means (SD)

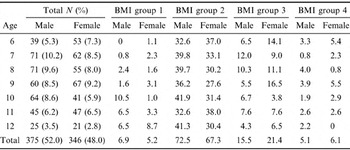
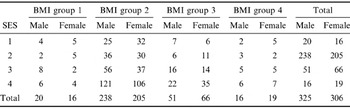
Using Cole's (Reference Cole, Bellizzi, Flegal and Dietz2000, Reference Cole, Flegal, Nicholls and Jackson2007) BMI cut-off points for children, boys' and girls' BMI distributions (total and percentage) by chronological age (Table 3) and socioeconomic status (Table 4) were calculated. Using one-way ANOVA no differences were found between genders by chronological age or socioeconomic status. However, differences were found between boys' and girls' anthropometric characteristics, reasoning ability and maturity, which led to the data being analysed separately.
Percentage distribution by BMI groupa, and by chronological age and gender

a BMI groups: 1, thin; 2, normal weight; 3, overweight; 4, obese.
Percentage distribution by BMI groupa, by socioeconomic status and gender

a BMI groups: 1, thin; 2, normal weight; 3, overweight; 4, obese.
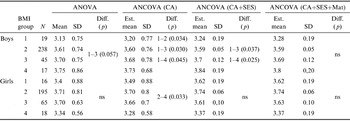
The differences in academic performance between male and female BMI groups before (ANOVA) and after (ANCOVA) control for chronological age, chronological age & SES, and chronological age, SES & maturity, are presented in Table 5. Using the ANOVA, the values for academic performance for the whole sample were compared, and it was found that boys in the thin BMI class had marginally lower values than their peers in the overweight class (p=0.057). Using ANCOVA with chronological age as covariate it was verified that boys from the thin BMI class achieved lower academic performance values than those from the normal weight (p=0.034), overweight (p=0.030) and obese (p=0.045) classes. When SES was added to chronological age as a covariate it was found that differences in academic performance between thin and normal weight BMI classes vanished. After adding maturity to chronological age and SES as covariates it was verified that difference in academic performance between the four BMI classes disappeared.
Differences in academic performance by BMI groupa and by gender

ANOVA and ANCOVA with chronological age (CA), socioeconomic status (SES) and maturity (Mat) as covariates.
a BMI groups: 1, thin; 2, normal weight; 3, overweight; 4, obese.
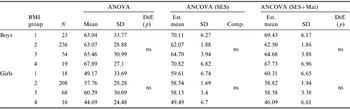
The differences in reasoning ability between male and female BMI groups before (ANOVA) and after (ANCOVA) control for SES, and SES and maturity, are presented in Table 6. No differences were found between BMI groups before and after control for SES and maturity.
Differences in reasoning ability by BMI groupa and by gender

ANOVA and ANCOVA with socioeconomic status (SES) and maturity (Mat) as covariates.
a BMI groups: 1, thin; 2, normal weight; 3, overweight; 4, obese.
Discussion
This study aims to verify whether academic performance and reasoning ability are associated with obesity and if chronological age, maturity and socioeconomic status interfere with this association. Boys were found to have higher reasoning ability values than girls in all age groups, except at 9 years. This superiority displayed by boys may result from their higher capacity for mathematical calculation (Miranda, Reference Miranda2005; Barlow, Reference Barlow2006) and from the non-verbal characteristics of the test used to assess this variable (RPCM), which may have enhanced these results in all age groups. The higher standard deviation observed in girls also showed a greater uniformity of results in males consistent with standardization data from the RPCM test in Portugal (Simões, Reference Simões2000).
Girls were not found to be more mature than boys in all age groups, as was found by Tanner (Reference Tanner1973) 37 years ago. Indeed, when maturity was compared in each age group (Table 2), boys were found to be more mature than girls at 6 years of age (p=0.004) and girls' maturity only exceeded that of boys at 11 (p=0.011) and 12 years of age (p=0.032). This maturity resemblance between genders until pre-puberty could be for a variety of reasons; a full review of the reasons for the advance of boys' maturity is beyond the scope of this paper. However, potential answers can be suggested: 1) the decline in physical activity that, as Padez et al. (Reference Padez, Mourão, Moreira and Rosado2005) concluded and Fragoso et al. (Reference Fragoso, Oliveira, Vieira, Oliveira, Barrigas, Capela, Veloso, Klisouras, Kellis and Mouratidis2004, Reference Fragoso, Vieira, Barrigas, Baptista, Teixeira, Santa-Clara, Marfell-Jones and Olls2006) suggested, affects boys more negatively due to their higher levels of organized and spontaneous physical activity at this age; 2) the increase in obesity, particularly in boys and in lower-income children, which, as Murasko (Reference Murasko2010) demonstrated in US children in the past 40 years, can be associated with an increase in calorie intake in contemporary children (Anderson & Butcher, Reference Anderson and Butcher2006), appetite regulation (Cripps et al., 2009) or exposure to endocrine-disrupting chemicals (Diamanti-Kandarakis et al., Reference Diamanti-Kandarakis, Bouguignon, Giudice, Hauser, Prins and Soto2009); or 3) and the most likely scenario, i.e. the interaction between the reduction in physical activity and the rise in obesity that, together, may boost the proliferation of adipocytes and enhance leptin serum concentration and, as a consequence, induce the maturity resemblance found in both genders. The acceleration observed in females' maturity from 11 years of age must be considered normal since girls tend to reach puberty earlier than boys (Tanner et al., Reference Tanner, Healy, Godstein and Cameron2001) and show an advance in ossification (bone age) from this age.
When BMI data from this sample were compared with those reported by the World Health Organization (2000) for the European child population it was verified that the children in the present study had similar overweight prevalence values and higher obesity prevalence (19% vs 20% and 5.5% vs 3.0%, respectively) than the European child population. Moreover, when the data were compared with the prevalence of obesity and overweight reported by Padez et al. (Reference Padez, Fernandes, Mourão, Moreira and Rosado2004) in a study with a representative sample of Portuguese children, it was concluded that the children in the present study had a lower obesity prevalence (5.5% vs 11.3%), which may result from the use of different cut-off points to define obesity.
On comparing academic performance in boys and girls by BMI using the one-way ANOVA and the univariate ANCOVA with chronological age, SES and maturity as covariates, boys that were overweight or obese had higher academic performance values, but these were not significantly different: only the thin group (group 1) had a marginal and significantly lower academic performance value (p=0.057) than the overweight group (group 3). Girls showed no differences in academic performance between the different BMI groups. These findings contradict those studies that found a negative association between obesity and academic performance (Gortmaker et al., Reference Gortmaker, Must, Perrin, Sobol and Dietz1993; Campos et al., Reference Campos, Sigulem, Moraes, Escrivão and Fisberg1996; Mo-Suwan et al., Reference Mo-Suwan, Lebel, Puetpaiboon and Junjana1999; Falkner et al., Reference Falkner, Neumark-Sztainer, Story, Jeffrey, Beuhring and Resnick2001; Taras & Potts-Datema, Reference Taras and Potts-Datema2005; Datar & Sturm, Reference Datar and Sturm2006, Geier et al., Reference Geier, Foster, Womble, McLaughlin, Borradaile and Nachmani2007; Shore et al., Reference Shore, Sachs, Lidicker, Brett, Wright and Libonati2008; Kristjánsson et al., Reference Kristjánsson, Sigfúsdóttir and Allegrante2010), and particularly the study of Laitinen et al. (Reference Laitinen, Power, Ek, Sovio and Järvelin2002), which concluded that the adverse outcomes of adolescent obesity seemed to be greater in women. Indeed, in the present study, obese boys and girls achieved, respectively, the highest and the lowest academic performance results, although only the overweight and thin boys' groups showed statistically significant differences.
When the ANCOVA was used with chronological age as covariate, differences in academic performance were found between thin and normal weight (p=0.034), overweight (p=0.030) and obese (p=0.045) BMI groups in boys, and between normal weight and obese (p=0.045) BMI groups in girls, suggesting that chronological age moderates differences in academic performance between the BMI groups in both sexes. When chronological age and socioeconomic status were used as covariates it was found that the difference between thin and normal weight BMI groups for boys, and between normal weight and obese BMI groups for girls, disappeared, showing that the differences in academic performance between thin and normal weight BMI groups in boys and normal weight and obese groups in girls may be due to differences in socioeconomic status. These results emphasize the influence of socioeconomic status on academic performance, stress that poverty constitutes a risk factor for failure in school or in life (Kaiser & Delaney, Reference Kaiser and Delaney1996; Leroy & Symes, Reference Leroy and Symes2001) and show that, in this study, the influence of socioeconomic status overlaps with differences in academic performance that emerge from differences in chronological age, in both genders.
When chronological age and socioeconomic status were used along with maturity as covariates no differences in academic performance were found between BMI groups in both genders. These data suggest that differences in academic performance in boys may be attributed to maturity, and support the assumptions of Tanner (Reference Tanner1973) and Kail & Hall (Reference Kail and Hall1999) that more mature children are cognitively more efficient.
The fact that no differences in reasoning ability were found between BMI groups, before or after control for socioeconomic status and maturity, suggests that reasoning ability is, in both sexes, relatively independent of these factors, or that the procedure used to collect reasoning ability data (RCPM) in this study proved to be free from the influence of socioeconomic status and maturity.
Meanwhile, these results contradict the negative association between obesity and academic performance found by several authors (Canning & Mayer, Reference Canning and Mayer1967; Mo-Suwan et al., Reference Mo-Suwan, Lebel, Puetpaiboon and Junjana1999; Falkner et al., Reference Falkner, Neumark-Sztainer, Story, Jeffrey, Beuhring and Resnick2001; Gutiérrez-Fisac et al., Reference Gutiérrez-Fisac, Regidor, Banegas and Artalejo2002; Taras & Potts-Datema, Reference Taras and Potts-Datema2005; NYC Vital Signs, 2009) and emphasize important findings already presented in a few studies that concluded that the negative effect of obesity on academic performance becomes statistically insignificant after controlling for socioeconomic and psychosocial factors (Crosnoe & Muller, Reference Crosnoe and Muller2004; Bagully, Reference Bagully2006; Li et al., Reference Li, Dai, Jackson and Zhang2008). In fact, the present results are not adjusted for the general assumption that obesity negatively affects academic performance since obese boys maintain higher academic performance results after controlling for chronological age, socioeconomic status and maturity. As Li et al. (Reference Li, Dai, Jackson and Zhang2008) suggested, it seems that BMI is not a primary risk factor for poor cognitive or academic performance. Rather than problems resulting from a child's increased weight status, it seems that academic performance in obese children may reflect parental psychopathology, socioeconomic status or, as the present findings reveal for the first time, an influence of maturity status. Since obesity prevalence has become higher at all socioeconomic status levels, it cannot be presumed that obesity is no longer a discriminating factor among children and, therefore, from this perspective, to ‘be obese’ means only to ‘be stout’.
Further research is needed to ascertain an association between obesity and poor cognitive performance and to find out whether, apart from psychosocial factors within the family (Lissau & Sorensen, Reference Lissau and Sorensen1994), insulin resistance (Messier et al., Reference Messier, Awad and Gagnon2004; Watson & Craft, Reference Watson and Crafft2004) hypoxia resulting from obstructive sleep apnoea (Carvalho et al., Reference Carvalho, Prado, Silva, Almeida, Silva, Lora and Prado2005; Blunden & Beebe, Reference Blunden and Beebe2006; Halbower & Malone, Reference Halbower and Mahone2006), and low-degree inflammation of blood vessels in the brain (Li et al., Reference Li, Dai, Jackson and Zhang2008) caused by obesity and overweight, the effect of biological maturity on academic performance may have to be considered. Future research will focus on studying a representative sample of Portuguese children with a larger chronological age range, which will allow greater variability in chronological and bone ages, to order to explore the subtle but persistent relationship between obesity and academic performance and to stress the interrelation between physical health and learning success.
Conclusion
The results of this study lead to the conclusion that reasoning ability and academic performance are not associated with obesity and that maturity moderates academic performance in boys.