


1. Introduction
The stable-isotope composition of polar snow provides one of the most detailed proxy sources of evidence for past climate. Although the mean isotopic composition of snow in many places is primarily dependent on the mean air temperature at the deposition site (Piciotto and others 1960), it is also influenced by other factors, including distance from the source of water vapour (Reference Fisher and AltFisher and Alt 1985), the rate processes of evaporation and condensation (Reference Jouzel and MerlivatJouzel and Merlivat 1984), the composition and temperature of the oceanic source, and the seasonal distribution of snow accumulation (Reference Robin and RobinRobin 1983). As a result, isotope–temperature gradients calculated from plots of mean annual values determined at geographically dispersed sites cannot necessarily be used to interpret temperature variations over time from changes in the isotopic composition along an ice core.
The climatic record of the Antarctic Peninsula is of special interest because the region forms a partial bridge between the Antarctic ice sheet and South America. It is well placed for the correlation of climatic records derived from the continental ice sheet with those from middle latitudes. High mountains block the westward movement of outflowing, stable continental air, which creates a cold, barrier wind along the east coast of the region. The west-coast climate is dominated by cyclonic systems approaching from the South Pacific and is typically 7°C warmer than the east coast at a given latitude (Reference SchwerdtfegerSchwerdtfeger 1974). We have examined cores drilled from these areas of contrasting climate. A core drilled in the south of the region on Palmer Land plateau (74°01’S, 70°38’W), referred to as “Gomez” in Figure 1, is sited within the influence of the west-coast regime, whereas a second core from Dolleman Island (70°35.2’S, 60 55.5’W) lies firmly within the east-coast regime. A particular effort has been made to date the cores precisely, to enable a meaningful comparison of the isotope and temperature records from the region at a resolution of inter-annual variations.
Map of the Antarctic Peninsula, showing the location of drilling sites and weather stations discussed in this paper.

2. Ice-Core Collections
Table 1 summarizes the characteristic data for the sample collection sites. Earlier studies (Reference Peel and ClausenPeel and Clausen 1982) on 10 m cores drilled throughout the Antarctic Peninsula have shown that the clearest seasonal cycles in stable-isotope ratio are preserved in the more continental areas –viz. along the east coast and on the spine southwards from about 70 °S. South of latitude 73 °S the annual signal becomes almost unequivocal as increasing continentality strengthens its amplitude.

Site “Gomez” lies in an area of smooth-surface topography, on the north-western flank of the ice divide in southern Palmer Land. Ice movement in the area has not been measured; the bedrock topography is rugged, and ice thicknesses in the vicinity, typically in the range 600–2000 m, vary sharply (c. 300 m in 5 km) over short distances (personal communication from C.S.M. Doake). The cores showed negligible evidence of summer melting.
Dolleman Island, on the east coast, has a pseudo-continental climatic regime dominated by persistent sea ice in the Weddell Sea and by the influence of cold, stable winds draining across the Ronne Ice Shelf from the interior of the continent. It is a symmetrical dome feature with a well-defined radial ice-flow pattern and is grounded on gently undulating bedrock, slightly below sea level. Cores were drilled at a site 1 km from the summit, and the summit was left in pristine condition for future deep drilling. Summer melting at the site is limited and ice layers very rarely exceed 1 cm thickness. Pit stratigraphy observations through an exceptionally warm summer event (1984–85) showed that percolation was contained within the upper snow layers of the previous winter.
3. Ice-Core Dating
Climatic conditions in the Antarctic Peninsula are notoriously changeable, and the standard deviation of year-to-year mean annual temperatures is correspondingly large. A typical value of 1.5°C at Faraday contrasts with values of 0.34° and 0.74 °C from the interior of the continent at South Pole and Vostok respectively (Reference Robin and RobinRobin 1983). To make satisfactory statistical comparisons between the year-to-year changes in temperature and stable-isotope records from ice cores, dating should achieve a 1 year precision.
Primary dating of both cores was carried out by identifying the well-established peak in β radioactivity which corresponds to snow strata of 1964–65 and the shift in activity from natural background in summer 1954–55. This latter feature is now rather weak in the higher-accumulation areas of the Antarctic Peninsula. Figure 2 shows that there is generally a strong annual periodicity in the isotope stratigraphy at both sites. However, without additional evidence there could be a subjective error in stratigraphie dating of up to 15% at Gomez and 12% at Dolleman. Additional means were sought to strengthen the dating of the entire cores.
We have assumed a priori that there is a significant correlation between the temporal variations of stable-isotope ratio and air temperature. We then seek to find statistically the optimum correlation between the isotope profile (converted to a time series) and a temperature time series from the nearest station from which one was available. Here we have used data from Faraday (65°15’S, 64°16’W). Although this station is approximately 1030 km from Gomez and 620 km from Dolleman, Reference LimbertLimbert (1974) has reported a good correlation between the temperature records of stations lying between 61° and 68 °S, suggesting that there is a strong temperature signal which is applicable to much of the region.
The optimum correlation for both isotopic profiles was achieved with a chronology which is in complete accord with both the stratigraphie evidence and the total β activity profile. At Dolleman Island there is additional evidence from a 10 m core drilled in December 1975. The stable-isotope profile from this core (Fig. 2), plotted against water-equivalent depth, follows closely the corresponding section of the 1986 core, after making allowance for diffusion of the isotopic signal during the 10 year intervening period. The combined evidence suggests that the dating of the Dolleman core lies within the ±1 year precision required.
4. Time Series of Stable Isotopes and Air Temperature
Our chief objective is to examine the relationship between the stable-isotope and air-temperature records on annual-to-decadal time-scales. Time series of mean annual δ values were computed between isotopic minima in the core profiles (Fig. 3a). These features are much more sharply defined than the summer maxima. Where there is limited summer melting, this will be contained within the “isotopic year” over which averaging is performed. For comparison with the isotopic data, annual temperature averages have been computed from August to the following July at neighbouring stations (Fig. 3b, where, for example, the average temperature for the period from August 1980 to July 1981 is plotted at 1981.08),
Faraday is the station closest to the Gomez and the Dolleman Island sites which has a long temperature record (going back to 1947). Its temperature, as indicated above, shows excellent correlation over a wide range of latitude with records from other stations on the western side of the peninsula. An averaged time series for the peninsula (“Antarctic Peninsula” in Fig. 3b) has been computed by Reference LimbertLimbert (1984) by combining records from Faraday, Frei and Bellingshausen, Hope Bay and Esperanza, and Adelaide and Rothera. This can be expected to smooth out local anomalies from the regional temperature record. Finally, the temperature series at Halley is shown, as the climate at this station is influenced by conditions in the Weddell Sea; hence it can be expected to show some relationship with the climate of the eastern side of the peninsula.
Since about 1960, all the profiles show evidence for an increasing, albeit not continuous, trend in both the temperature and the δ value. Trend lines are drawn through the maximum period of overlap of the profiles (1948–80). The gradients of lines through the shorter period of more sustained temperature increase (1960–80) are marked also; these values are significant at the 2% level. The overall temperature increase since 1960 (˜1.3°C) is approximately four times greater than the average change recorded at stations elsewhere on the Antarctic continent, possibly reflecting the Antarctic Peninsula’s general sensitivity to large-scale climatic changes over the whole continent. For the period 1960–80 similar temperature increases are observed throughout the western Antarctic Peninsula and at Halley. A slightly smaller gradient is observed at Faraday over the span 1948–80, whereas the mean peninsula series is 43% smaller. This is mainly due to the large positive-temperature anomaly in 1955–57, which is a relatively large feature in the meaned time series.
This anomaly appears clearly in the isotopic records at both Gomez and Dolleman, and it has also been reported by Aristarain and others (1986) in the isotopic profile of an ice core from James Ross Island, in the north-east of the region. Reference LimbertLimbert (1974) has identified, in the temperature records from weather stations in the Antarctic Peninsula between 68° and 61° S, a series of anomalies that should be observable over the whole peninsula, All the principal anomalies are listed in Table II, together with the corresponding strengths of anomalies in the isotope records at Gomez and at Dolleman. With the exception of the 1970–72 event, which is not visible in the Dolleman record, all the temperature anomalies are recorded in the isotope profiles, usually strongly. The recent isotope record at Dolleman, especially the large positive-isotope anomaly during 1975–77, appears to correlate much better with the large positive-temperature anomaly at Halley during the same period. This suggests that whereas the Gomez site may be most suitable for reconstructing the major temperature anomalies in the western and central area of the peninsula, isotopic data from Dolleman will add information about influences from the Weddell Sea sector. The isotopic data from Dalinger Dome on James Ross Island also showed a large positive-temperature anomaly for the period 1974–77, and this site too is subject to a predominantly western climate, with modification from the east. Evidence for a very much smaller warming trend between 1904 and 1980 was presented for this site, following more closely the temperature record from Laurie Island, which is surrounded by ocean and exhibits a more conservative temperature response.
Stable-isotope (δ18O) and total β radioactivity as a function of water-equivalent depth and firn depth for a 47.2 m core from Gomez (drilled January 1981) and 32.2 m core from Dolleman Island (drilled January 1986). δ18O data for an 11 m core drilled at Dolleman Island in December 1975 are plotted (stippled) as a function of water-equivalent depth for comparison. Figures over arrows represent assigned calendar years.

Mean annual time series of δ18O at Gomez and at Dolleman compared with a time series of temperature from the Antarctic Peninsula, (a) Mean annual δ18O values at Gomez. Mean annual δ18O values at Dolleman Island, (b) Mean annual temperature at Faraday. Mean annual temperature for the Antarctic Peninsula (average), plotted as a deviation from the mean. Mean annual temperature at Halley.


5. Stable-Isotope/Temperature Relationship
The average isotopic composition of snow precipitation on polar ice sheets is normally related to the mean surface-air temperature (or 10 m temperature) at the collection site. Although the isotopic fractionation process is primarily controlled by the overall cooling of an air mass as it moves towards the deposition site, rate processes during uptake and deposition of water can be important factors (Jouzel and others 1983). The empirical δ/T relationships are usually derived from plots of values of δ and T averaged over several years at points scattered spatially. Factors affecting the isotopic composition of an air mass either at its source area or during transport to the site where snowfall is deposited may, on average, exert a common influence on the isotopic composition over a wide area. Isotopic differentiation between sites in the area will then be the result mainly of progressive condensation from the air mass, a process primarily controlled by temperature.
5.1 Comparison of spatial and temporal δ/T gradients
For the Antarctic Peninsula, Reference Peel and ClausenPeel and Clausen (1982) found that the δ/T data, from a network of 10 m cores collected throughout the region, fitted a curve with a gradient increasing from 0.5‰/°C at 0°C to 0.95‰/°C at –17°C, in accord with a simple Rayleigh model of the fractionation process. The mean δ values at Gomez and at Dolleman Island fit this relationship satisfactorily (Fig. 4). A simple least-squares regression through points derived from the Antarctic Peninsula has a gradient of 0.90 ± 0.06‰/°C. However, in studying temporal changes at fixed sites, factors related to the earlier history of the air mass become much more important and δ/T gradients determined spatially may be inapplicable.
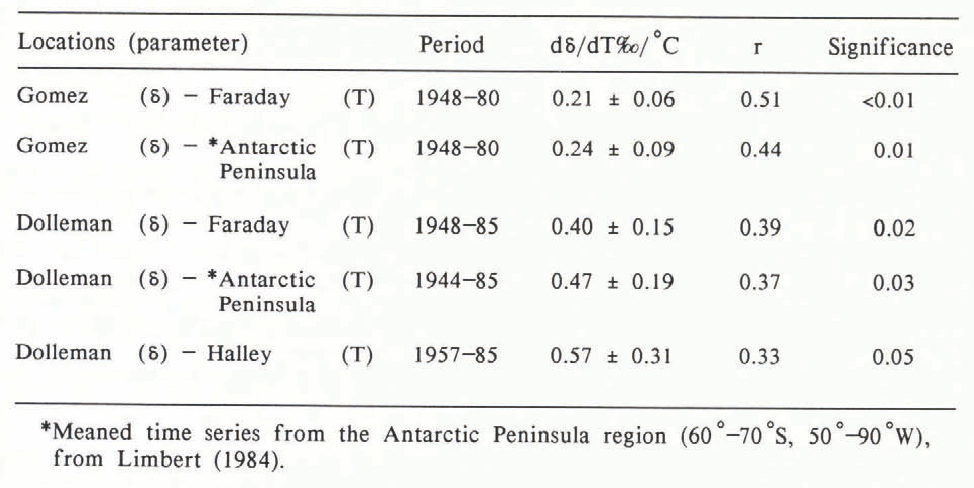
First we have compared the time series of the mean annual values of δ at Gomez and at Dolleman as a function of the air-temperature records (Table III). There is a significant correlation between the isotopic composition at both sites and the air-temperature records from both Faraday and the meaned data set from the western Antarctic Peninsula. There is a marginally (5% level) significant correlation between the δ record at Dolleman and the temperature at Halley. The observed δ/T ratio (average 0.33‰/° C for the Antarctic Peninsula temperature records) is only 30% of the spatially determined ratio. It is possible that a relatively large local signal in either or both records could contribute to the low &/T ratio. Although the temperature records are well correlated (r is in the range 0.85-0.93), the δ records are only weakly correlated (r = 0.23, sig = 0.1). Local noise in the isotope profiles would appear to be the most important factor, as there is no significant improvement when the δ records are correlated with the meaned Antarctic Peninsula temperature record, and only a marginal increase in the δ/T ratio,
5.2 Influence of local noise
We have attempted to estimate the effect of reducing the influence of local noise in two ways:
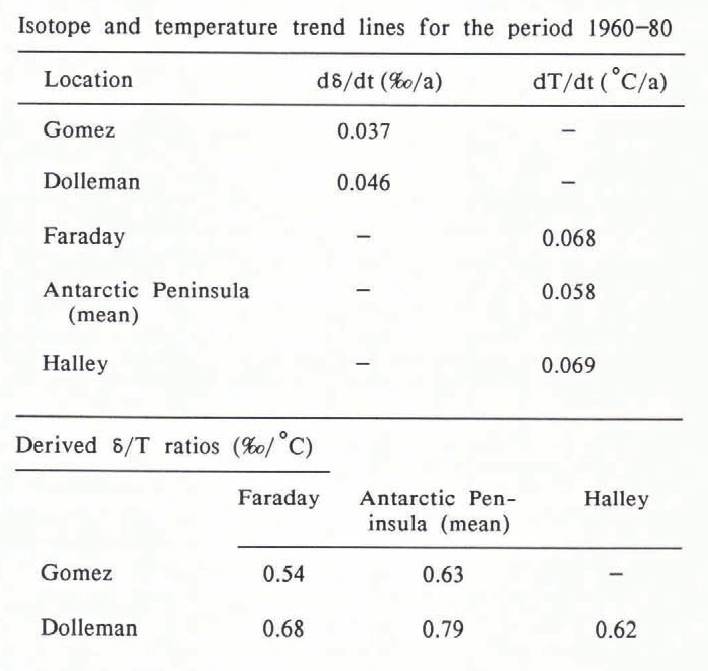
(i) The period 1960-80 showed a coherent temperature increase, with a similar gradient of temperature increase over time, throughout the Antarctic Peninsula and extending across the Weddell Sea to Halley. The regressions for δ and temperature against time throughout this period are given in Table IV, The derived gradients are expected to be more conservative and less sensitive to local factors than the inter-annual changes. Comparison of the isotopic and temperature gradients leads to an average δ/T ratio of 0.63‰/°C.
(ii) During the period 1964–71 snowfall was collected on a continuous basis at Faraday. Mean monthly stable-isotope data for these samples (International Atomic Energy Agency 1964δ78) can be compared directly with the temperature records from the same station. The derived δ/T ratio is 0.46±0.06‰/°C (r = 0.61).
These two observations suggest that a δ/T gradient in the region of 0.5–O.6‰/°C is probably the most realistic for estimating the amplitude of temperature shifts from the isotopic profiles. Aristarain and others (1986) have compared isotopic data from James Ross Island with temperature records from the northern part of the Antarctic Peninsula. Optimum correlations were achieved using temperature profiles from Faraday and from Faraday and Esperanza (combined). The regressions yielded δ/T ratios (for δD) of 2.8 and 4.5‰/°C respectively, equivalent to 0.35 and 0.56‰/°C in δ18O.
Mean annual stable-isotope ratio (δ18O) plotted against mean annual air temperature (10 m temperature or mean annual daily temperature) for sites in the Antarctic Peninsula (64°–74°S, 59°–75°W).

5.3 Sources of discrepancy between spatial and temporal δ/T gradients
There remains a considerable discrepancy (approximately 40–50%) between the “optimum” δ/T ratios determined from analysis of temporal variations and those determined from spatial studies. Aristarain and others (1986) found that they could account for this at James Ross Island, assuming that the classical Rayleigh model still applies, if the same temperature fluctuations affect the moisture-source regions and the snow-deposition site. However, the inter-annual variability of temperature is much smaller over the oceanic areas north of the Antarctic Peninsula (where it is moderated by the ocean) than over the peninsula itself. The inter-annual variability is around 0.3° C in the Southern Ocean (49°–55°S), compared with an average 1.2°C over the Antarctic Peninsula (Reference LimbertLimbert 1984). Moreover, the average temperature increase during the period 1957–78 was about 0.02°C/a over the oceanic areas, compared with ˜0.06 °C/a over the Antarctic Peninsula. Therefore it seems unlikely that this mechanism can be of major importance at sites farther south in the Antarctic Peninsula.
Several alternative hypotheses have been considered: (i) influence of sea-ice fluctuations
Several authors have found strong empirical evidence that the isotopic composition of snowfall can be influenced by the distance from the closest significant moisture source. Reference KoernerKoerner (1979) found that 61% of the δ18O distribution over the Queen Elizabeth Islands in Arctic Canada could be explained in terms of the distance from the predominant moisture source, which was Baffin Bay. At Syowa Station in Antarctica, a coastal station where orographic influences are small, Reference KatoKato (1978) reported that the isotopic composition of individual snowfalls was closely related to the distance from the open sea. These findings have been supported by a theoretical model (Reference Fisher and AltFisher and Alt 1985) of isotopic distribution in polar regions which takes account of the various moisture-source zones contributing to the net vapour transport towards the precipitation site.
Reference Bromwich and WeaverBromwich and Weaver (1983) showed that the seasonal δ18O cycle at Syowa Station did not correlate well with air temperature. However, the correlation between mean monthly values could be improved if the δ values were correlated with the previous month’s temperature. These authors conclude that at this location the sea-ice extent, which lags air temperature by approximately one month, is a more important influence on. the isotopic composition than temperature.
We have analysed an 11 year (1964–75) sequence of monthly isotope and temperature values at Faraday (International Atomic Agency 1964–78). In this series, the maximum correlation between δ and T (r = 0.61) occurs at zero lag, and falls to r = 0.27 when there is a lag of one month between the profiles. The effect is probably much smaller in the Antarctic Peninsula because the meridional distance between the sea-ice minimum and maximum (typically <250 km) is much shorter than that at Syowa (800 km). Where an air mass traverses a large distance over sea ice to a coastal site, a substantial part of its overall cooling will be controlled by radiation loss (isobaric cooling). The theoretical δ/T gradient for precipitation derived from an isobarically cooled air mass is larger than that associated with adiabatic cooling. In the peninsula, orographic processes are dominant; the observed δ/T profile tends to follow an adiabatically cooled curve and is probably insensitive to changes in the small proportion of the overall cooling that occurs isobarically.
(ii) Relationship between surface and condensation temperatures
It is possible that there is some systematic difference between the surface-air temperature and the condensation temperature in the cloud that primarily regulates the isotopic composition. However, in the Antarctic Peninsula much of the snowfall is associated with low cloud forms, and indeed surface riming from frequent fogs may be a significant contributor to the annual accumulation. Throughout 1975–76, snowfall collections were made at Faraday over the whole annual cycle, whenever snowfall occurred during routine radiosonde ascents. The following regression was obtained between the surface temperature (Ts°C) and the temperature at the base of the cloud (Tc°C):

Although there is evidently a close relationship between Ts and Tc, the reduced gradient suggests that for true snowfall, rather than riming, the δ/T ratio could be increased by up to 25% from a theoretical value, if surface temperatures are used rather than actual condensation temperatures.
Isotope and temperature trend lines for the period 1960-80
(iii) Biasing due to irregular seasonal snow-deposition pattern
Snow does not fall regularly throughout the year and this could introduce some biasing in the isotopic record preserved by snowfall. The effect may be particularly severe in the Antarctic Peninsula, where changes in the mean annual air temperature are due primarily to changes in the winter temperature (Reference LimbertLimbert 1974). In the absence of a long-term, monthly snow-accumulation record this has been estimated on the basis of the number of days per month on which precipitation was observed to fall at Faraday. In support, the mean annual snowfall for the period 1967–75 (International Atomic Energy Agency 1964–78) shows a satisfactory relationship with the mean annual number of days of snowfall reported. Mean monthly temperatures at Faraday for this period were weighted according to the number of days/month with recorded snowfall. In order to simulate resulting biasing in the isotopic record, the weighted annual temperature series (Tw) was regressed against the standard synoptic temperature series:
Tw = T(0.95±0.05) − 0.38 ± 0.22 (r = 0.97, sig<0.01%)
Evidently the mean annual isotopic composition is relatively insensitive to the accumulation pattern throughout the year.
(iv) Effect of biased sampling of temperature regime by snowfall
Biasing could be introduced into the isotopic record because it samples only that small proportion of the total time when snowfall is occurring. During 1975–76 a series of snow samples was collected at Faraday throughout the year whenever snowfall occurred at the time of a routine radiosonde ascent. The δ/T ratio for these collections was 0.97 ±0.29‰/°C (r = 0.57, sig<0.01), in much closer agreement with the spatially derived ratio, although there is considerable scatter in the data. However, this finding indicates that there could be a problem in relating a mean monthly temperature based on continuous observation to a mean temperature computed only from observations coinciding with snowfall events.
In order to simulate the possible extent of biasing in the temperature record we have examined the 3 hourly weather-observation log from Faraday for 1981 and calculated the effective mean monthly temperature (Teff) sampled by snowfall by averaging only those 3-hourly periods when snowfall was visible from the station. Figure 5 relates these data to the standard synoptic temperature series. The following regression was obtained:
Teff = T(0.64±0.05) ± 0.058 (r = 0.96, sig<0.001)
Figure 5 shows that during the summer months (November–March) there is a close correspondence between the “snowfall-sampled temperature” and the instrumental temperature. However, these values progressively diverge as the temperature falls, towards winter. Because variations in the mean annual temperature are primarily determined by variations in the winter temperature, this divergence introduces a severe biasing into the isotopic record. The divergence probably arises because snowfall during the winter is associated mainly with cyclonic events, when temperatures are higher than the average for the season. Cold periods are usually associated with clear skies, influencing the instrumentally recorded temperature, but they are not “sampled” by snowfall. We believe that the biasing observed at Faraday (˜36%) is the major contributor to the discrepancy between the spatial δ/T ratio and the ratio that is required to deduce temperature change from an isotopic record.
Mean monthly “snowfall-sampled” temperature as a function of continuously sampled air temperature at Faraday for 1981.

It seems likely that this problem is more general. An even larger correction may be required in areas with a more pronounced winter-temperature inversion, particularly if a significant part of the annual snow accumulation is cyclonic. Coastal areas of the continental ice sheet are likely to be those most severely affected.
Conclusions
Our studies at Gomez and at Dolleman Island show that ice-core profiles of stable isotopes from the Antarctic Peninsula preserve a useful record of air temperature for the region, even at a resolution of inter-annual variations. The relatively large annual snow-accumulation rate at these sites, in combination with a strong seasonal signal in the isotope ratio, has ensured that the isotopic record can be dated with high precision. The strength of the signal at the critical depth (ρ ˜0.55 M gm−3) indicates that the seasonal cycles will be identifiable to at least 1000 years B.P. at these sites.
All the major temperature anomalies that have been detected in climatic records from various stations in the Antarctic Peninsula can be identified in the stable-isotope profiles. Moreover, the recent period (1960–80) of coherent temperature increase for the region is also a strong feature of both isotope profiles.
The derived oxygen-isotope/ air-temperature gradient, obtained by direct comparison of the mean annual isotope ratios with temperature records from stations in the region, is around 0.33‰/°C. The δ/T gradient obtained by comparing longer-term trends or by comparing data from closely adjacent sites is in the range 0.5–0.6‰/°C. In part this discrepancy arises because the inter-annual variations at single sites are subject to local influences which may not be in phase at separated sites. The larger gradient is probably the more realistic for interpreting climatic trends from isotope profiles in the region.
This gradient is still some 40% less than that obtained by comparing spatial variations in the mean annual values (0.95‰/°C). Analysis of the meteorological records at a typical Antarctic Peninsula site, Faraday, has shown that the discrepancy can be accounted for by a biasing in the isotopic record. This arises because snowfall tends to occur when the air temperature is higher than the average for that season, and the effect becomes more pronounced with decreasing temperature. Similar analysis of weather records from stations on the continental ice sheets is required to establish whether this is a general problem.
Acknowledgements
The authors express their gratitude to many members of the British Antarctic Survey who took part in the drilling programmes on which this work is based. Particular thanks are due to Dr J G Paren, who led the team (including the late J H M Anderson, and G R Baum and R E Bowler) that drilled the 83 m core at Gomez. They used an electro-mechanical drill kindly loaned by the US Polar Ice Coring Office.
Finally, we are deeply indebted to the Geophysical Isotope Laboratory, University of Copenhagen, and especially to Dr H B Clausen and Dr N Gundestrup, who have so generously given both of their own time and of precious instrument time to analyse the large numbers of isotope samples which made this paper possible.



