Introduction
Compact, low-profile, planar multiband antennas with independent frequency tuning are in greater demand due to the rapid development of advanced mobile communication systems. By utilizing adaptable elements like varactor diodes (for constant tuning of frequencies) or PIN diodes (for distinct switching) within its structure, an autonomous frequency tuning multichannel antenna dynamically modifies each operating frequency band independently, overcoming the limitations of fixed designs. It frequently uses methods such as irregular structures, slotted insertion, or resonator connections (Split Ring Resonators (SRRs), Circular Split Ring Resonators (CSRRs)) to establish different alternate resonant modes for applications requiring adjustable, broadband, or multi-service coverage, as seen in 5G, surveillance, and Internet of Things devices. A simple design of planar antenna with fewer integration losses is immensely required to connect widely used microwave devices like rectifier, diplexer, filter, etc., in various applications. In recent years, dual- and triple-band antennas with independent frequency tuning have been reported in [Reference Sung1–Reference Qian, Chen, Xiang and Chu6], but the antenna size is large, and the etching of copper layer on the two sides of the substrate is needed. In [Reference Sung1, Reference Qu, Zhang and Kim3, Reference Qu, Zhang, Lee and Kim5], passive components of capacitors and inductors are primarily inserted on the antenna radiator for independent controll of dual- and triple-band frequencies, which results in radiation losses. However, a single substrate compact hand-held multiband antenna is extensively desirable for easy integration with other devices. Recently, proximity coupled [Reference Bakariya, Santanu, Manas and Mandal7] and rectangular slot-loaded [Reference Qian, Chen and Chu8], triple-band antennas have been reported for multiband operation, but these designs include two back-to-back substrate layers, and also the antenna size in [Reference Qian, Chen and Chu8] is large. Strip line-based slotted antenna with similar split ring resonators [Reference Sarkar, Saurava and Srivatsava9], a dual-band U-shaped slot rectangular patch antenna [Reference Varma, Ghosh and Bhattacharya10], a quad-band antenna using two substrates [Reference Li, You, Yu, Cheng, Yang and Deng11], and a triple-band patch antenna [Reference Abdelheq, Lin, Jia Wei and Mei12] are presented. Similarly, a unidirectional dual-band stacked patch antenna [Reference Lei, Mingjian, Wang and Hui13], quad-band antenna with independent frequency tuning [Reference Islam, kumar, Sen and Das14], slotted monopole antenna [Reference Sandhya and Akhtar15], and Vivaldi antenna [Reference Shi, Fan, Yang, Pang, Jing and Wang16] are reported. Similarly, a slot-line based Multiple Input Multiput Output (MIMO) antenna with independent frequency tuning [Reference Hussain, Khan and Sharawi17], a dual-band reconfigurable flexible antenna [Reference Dang, Chen, Ranasinghe and Fumeaux18], an end-fire stepped slot antenna [Reference Wang, Li, Yin Li, Zhang, Yang and García19], and a thin film based antenna [Reference Rakluea, Wongsin, jatuphat, Aroonmitr, Jangjing, Rakluea, Chanwattanapong and Chudpooti20] are reported. The structures in [Reference Li, You, Yu, Cheng, Yang and Deng11] and [Reference Abdelheq, Lin, Jia Wei and Mei12] show a complex and soldering with more lumped components for frequency tuning. An appropriate gain, monopolar radiation pattern, and good radiation efficiency are necessary for a small-sized planar antenna in order to support sophisticated wireless communication such as the Internet of Things, 5G, and distant sensor nodes. In order to receive radio frequency (RF) power from the 1.95 and 2.45 GHz frequency bands, a gain-enhanced dual-band microstrip antenna with a reflector was described in [Reference Mohamed, Ahmed and Ramesh21]. A paper-based small triple-band antenna that operates in the Long Term Evolution (LTE) bands was described in [Reference Palazzi, Hester and Jo Bito22]. The double-band monopole antenna for the 1.8 and 2.1 GHz cellular frequencies was introduced in [Reference Khemar, Abdellah Kacha and Abib23]. A microstrip patch antenna with dual ports and tri-band capability for mobile frequencies of 0.9 GHz, 1.8 GHz, and 2.1 GHz was detailed in [Reference Shen, Chiu and Murch24]. A loop antenna is situated on an artificial magnetic conductor surface as reported in [Reference Kamoda, Kitazawa, Kukutsu and Kobayashi25]. In [Reference Niotaki, Kim, Jeong and Collado26], a folded dipole antenna with slot loading that operates at 0.915 and 2.45 GHz was demonstrated. For wireless sensor networks, a quad-band dipole antenna operating at three cellular bands and one lower Wi-Fi band was introduced in [Reference Kuhn, Lahuec, Seguin and Person27]. Comparably, [Reference Liu, Lu and Hsu28–Reference Tejpal, Dinesh Yadav and Bhatnagar31] and [Reference Tejpal, Dinesh Yadav and Bhatnagar32] propose compact antennas with harmonic suppression.
In this work, a compact quatrefoil shape triple-band planar monopole antenna with independent frequency tuning using circular slots and open-ended inverted L-slot is proposed for multiband wireless communication systems. To excite the necessary triple bands, the antenna is made up of a Coplanar Wave Guide (CPW) fed with a single-sided ground plane. There is no copper layer printed on the back of the substrate; the antenna is designed on the front side. The symmetrical structure of the antenna leads to an enhancement in both compactness and radiation performance. This work also presents double-band slotted antennas with adjustable feed length (FL) that operate at the mobile and Wi-Fi bands.
Triple-band antenna with independent frequency tuning
Antenna design details
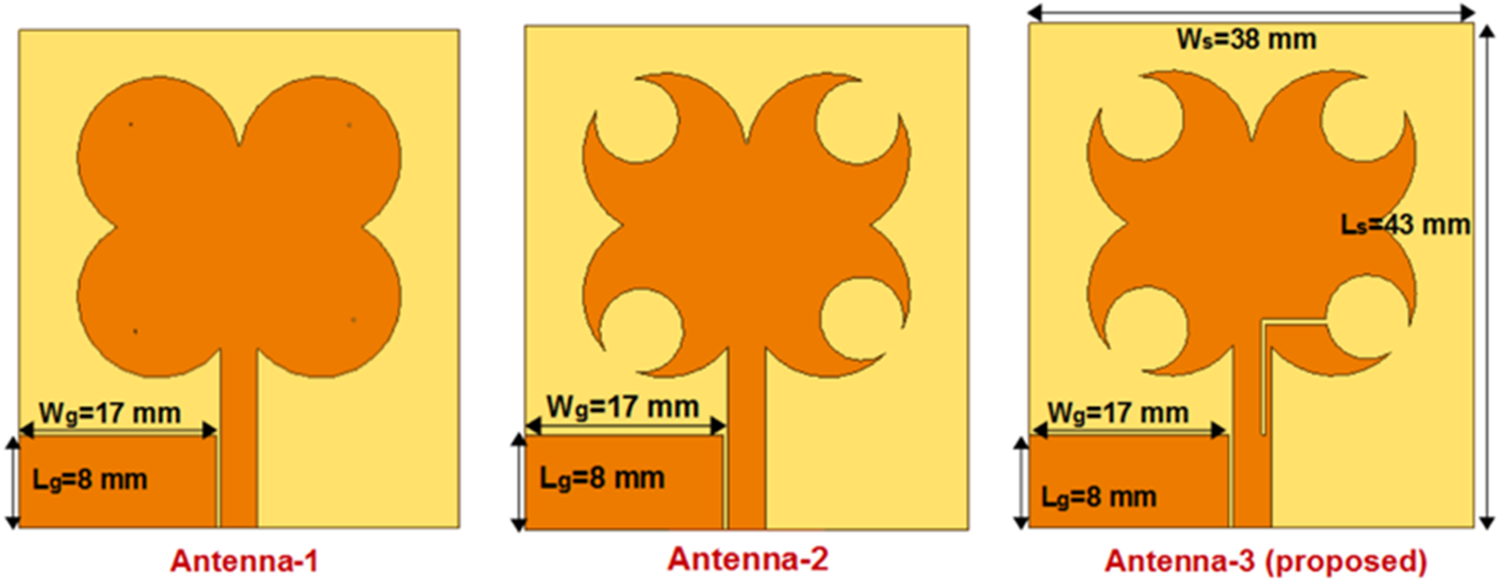
Figure 1 shows the geometrical arrangements of the three distinct monopole antennas. The suggested antenna is built on an FR4 substrate material that has the following properties: loss tangent ( $\tan \delta$)=0.025, thickness(
 $t$)=1.6 mm, and dielectric constant (
 $\varepsilon_r$)=4.3. The antenna is made up of four partially overlapping circles with the same radius, or a simple structured quatrefoil shape. These are etched by other symmetrical circular slots and consist of symmetrical circular patches. As seen in antenna-1, the first band of the antenna is produced by combining four circles with identical radii of 7 mm.
Geometrical configurations of the three different monopole antennas.

The antenna is integrated into a 50 $\Omega$ microstrip feed line to provide the highest input power possible for the excitation of the necessary tri-band frequencies. On the left side of the feed line, a ground plane measuring 8 mm
 $\times$17 mm (Lg
 $\times$Wg) with a 0.4 mm gap width is designed. The suggested antenna has geometric dimensions of 47 mm
 $\times$36 mm (Ls
 $\times$Ws). All that is needed to create the antenna’s second band is a straightforward etching process using symmetrical slotted circles with a 3.6 mm radius. The ground plane size and the circular patch dimensions remain unchanged in this instance. Another configuration of this design layout is antenna-2. Finally, for the third frequency band, which is represented by Antenna-3 (proposed) in Figure 1, an inverted open-ended L-slot covering the feed line and circular slot is etched with a width of 0.4 mm. These three functioning frequency bands simply rely on their matching geometrical dimensions and are independently controlled by one another. Because of the efficient coupling of the inverted L-slot and circular slots with the radiator, the proposed antenna has constant frequency bands.
Results and discussion
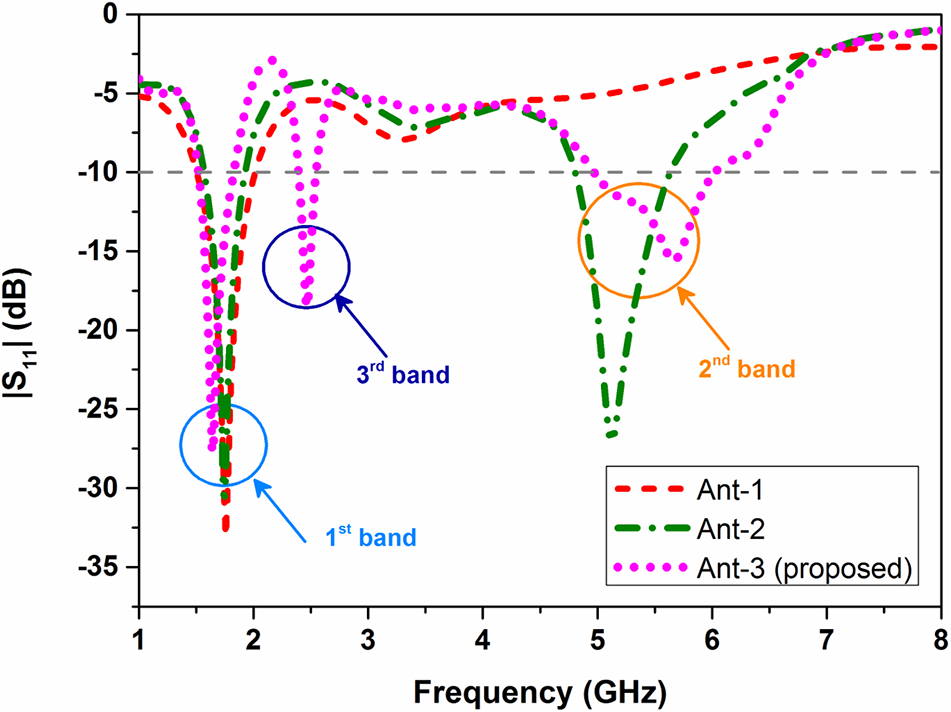
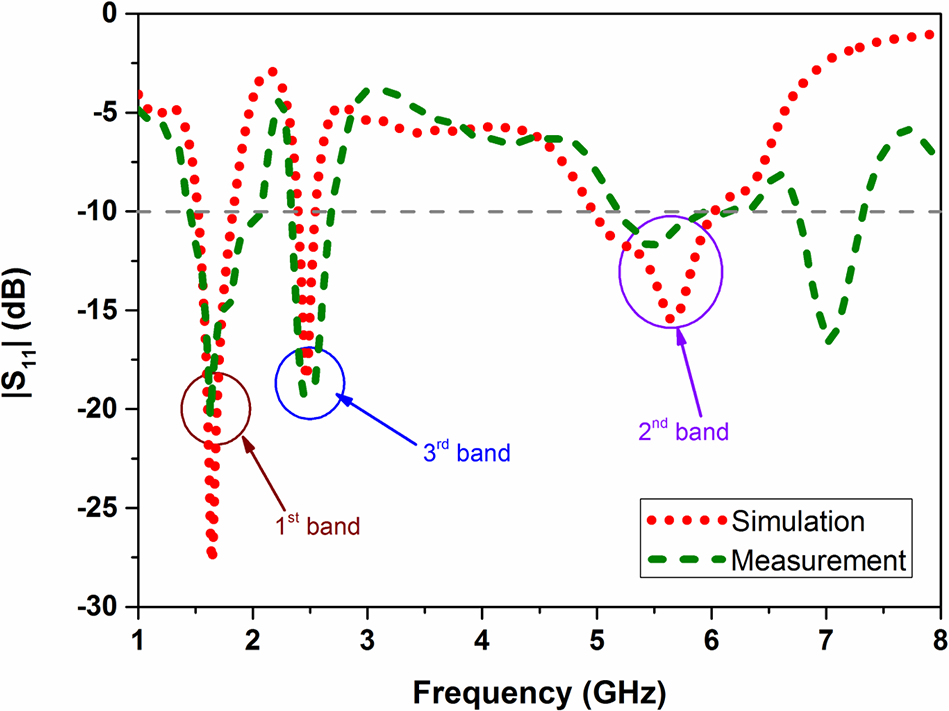
Figure 2 shows the reflection coefficient ( $|S_{11}|$) simulation results for the three antenna layouts. The antenna-1 arrangement shown in Figure 1 has the fundamental resonance at 1.75 GHz without any higher-order harmonics. Similar to the first band, which is slightly displaced to the lower frequency side, the antenna-2 arrangement resonates with the second band independently at 5.1 GHz because of the etching of slotted circles. Without significantly altering the first and second band frequencies, the third band frequency of 2.4 GHz can be simply attained by etching an open-ended, inverted L-shaped slot on the patch and feed line. The proposed antenna (antenna-3 design) functioning at the distinct triple-band frequencies of 1.6, 2.4, and 5.6 GHz with independent control is finally described by the simulation results. Agilent Technologies vector network analyzer is used to measure
 $|S_{11}|$ versus frequency for the proposed slotted antenna. Figure 3 shows the simulation and measured results of the proposed antenna’s reflection coefficient (
 $|S_{11}|$).
Simulation results – antenna three different configurations.

Figure 2 Long description
The vertical axis is labeled S11 (decibel), ranging from 0 to minus 35 with labeled ticks at 0, minus 5, minus 10, minus 15, minus 20, minus 25, minus 30 and minus 35. The horizontal axis is labeled Frequency (gigahertz), ranging from 1 to 8 with labeled ticks at 1, 2, 3, 4, 5, 6, 7 and 8. A legend shows three line styles: Ant 1, Ant 2 and Ant 3 (proposed). Ant 1: The curve starts near 0 decibel at 1 gigahertz, drops to a minimum near 2 gigahertz at about minus 30 decibel, rises to around minus 5 decibel near 3 gigahertz, stays near minus 5 to minus 10 decibel through about 4 to 5 gigahertz, then drops again to a minimum near 5.5 gigahertz at about minus 25 decibel and rises toward about 0 decibel by about 7 to 8 gigahertz. Ant 2: The curve starts near 0 decibel at 1 gigahertz, drops to a minimum near 2 gigahertz at about minus 25 decibel, rises to around minus 5 decibel near 3 gigahertz, then drops to a minimum near 5.5 gigahertz at about minus 30 decibel and rises toward about 0 decibel by about 7 to 8 gigahertz. Ant 3 (proposed): The curve starts near 0 decibel at 1 gigahertz, drops to a minimum near 2 gigahertz at about minus 30 decibel, rises to around minus 5 decibel near 3 gigahertz, drops again near about 2.7 gigahertz to about minus 20 decibel, rises back toward about minus 5 decibel near 3 to 4 gigahertz, then drops to a minimum near 5.5 gigahertz at about minus 25 decibel and rises toward about 0 decibel by about 7 to 8 gigahertz. Three circled regions are marked near about 2 gigahertz, about 2.7 gigahertz and about 5.5 gigahertz.
Simulation and measured reflection coefficient (antenna-3-proposed).

Figure 3 Long description
The graph displays the reflection coefficient in decibels on the vertical axis, ranging from negative 30 to 0 and frequency in gigahertz on the horizontal axis, ranging from 0 to 8. Two lines are shown: a dashed line representing measurement and a dotted line representing simulation. The simulation line shows three distinct bands: the first band around 1.6 gigahertz, the second band around 2.4 gigahertz and the third band around 5.6 gigahertz. The measurement line follows a similar pattern but with variations in amplitude. Notable points include a dip in the simulation line at approximately 1.6 gigahertz and another at 2.4 gigahertz. The legend indicates the line styles for simulation and measurement. The graph highlights differences in reflection coefficient behavior between the simulated and measured data across the frequency spectrum.
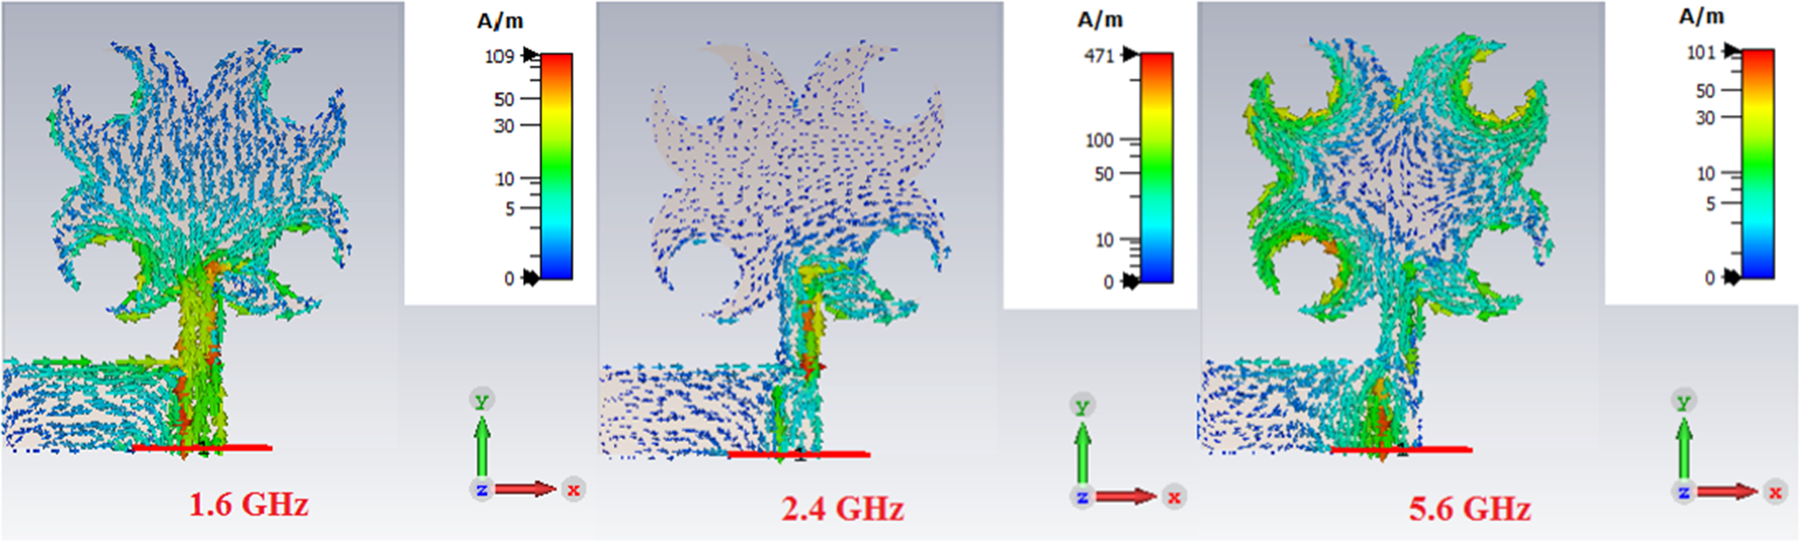
The measured result for the impedance matching of the second band frequency is slightly pushed upward, but still below 10 dB, while the remaining bands match the results of the simulation. Additionally, the performance of the suggested slotted antenna is examined using the surface current distribution at the triple-band frequencies of 1.6, 2.4, and 5.6 GHz. Figure 4 shows the results of a simulation conducted on the surface current of the suggested antenna at three different operating frequencies. At its lower band frequency of 1.6 GHz, it is seen that the current vector is primarily dispersed on the lower part of the antenna radiator. Similar to this, the group of current vectors is directed on the 2.4 GHz frequency band, which is produced by an open-ended, inverted L-shaped slot. On the borders of the symmetrical circular open slots, which largely resonate with the operating frequency of 5.6 GHz, is where the major current dispersion is found. Additionally, it should be verified by the surface current distribution that the suggested compact planar slotted monopole antenna is tuned independently and operating at the most practical triple-band frequencies.
Surface current distribution of proposed antenna at three resonant frequencies.

Figure 4 Long description
Surface current distribution of proposed antenna at three resonant frequencies. No X/Y axes are present; interpretation is via colorbar and vectors. At 1.6 gigahertz, the highest current magnitude is near the feed point and narrow stem, with vectors indicating direction. At 2.4 gigahertz, current is concentrated around the feed and neck, with less intensity in the upper arms. At 5.6 gigahertz, the current is strongest in the upper branching arms and midsection, with a high-current band across the midsection. The color scale indicates current magnitude in A/m, ranging from 0 to 50. Arrows show current direction and relative magnitude. The distribution shifts from lower feed and neck regions at 1.6 and 2.4 gigahertz to broader upper-region activity at 5.6 gigahertz.
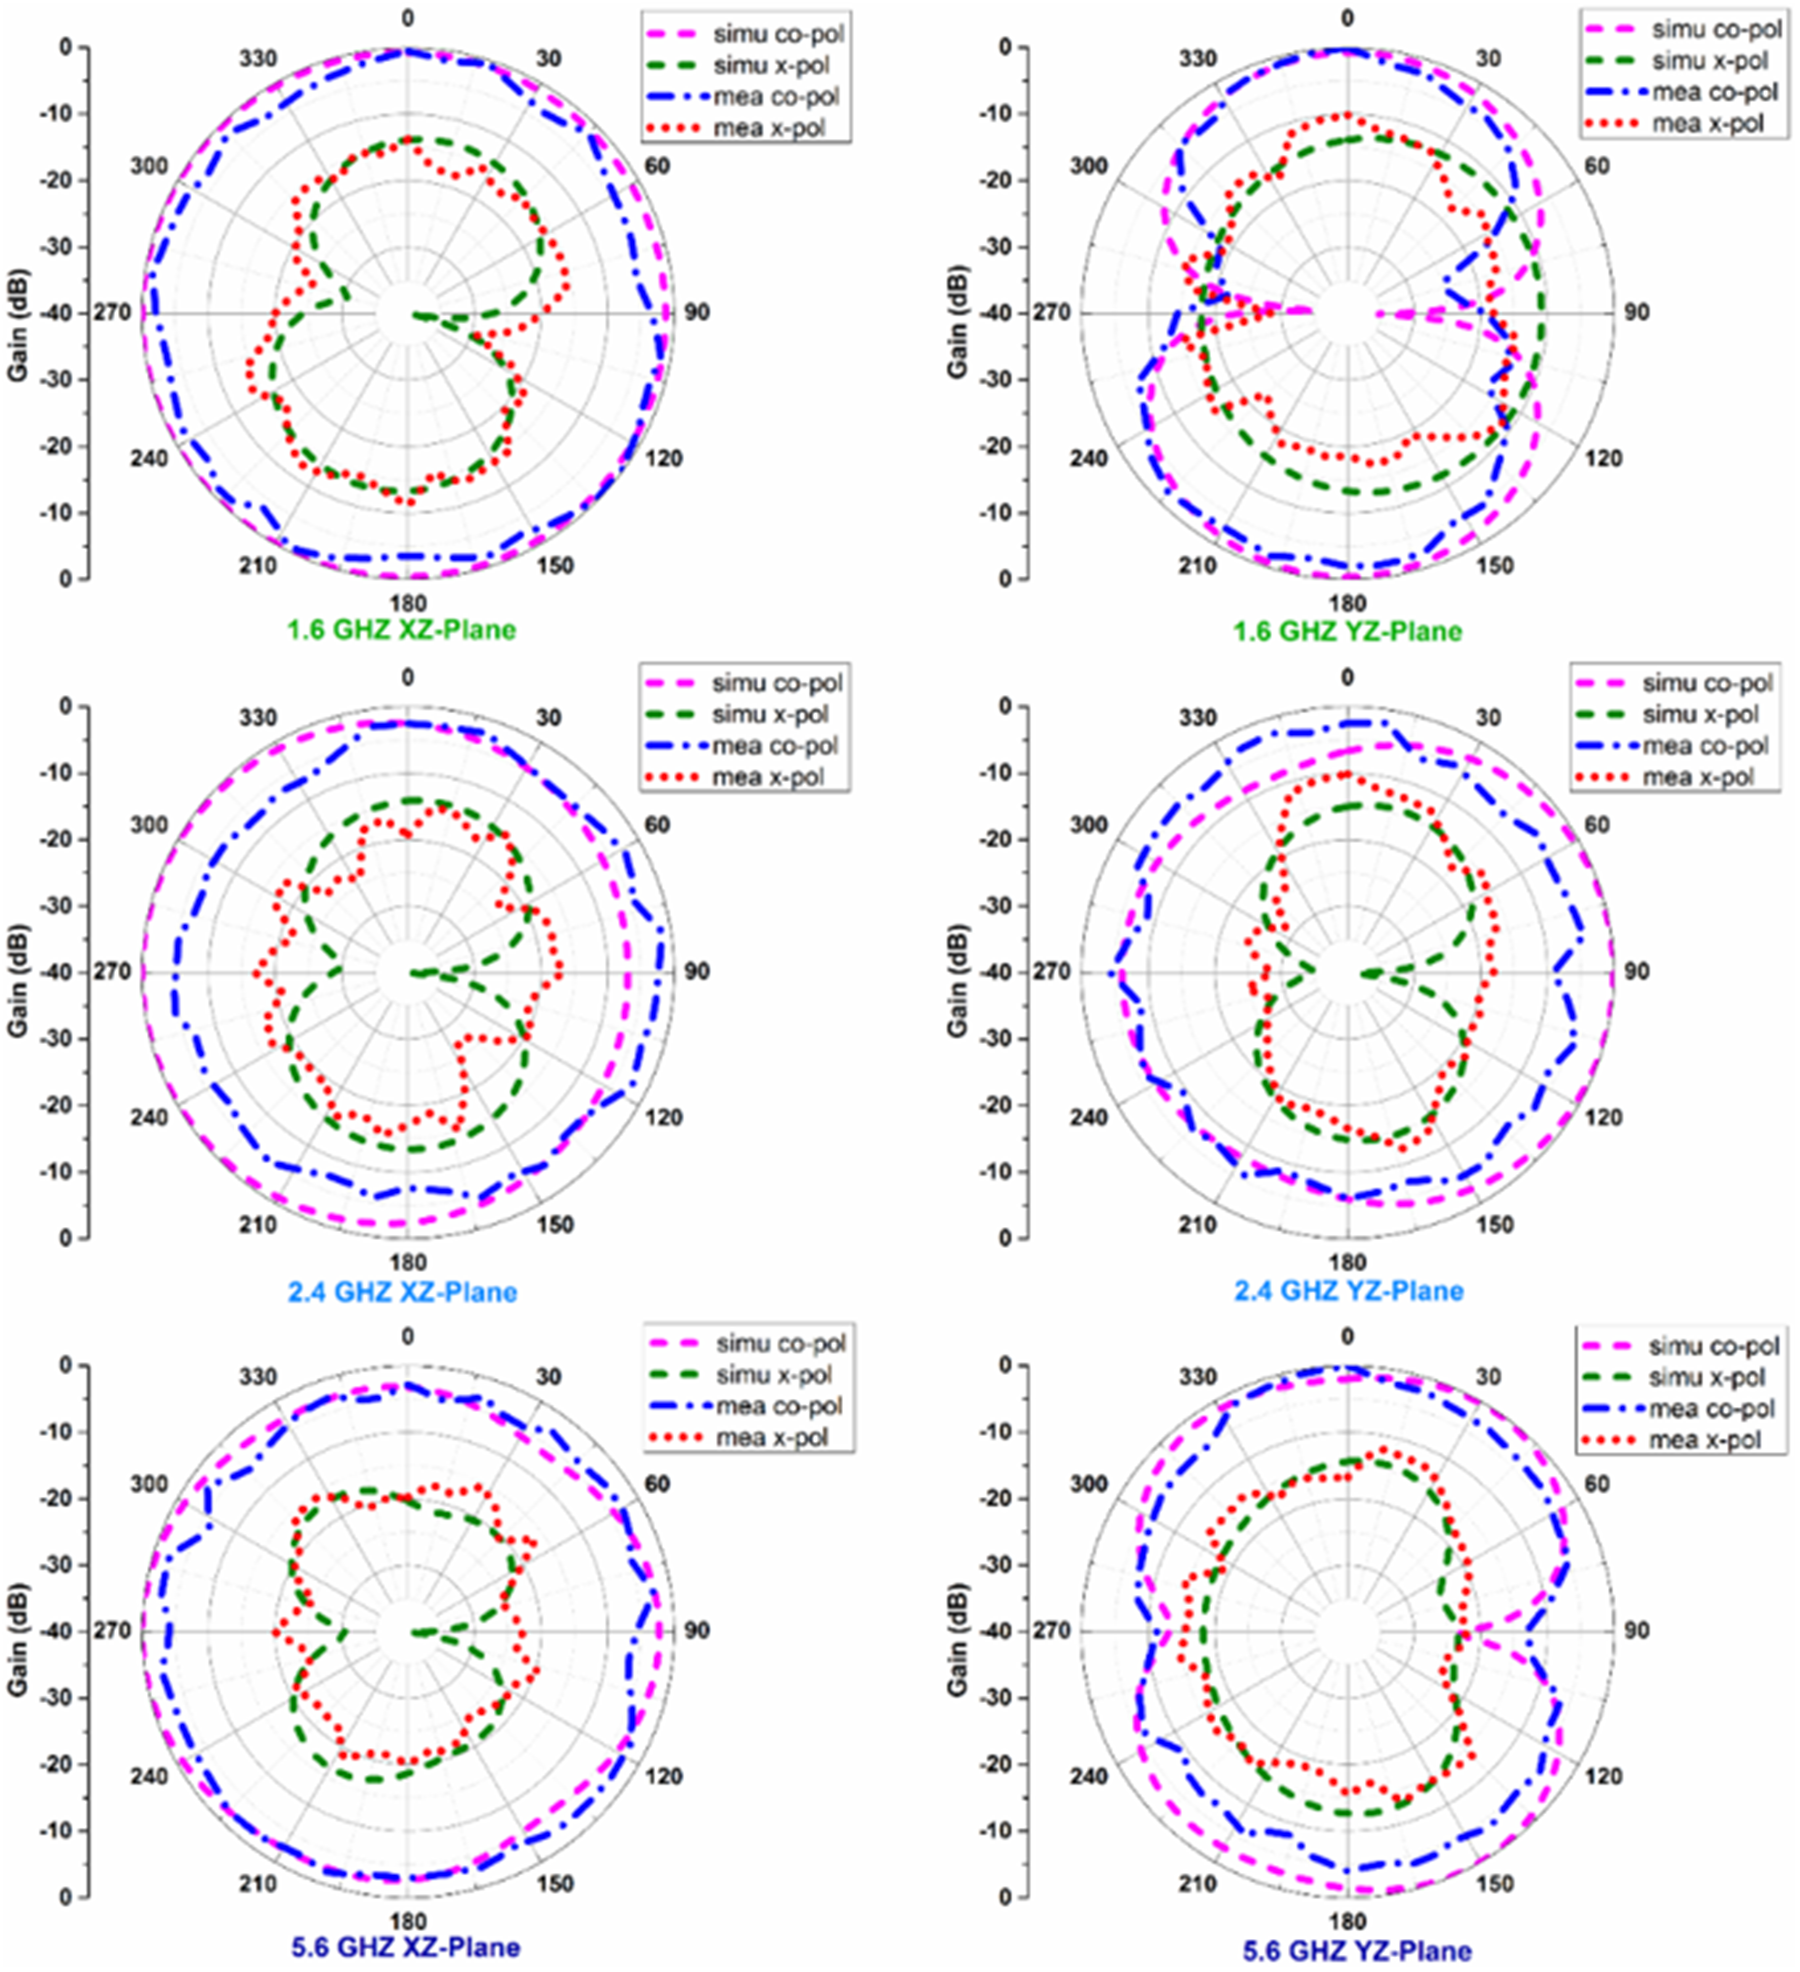
Figure 5 shows the simulated and measured radiation patterns of the proposed antenna at the two primary planes, the H-plane (YZ-plane,  $\phi$=
 $90^0$) and the E-plane (XZ-plane,
 $\phi$=
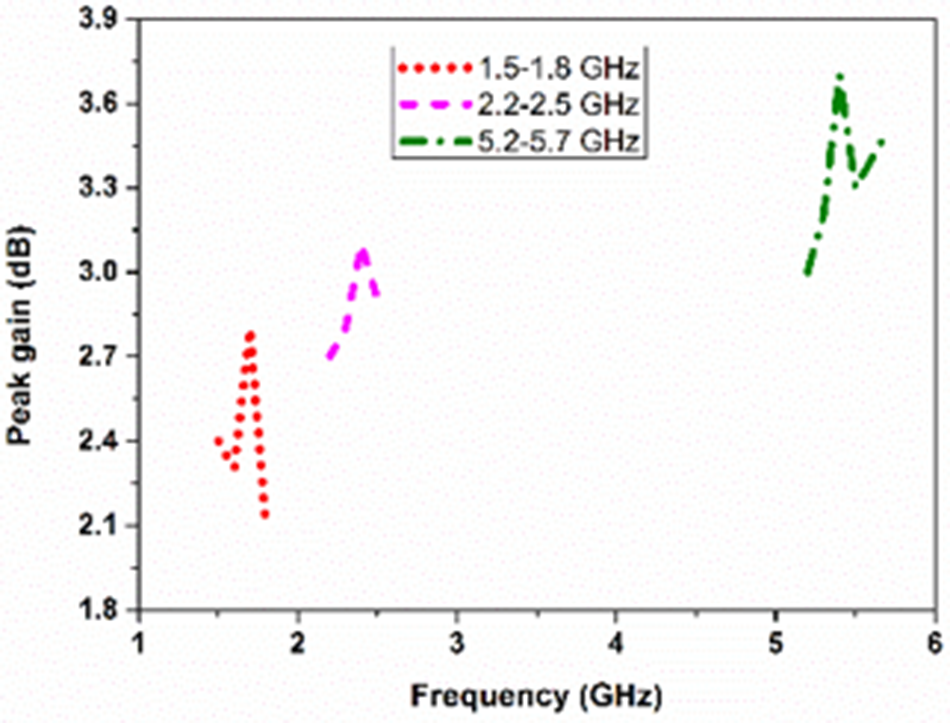
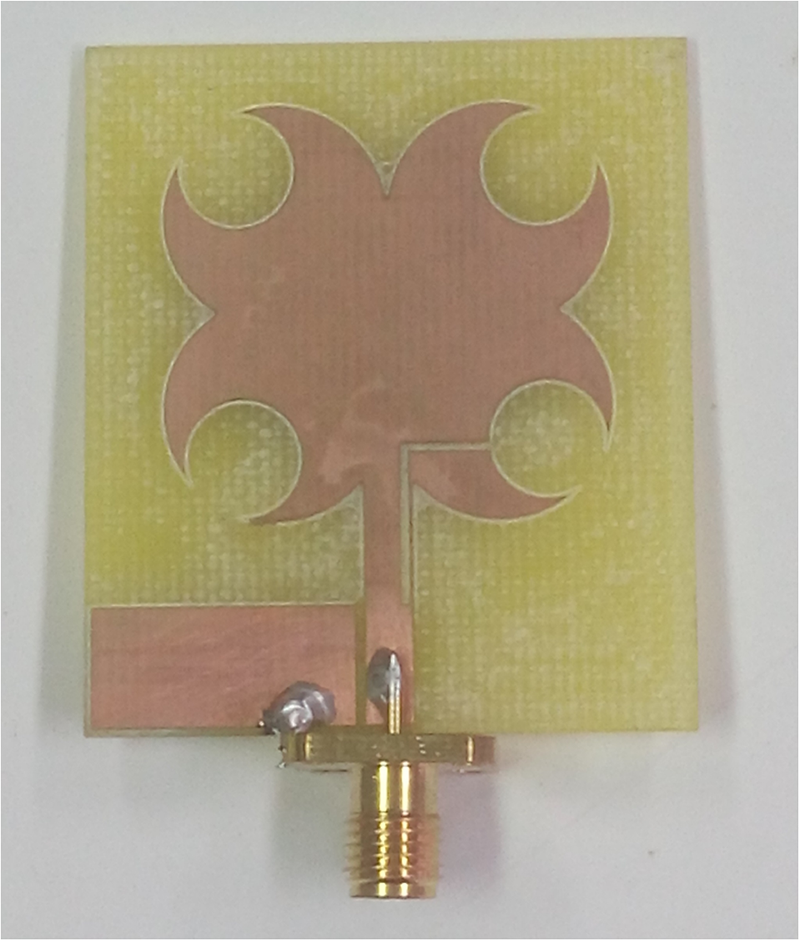
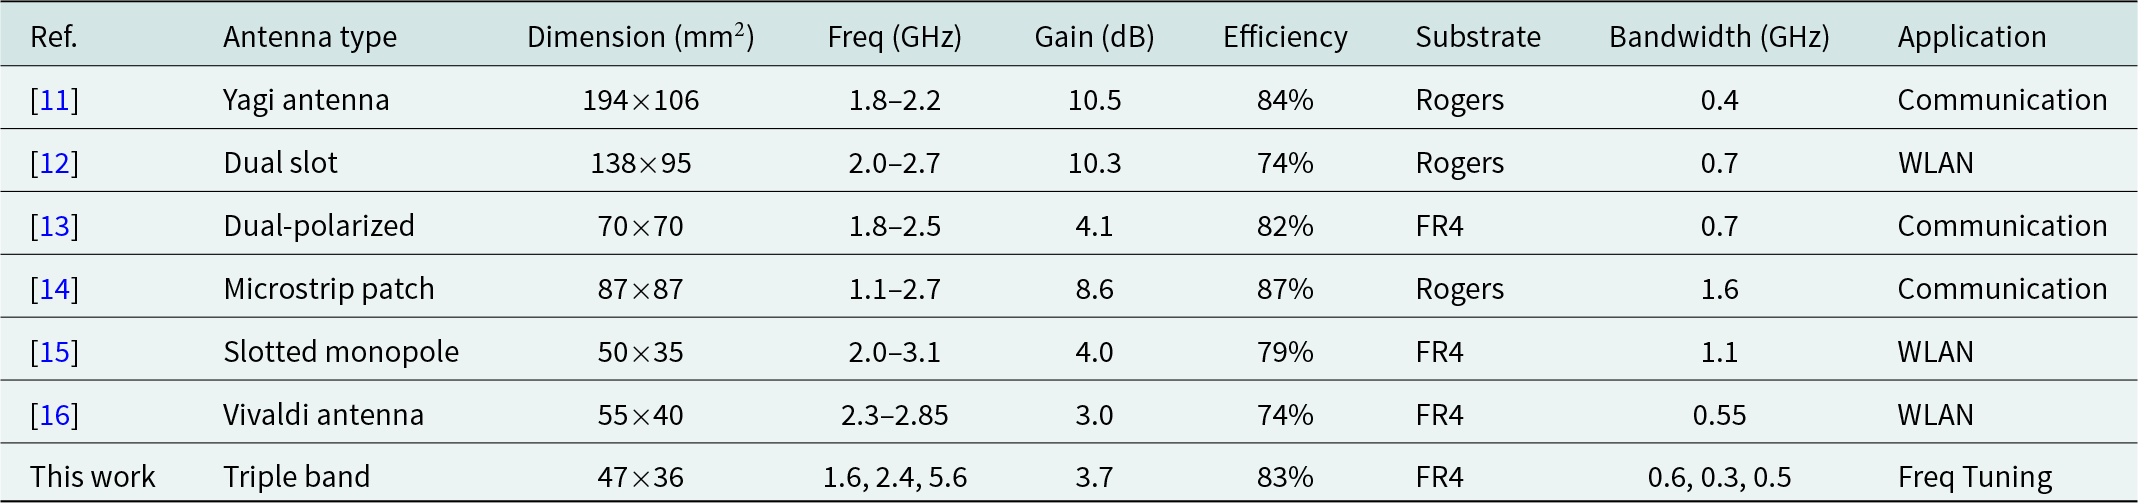
 $0^0$), at three resonating frequencies. The proposed monopole antenna’s radiation patterns, which are appropriate for portable mobile or tablet devices, exhibit bi-directional patterns in the YZ-plane and omnidirectional patterns in the XZ-plane. Gain and radiation patterns are measured using a typical double-ridged broadband transmitting horn antenna with a gain variation of 2–20 dB in the 1.0–20 GHz frequency range. Three operating frequencies are covered by the far-field condition because of the selected distance between the transmitting and receiving antennas. In comparison to the co-polarization (co-pol) of three operating frequencies, a cross-polarization (x-pol) of less than 10 dB was achieved in both planes through simulation and measurement. Figure 6 shows the measured peak gains of the proposed slotted antenna at three operating frequencies. At equivalent frequencies of 1.6, 2.4, and 5.6 GHz, respectively, the antenna peak gains of 2.8, 3.1, and 3.7 dB are attained. Table 1 compares the proposed slotted antenna with recently published multiband antennas. Despite having a smaller antenna, [Reference Bakariya, Santanu, Manas and Mandal7] uses two substrates to implement it. The peak gain of 3.7 dBi was obtained at 5.6 GHz. It was measured in the anechoic chamber using the E8363C PNA network analyzer. The fabrication photograph of the proposed antenna is shown in Figure 7. The proposed antenna has three advantages over existing multiband antennas: smaller size, increased gain, and single substrate use. The proposed antenna’s symmetrical quatrefoil design results in steady radiation patterns. The slots in the shape of a crescent moon are accurately carved at the margins of circles that have comparable diameters. The slotted circles in the shape of a crescent moon produce reliable triple bands with good impedance matching. For every resonant frequency, a realized gain of over 2 dB was attained. Applications involving wireless power transfer and energy harvesting can benefit from the antenna proposed in this paper. For a variety of microwave communication applications, this antenna can be readily combined with other microwave devices such as rectifiers, diplexers, and filters, etc. Wireless communication and RF energy harvesting are further possible applications for the proposed antenna. We have a lot of RF power available from cell towers and Wi-Fi routers everywhere in an environment with short distances. The rooftop of a building is where the cell towers are located in an urban setting. Wirelessly connected low-power electronic devices can be powered by this wasted RF energy if it is used appropriately. RF energy harvesting and wireless power transmission make it feasible. The receiving antenna, load resistor, rectifier, DC pass filter, and impedance matching network make up the apparatus known as the antenna. A matching network and a high-efficiency rectifier are required to install a full rectenna. The most exciting technologies nowadays are wireless power transfer and RF energy harvesting. The Internet of Things, autonomous wireless sensor networks, and low-power electrical devices can all benefit from this energy. One device that can be used to receive electromagnetic power from ambient RF sources and transform it into DC power is the rectenna (rectifier+antenna). The GSM1800 MHz band is commonly utilized in cellular communication systems and has a 1 W (30 dBm) radiation output. When it comes to wireless power transfer and RF energy harvesting, the receiving antenna is crucial. because environmental sources could provide it with radiofrequency radiation. Wi-Fi routers and cellular base stations provide us with a large amount of low-input RF power in the surroundings. Multiband, multipolarized, omnidirectional, and broad beam efficiency receiving antennas are needed to extract these low RF power-high gain signals. Since transmitting and receiving antennas are not electromagnetically coupled to one another in far-field applications, coupling efficiency is not necessary in this case. The implementation of the rectenna involves merely matching the rectifying circuit’s input impedance to the antenna’s input impedance. In the construction of the rectifier, the impedance matching network is a crucial secondary function. Microstrip transmission lines are used in the design of the matching circuit. A two-port distributed network, the transmission line is useful for moving electromagnetic energy from one location to another. It must match the antenna’s input impedance to the rectifier’s input impedance in order to transfer the most power possible from the receiving antenna to therectifier.
Simulation and measured normalized radiation patterns.

Figure 5 Long description
Simulation and measured normalized radiation patterns. Six polar line plots show gain patterns for two planes at three frequencies. Each plot overlays four series labeled: simu co-pol, simu x-pol, mea co-pol, mea x-pol. Shared axes for all six plots: The radial axis is labeled Gain (dB) with labeled rings at 0, minus 10, minus 20, minus 30 and minus 40. The angular axis is labeled in degrees with tick labels 0, 30, 60, 90, 120, 150, 180, 210, 240, 270, 300 and 330. At 1.6 GHz, XZ-Plane: The co-polarization curves (simu co-pol and mea co-pol) form a near-circular ring close to the 0 dB outer ring, with small deviations around the circle. The cross-polarization curves (simu x-pol and mea x-pol) lie further inward, forming a two-lobed shape with the curve closer to the center near 90 degrees and 270 degrees and farther from the center near 0 degrees and 180 degrees. At 1.6 GHz, YZ-Plane: The co-polarization curves form a broader, less circular outline than in the XZ-Plane, with the curve farther from the center around 0 degrees and 180 degrees and closer to the center around 90 degrees and 270 degrees. The cross-polarization curves remain inside the co-polarization curves and show a two-lobed shape, with inward dips near 90 degrees and 270 degrees. At 2.4 GHz, XZ-Plane: The co-polarization curves again trace a near-circular ring close to 0 dB with small ripples. The cross-polarization curves are inside and show a two-lobed pattern, with the curve closer to the center near 90 degrees and 270 degrees and farther from the center near 0 degrees and 180 degrees. At 2.4 GHz, YZ-Plane: The co-polarization curves form an outline that is less circular than the XZ-Plane, with the curve farther from the center near 0 degrees and 180 degrees and closer to the center near 90 degrees and 270 degrees. The cross-polarization curves remain inside and show inward dips near 90 degrees and 270 degrees. At 5.6 GHz, XZ-Plane: The co-polarization curves remain near the 0 dB ring with visible undulations around angle. The cross-polarization curves are inside and show a two-lobed pattern, with inward regions near 90 degrees and 270 degrees. At 5.6 GHz, YZ-Plane: The co-polarization curves form a less circular outline than the XZ-Plane, with the curve farther from the center near 0 degrees and 180 degrees and closer to the center near 90 degrees and 270 degrees. The cross-polarization curves remain inside and show inward dips near 90 degrees and 270 degrees.
Measured gain of the proposed antenna.

Fabrication photograph of the proposed antenna.

Comparison of the proposed triple-band antenna with recently reported antennas

Table 1 Long description
The table compares several published antennas by type, physical size, operating frequency range, gain, efficiency, substrate, bandwidth, and intended application. Sizes range from 194 by 106 millimeters for a Yagi antenna down to 47 by 36 millimeters for the proposed triple-band design, making the proposed design the most compact. The highest gain is reported for the Yagi and dual-slot designs at about 10 dB, while most FR4-based designs have gains around 3 to 4 dB. Efficiency spans from 74 percent to 87 percent; the proposed triple-band antenna is 83 percent, higher than several FR4 designs and close to the best results. Bandwidth varies widely: the microstrip patch covers the broadest continuous span at 1.6 GHz, while the proposed design provides three separate bands with bandwidths of 0.6, 0.3, and 0.5 GHz. Substrates are mainly Rogers or FR4, with the proposed design using FR4. Applications differ, with most targeting communication or WLAN, while the proposed antenna emphasizes frequency tuning across three bands.
Dual-band antennas for wireless communication
Antenna design details
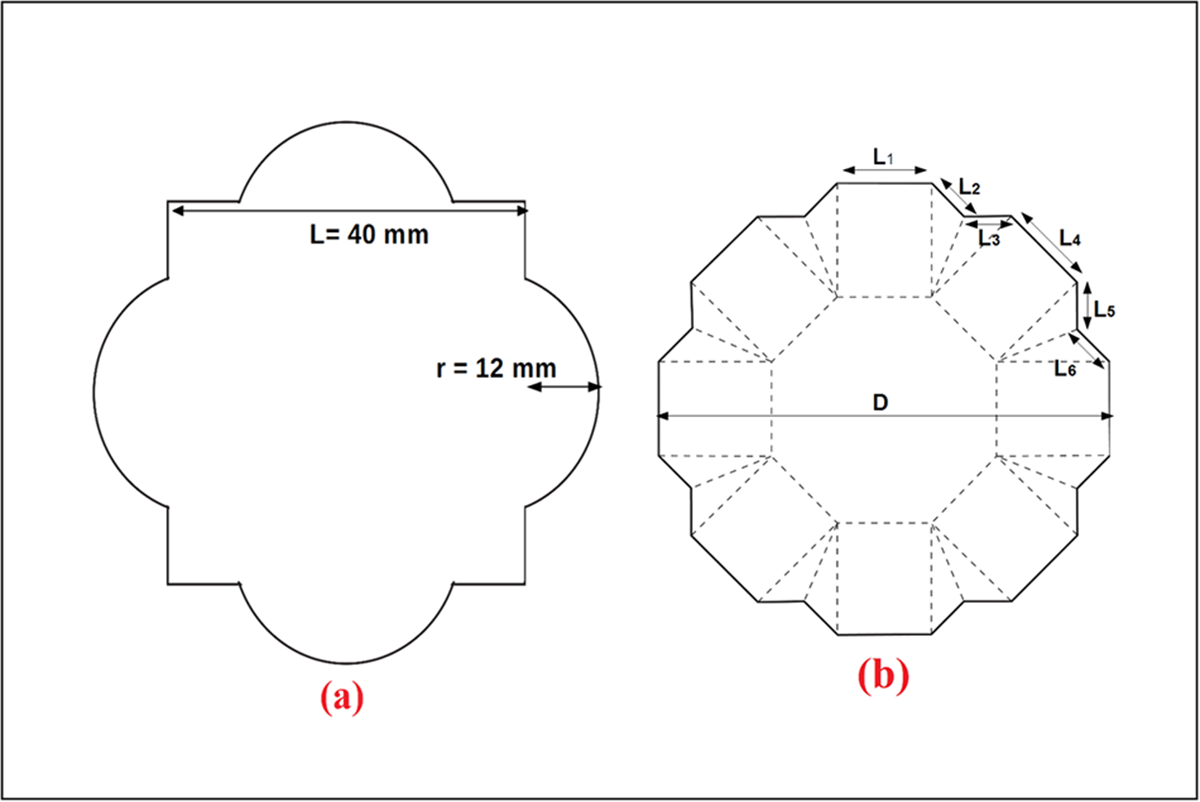
The proposed slot antennas’ basic design geometry is shown in Figure 8. As seen in Figure 8(a), the quatrefoil shape consists of four concentric circles with an equal radius of  $r$ = 12 mm and one square with a side length of
 $L$ = 40 mm.
The basic geometry of the proposed antennas: (a) antenna-1 and (b) antenna-2. The side lengths of antenna-2 are L $_{1}$ = 10 mm, L
 $_{2}$ = 7 mm, L
 $_{3}$ = 5 mm, L
 $_{4}$ = 7 mm, L
 $_{5}$ = 5 mm, L
 $_{6}$ = 7 mm, and diameter D = 50 mm.

However, the symmetrical structure of 24-sided polygon with the side lengths of L $_{1}$ = 10 mm, L
 $_{2}$ = 7 mm, L
 $_{3}$ = 5 mm, L
 $_{4}$ = 7 mm, L
 $_{5}$ = 5 mm, L
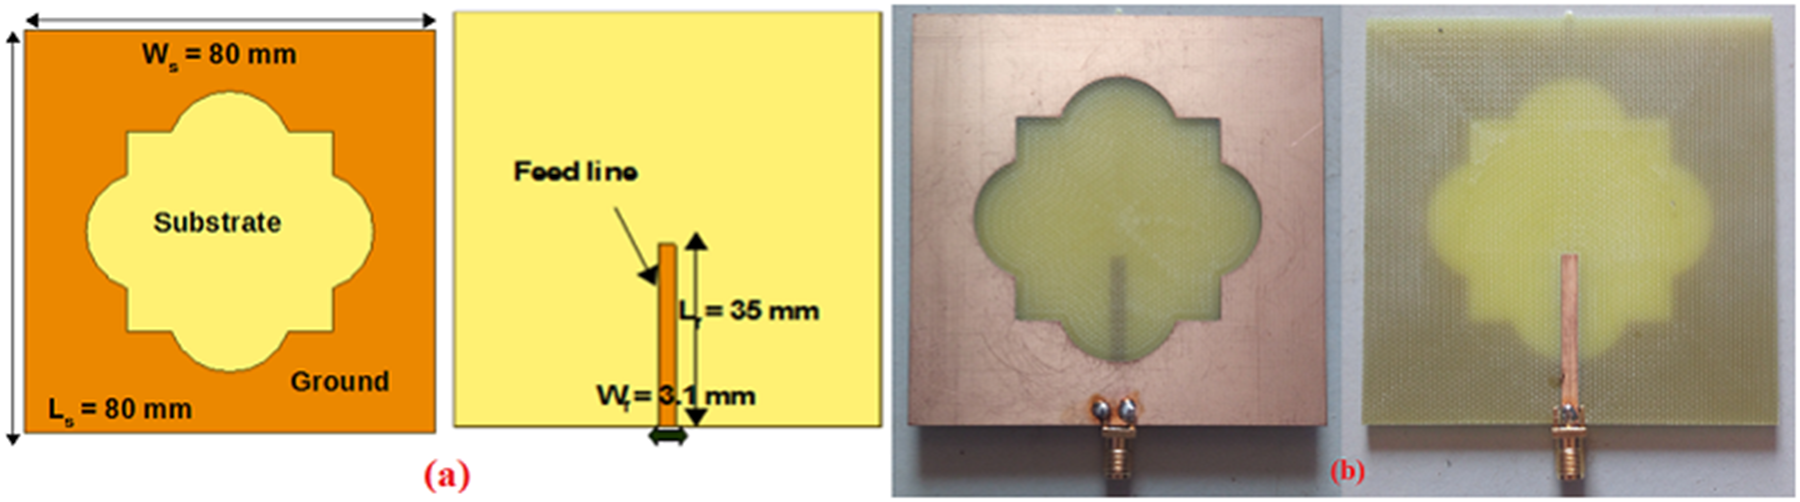
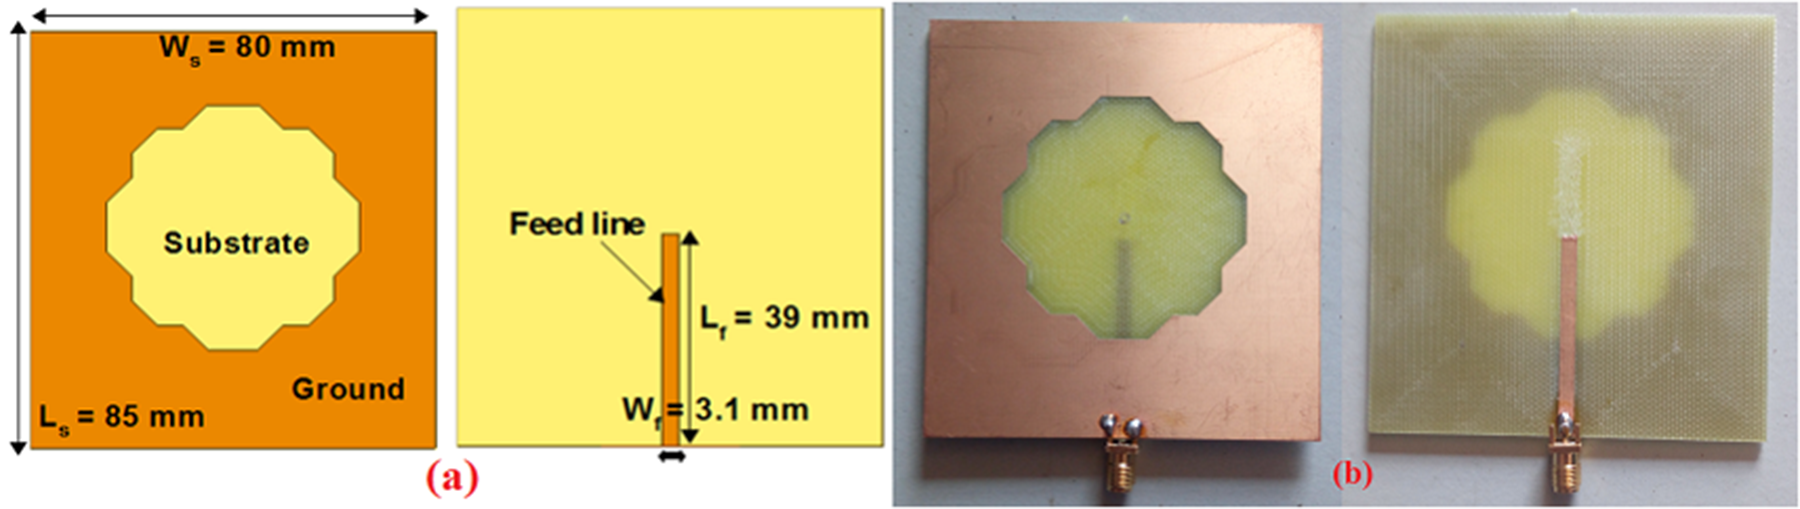
 $_{6}$ = 7 mm, and the diameter of D = 50 mm as shown in Figure 8(b). The schematic and fabrication prototypes of a compact dual-band slot antenna for wireless power transmission and communication are shown in Figure 9 and Figure 10. The antennas are designed on the FR4 substrate with a dielectric constant of 4.3 and a thickness of 1.6 mm. The substrate dimension of antenna-1 is 80 mm
 $\times $ 80 mm (
 $L_{s}$
 $\times $
 $W_{s}$) and antenna-2 is 85 mm
 $\times $ 80 mm (
 $L_{s}$
 $\times $
 $W_{s}$). Similarly, the length of the feed line for antenna-1 is 35 mm and for antenna-2 is 39 mm, respectively. The dual-band slot is excited by the 50
 $\Omega$ feed line of width
 $W_{f}$ = 3.1 mm.
Configurations of the proposed antenna-1: (a) schematic and (b) fabrication prototypes.

Configurations of the proposed antenna-2: (a) schematic and (b) fabrication prototypes.

Simulation and measurement results
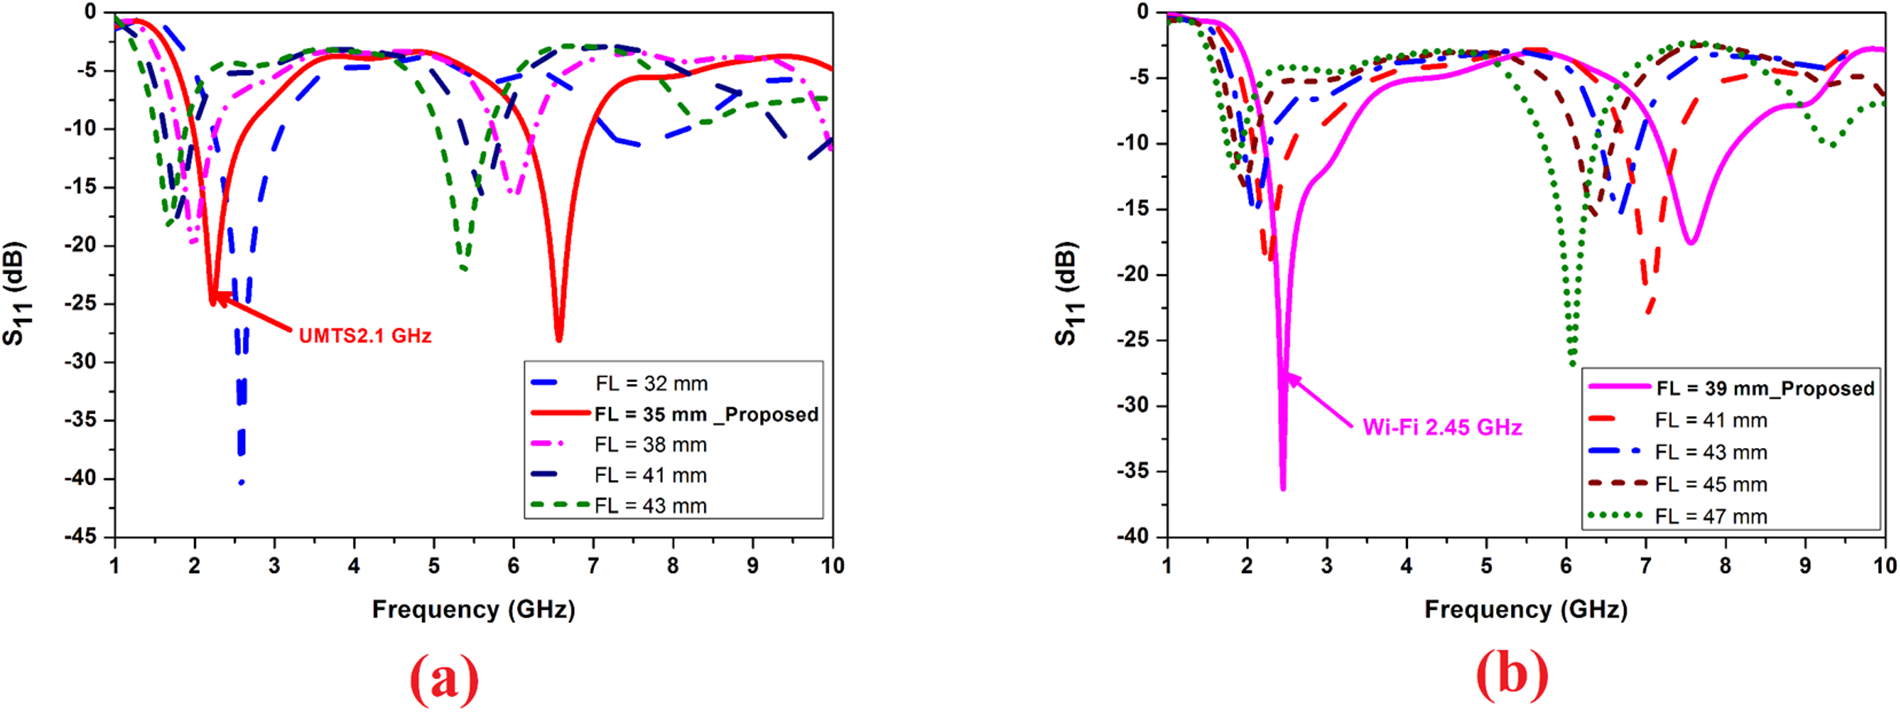
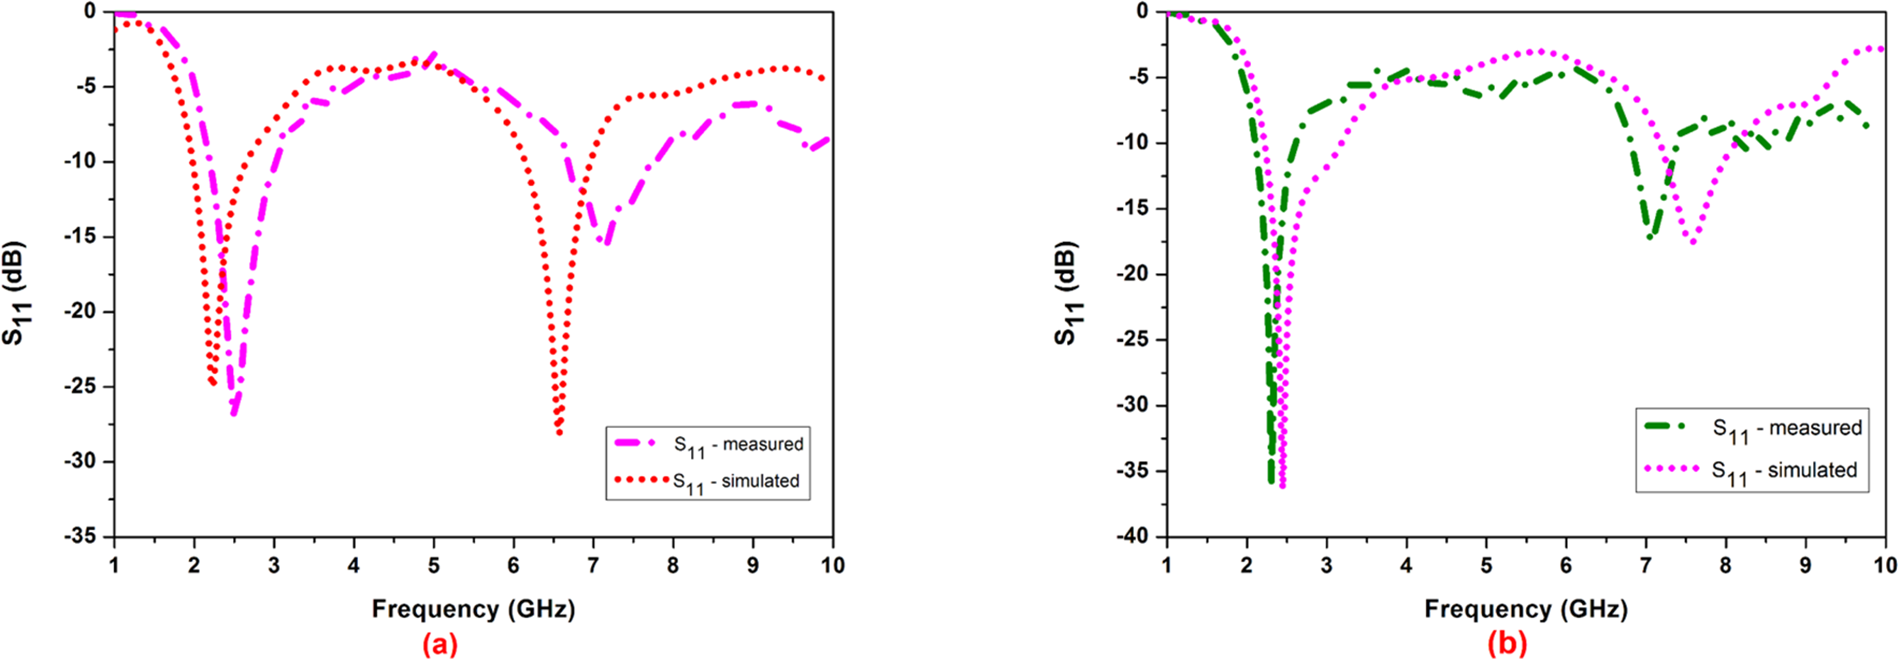
The CST Microwave Studio full-wave simulator is used to develop and simulate the proposed dual-band slot antennas based on their fundamental geometry. The Agilent Technologies E8363C PNA network analyzer is used for measurement. Figure 11 illustrates how the reflection coefficient  $S_{11}$ varies with two antennas’ varying FLs. At FL = 35 mm, the proposed antenna-1 resonates the consistent dual band of 2.16 and 6.57 GHz with
 $S_{11}$
 $\geq$
 $-$25 dB for both bands.
Simulated reflection coefficient  $S_{11}$ varies with the FL: (a) antenna-1 and (b) antenna-2.

Figure 11 Long description
The image A showing a line graph with the y-axis labeled S11 (decibel) and the x-axis labeled Frequency (gigahertz). The x-axis runs from 1 to 10 with tick marks at 1, 2, 3, 4, 5, 6, 7, 8, 9 and 10. The y-axis runs from 0 to minus 45 with tick marks at 0, minus 5, minus 10, minus 15, minus 20, minus 25, minus 30, minus 35, minus 40 and minus 45. A legend lists five curves: FL equals 32 millimeter, FL equals 35 millimeter Proposed, FL equals 38 millimeter, FL equals 41 millimeter and FL equals 44 millimeter. Each curve shows a deep dip between about 2 and 3 gigahertz and another dip between about 6 and 8 gigahertz. The FL equals 35 millimeter Proposed curve has a dip near about 2.2 gigahertz reaching about minus 25 decibel and a second dip near about 6.6 gigahertz reaching about minus 25 decibel. The other feed-length curves show similar dip locations with different depths, with some curves reaching below minus 30 decibel near the lower-frequency dip and dips between about minus 10 and minus 25 decibel in the higher-frequency region. The image B showing a line graph with the y-axis labeled S11 (decibel) and the x-axis labeled Frequency (gigahertz). The x-axis runs from 1 to 10 with tick marks at 1, 2, 3, 4, 5, 6, 7, 8, 9 and 10. The y-axis runs from 0 to minus 45 with tick marks at 0, minus 5, minus 10, minus 15, minus 20, minus 25, minus 30, minus 35, minus 40 and minus 45. A legend lists five curves: FL equals 39 millimeter Proposed, FL equals 41 millimeter, FL equals 43 millimeter, FL equals 45 millimeter and FL equals 47 millimeter. The curves show a deep dip between about 2 and 3 gigahertz and another dip between about 6 and 8 gigahertz. The FL equals 39 millimeter Proposed curve has a dip near about 2.5 gigahertz reaching about minus 40 decibel and a second dip near about 7.0 gigahertz reaching about minus 25 decibel. The other feed-length curves show similar dip locations with varying depths, including several curves with the lower-frequency dip between about minus 20 and minus 35 decibel and higher-frequency dips between about minus 10 and minus 30 decibel.
Nevertheless, with FL = 39 mm, the suggested antenna-2 operates on the double-band of 2.45 and 7.56 GHz with  $S_{11}$
 $\geq$
 $-$18 dB on the two bands, respectively. RF power from mobile and lower Wi-Fi bands can be harvested using the first band of two antennas. In a similar way, communication can be facilitated by another band of two antennas. It is significant to note that, due to the symmetrical construction of the suggested slots and an appropriate ground plane, the two antennas’ reflection coefficient curves at various FLs display stable dual bands with significant bandwidth and resonance. Figure 12 displays the two suggested antennas’ modeled and tested reflection coefficient plots. The simulated findings and measured coefficient of reflection of the two antennas’ first band match quite well. However, because of soldering and fabrication tolerances, the second band of the two antennas matches simulation results with little fluctuation. When calculating the antenna received power, the receive antenna gain is a crucial component.
Simulated and measured reflection coefficient of proposed antennas: (a) antenna-1 and (b) antenna-2.

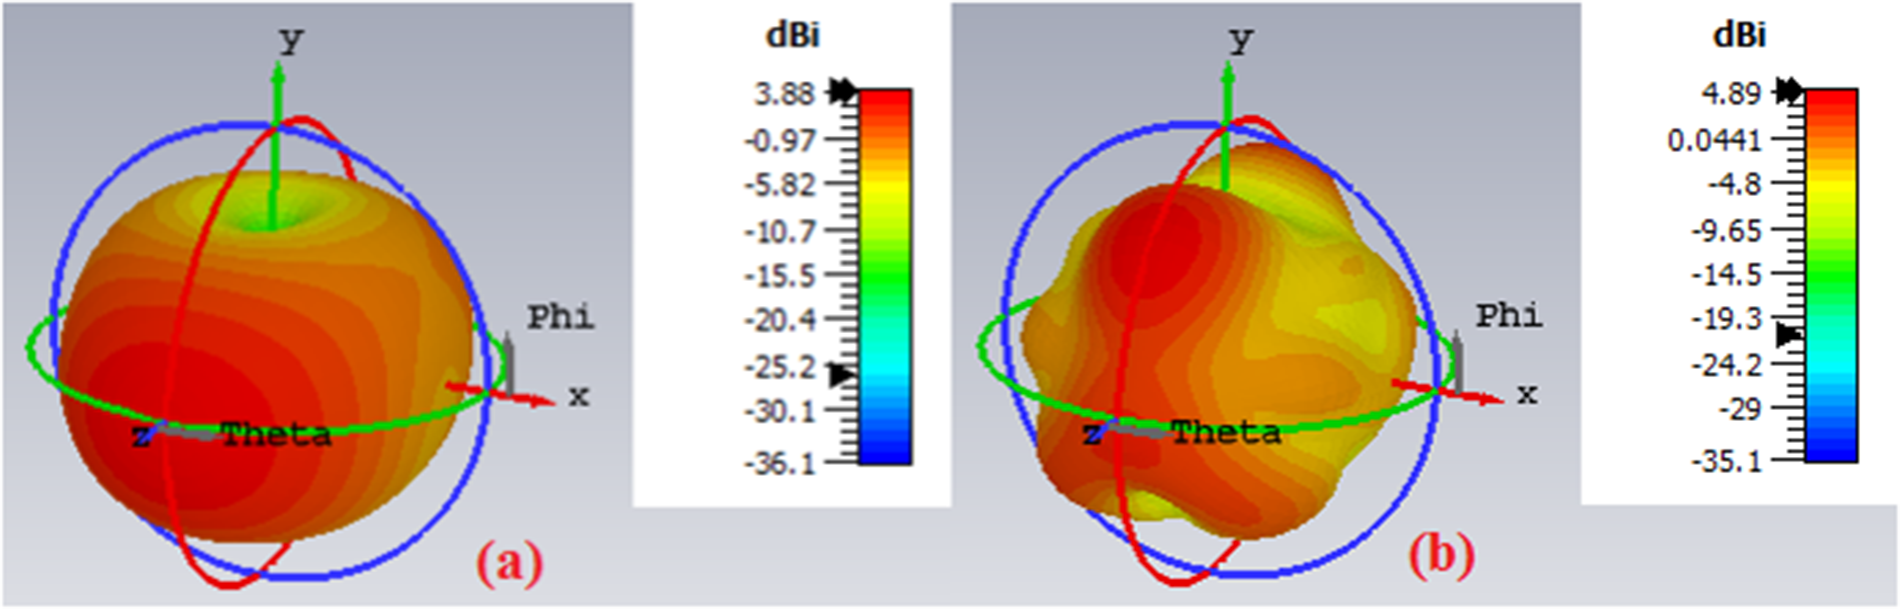
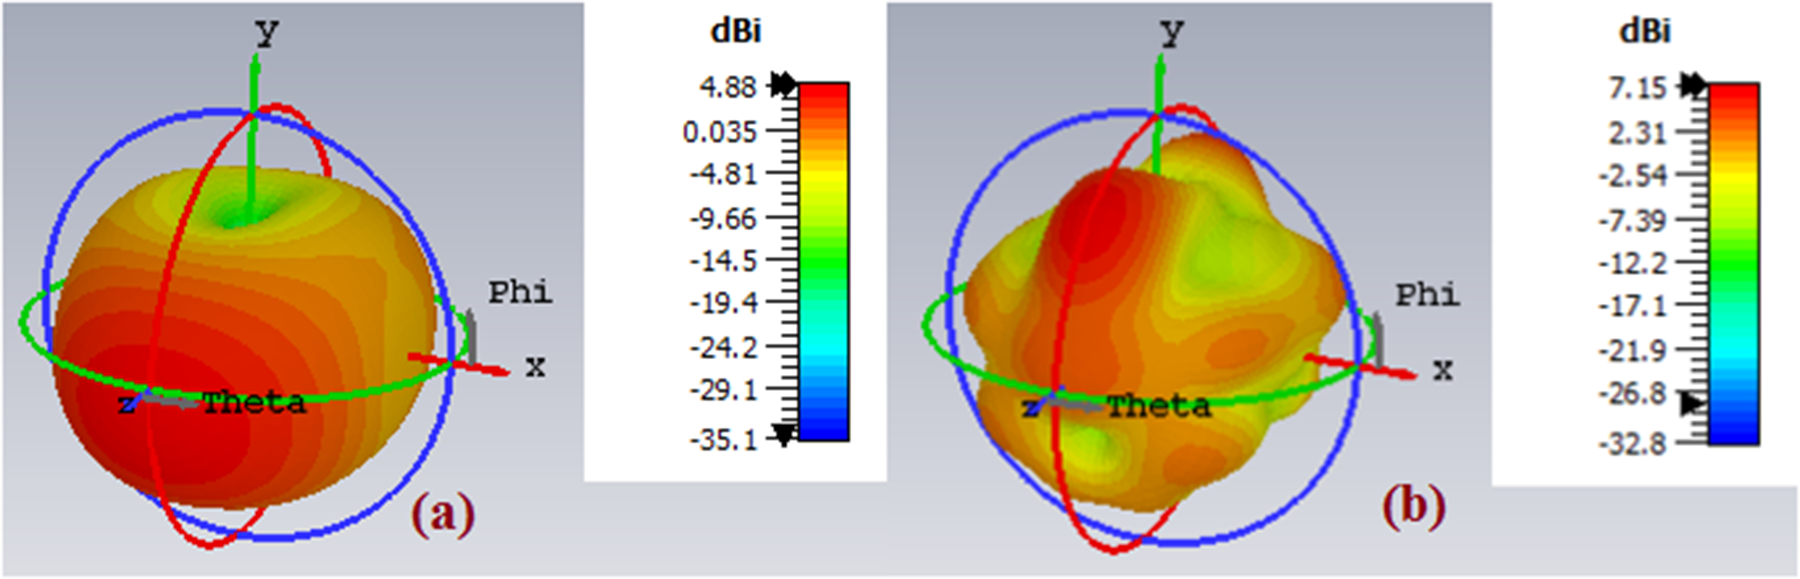
Figure 13 and Figure 14 depict the simulated 3D-gain radiation patterns of the suggested antennas. The square slot of the suggested antenna-1 resonates at the fundamental frequency of 2.3 GHz with a slot length of L = 40 mm (from Figure 8), as determined theoretically using equation (1).
 \begin{equation}
f=\frac{c}{2L} \sqrt{\frac{2}{\epsilon_{r}+1}}
\end{equation}
Simulated 3D-gain radiation patterns of the proposed antenna-1: (a) 2.16 GHz and (b) 6.57 GHz.

Figure 13 Long description
Panel (a) shows a simulated 3D-gain radiation pattern for an antenna at 2.16 GHz. The plot uses spherical angles Phi and Theta, typically in degrees, to represent azimuth and elevation. The gain is measured in decibels isotropic (dBi), with a color scale ranging from minus 36.1 to 3.89. The pattern features a dominant main lobe, indicating high directivity. Panel (b) displays the pattern at 6.57 GHz, with Phi and Theta as axes. The gain scale ranges from minus 35.1 to 4.89 dBi. This pattern shows multiple lobes and less symmetry, suggesting more sidelobes and a broader distribution. The main lobe direction is not specified. The comparison highlights differences in directivity and lobe structure between the two frequencies.
Simulated 3D-gain radiation patterns of the proposed antenna-2: (a) 2.45 GHz and (b) 7.56 GHz.

Figure 14 Long description
The image shows two 3D gain radiation pattern plots labeled as a and b, each displaying simulated antenna gain in dBi mapped across angular directions Phi and Theta in degrees. The spatial orientation of each plot is defined by three axes labeled X, Y and Z, representing orthogonal directions in three-dimensional space. The angular coordinates Phi and Theta define the direction of radiation relative to these axes. Gain magnitude at each direction is represented by both the surface height and the color scale shown in the vertical color bar on the right side of each plot. In plot a, corresponding to 2.45 GHz, the color bar scale ranges from approximately plus 5 dBi at the maximum to minus 35.1 dBi at the minimum. The radiation pattern shows a single dominant lobe that is relatively broad, with the peak gain of approximately plus 5 dBi. The pattern appears nearly hemispherical with moderate directivity and the main lobe is oriented roughly along the positive Z direction. In plot b, corresponding to 7.56 GHz, the color bar scale ranges from approximately plus 7 dBi at the maximum to minus 32.8 dBi at the minimum. The radiation pattern at this frequency shows a more complex structure compared to plot a, with a higher peak gain of approximately plus 7 dBi. The main lobe at 7.56 GHz appears narrower and more directional than at 2.45 GHz. Notable differences between the two plots include a higher peak gain in plot b, a more directional beam shape at 7.56 GHz and a more uniform hemispherical distribution at 2.45 GHz. Both plots share the same axis orientation with Phi and Theta angular labels visible on the outer ring structures of the 3D pattern display.
Additionally, for the symmetrical structure and to create the dual-bands, four circular slots with an equal radius of 12 mm are added to the square slot. Nonetheless, the circular slot’s dimension of D = 50 mm (from Figure 8) and resonant frequency of 1.7 GHz were also determined using the following equation (2).
 \begin{equation}
f=\frac{1.841c}{2\pi a \sqrt{\epsilon_{r}}}
\end{equation}
where  $a$ = radius of circular slot (25 mm).
Antenna-1’s simulated gain at 2.16 and 6.57 GHz is 3.88 and 4.89 dBi, respectively. Similarly, an antenna-2’s simulated gain at 2.45 and 7.56 GHz is 4.88 and 7.15 dBi, respectively. On the other hand, the network analyzer with the equation fulfilled for the far-field distance between the transmitting and receiving antennas is used to measure the gain. The measured gains were 3.27 and 4.36 dBi at antenna-1’s dual-band center frequencies and 4.15 and 6.83 dBi at antenna-2’s dual-band center frequency, respectively. Figure 15 and Figure 16 show the surface current patterns of the suggested antennas at various time periods. The two antennas’ current vectors have a positive y-direction at  $\omega$t=0º and a negative y-direction at
 $\omega$t=90º . Similarly, for the two antennas, the current distribution is seen in the negative y-direction at time instance
 $\omega$t=90º and in the positive y-direction at time instance
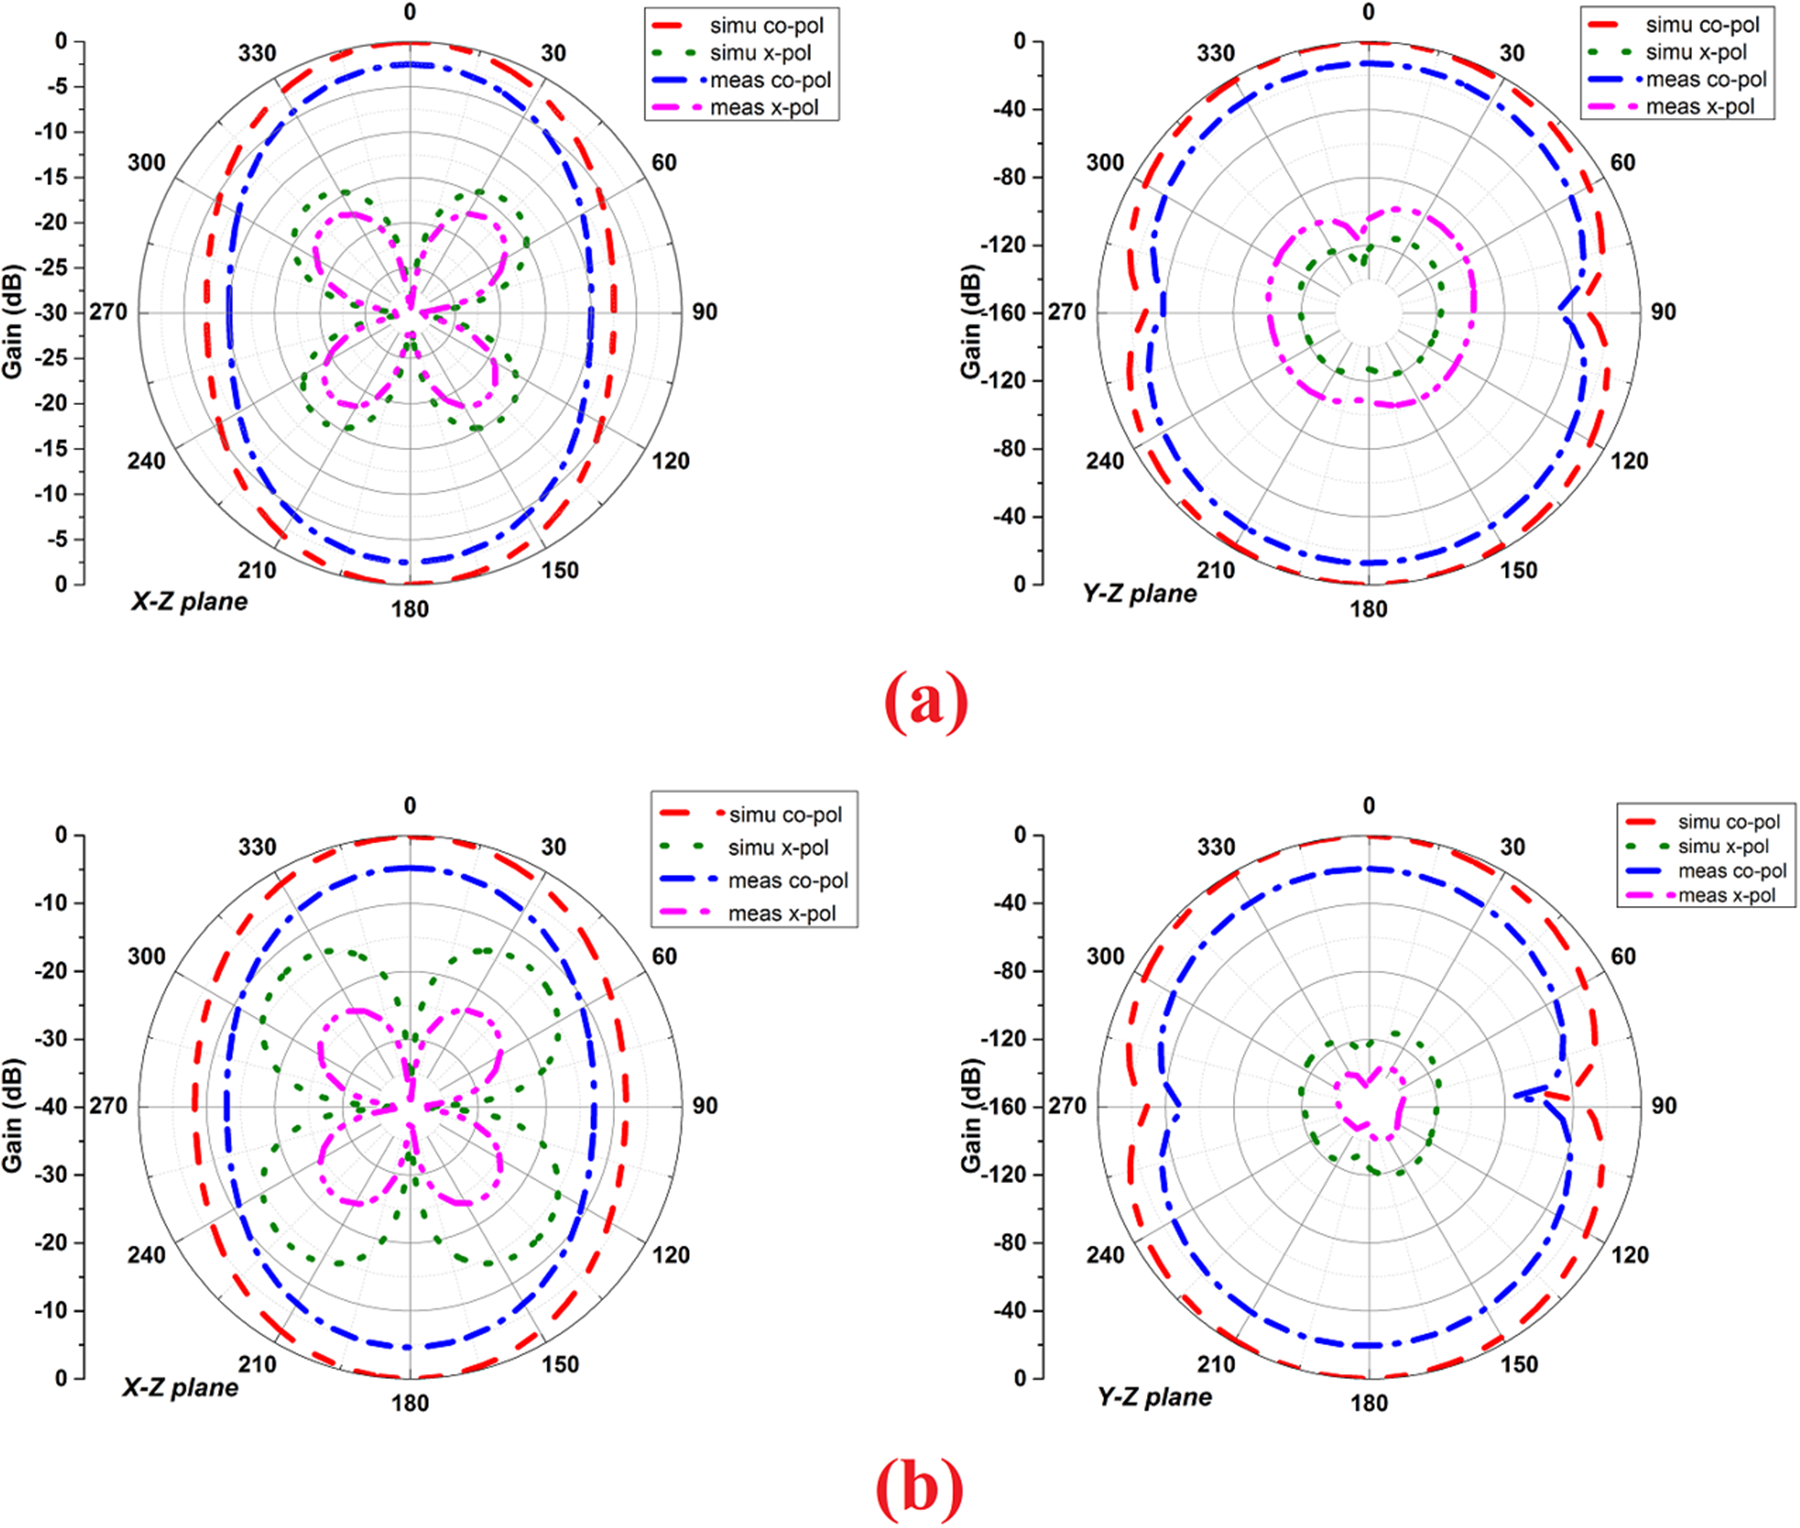
 $\omega$t=270º . At the dual-band center frequency, antenna-1’s simulated radiation efficiencies are 85.39% and 71.32%. In the same way, antenna-2’s simulated radiation efficiencies at the dual-band center frequency are 99.15% and 95.60%, respectively. Figure 17 displays the computed and measured radiation characteristics of the suggested double-band slotted antennas operating at 2.16 and 2.45 GHz energy harvesting frequencies. For innovative applications of dynamic switching of dual frequencies without the need for an external DC control signal, a self-powered frequency-tunable antenna and differential frequency reconfigurable rectifier coupled antenna can be employed successfully. In the future, circularly polarized rectifying metamaterial antennas and polarization conversion rectifying metasurfaces for Radio Frequency Energy Harvesting (RFEH) and Wireless Power Transmission (WPT) applications could be investigated. For energy harvesting, it is ideal to receive a significant quantity of electromagnetic radiation from all polarizations. Future 5G rectennas that exploit millimeter-wave energy harvesting at low input power levels are the antenna engineers’ primary emphasis. In millimeter-wave energy harvesting, the choice of substrates and rectifying diode is essential. Furthermore, the coupling of wireless communication with power electronics is an amazing field of study for applications involving simultaneous wireless data transfer and power transmission.
Surface current distributions of the proposed antenna-1 at 2.16 GHz: (a)  $\omega$t=0º, (b)
 $\omega$t=90º, (c)
 $\omega$t=180º, and (d)
 $\omega$t=270º.

Figure 15 Long description
The composite visualization contains four panels labeled a, b, c and d, each showing the surface current distribution on the same antenna structure at a distinct phase angle. No axis labels, units, or numeric scale bar are visible in any panel. The antenna outline is consistent across all panels, featuring a central body with a slotted profile and a vertical feed element at the lower center. Small arrows overlaid on the structure indicate current vector direction at each point on the surface. The relative current magnitude is indicated by the color distribution, with scale not shown. In panel a, at t equals 0 degrees, the current vectors near the feed element point in the upward direction and the highest current concentration is visible at the lower center feed region. In panel b, at t equals 90 degrees, the current vectors near the feed element reverse to point downward and the concentrated region remains at the lower center but with reversed orientation. In panel c, at t equals 180 degrees, the current distribution pattern appears similar to panel a with upward-directed vectors at the feed region and a red circular marker with crosshairs is visible near the upper right area of the antenna body. In panel d, at t equals 270 degrees, the current vectors again point downward near the feed element, consistent with the pattern seen in panel b. Across all four panels, the feed region at the lower center consistently shows the highest current concentration and the vector direction alternates between upward and downward as the phase advances by 90 degrees at each step.
Surface current distributions of the proposed antenna-2 at 2.45 GHz: (a)  $\omega$t=0º, (b)
 $\omega$t=90º, (c)
 $\omega$t=180º, and (d)
 $\omega$t=270º.

Figure 16 Long description
Four surface current distribution maps are shown for antenna-2 operating at 2.45 GHz. Each map corresponds to a distinct phase instance: A at 0 degrees, B at 90 degrees, C at 180 degrees and D at 270 degrees. No axis labels, axis units, or colorbar scale values are visible in any of the four maps. A colorbar is present along the left edge of each map, with visually distinct gradient bands indicating varying current intensity levels, but no numeric tick values or unit labels are printed on it. Each map shows a circular boundary region with a central vertical strip element and a smaller feature at the lower center, consistent across all four phase instances. At 0 degrees, the highest intensity regions are concentrated along the central vertical strip and the lower feed feature, with lower intensity distributed around the circular boundary and the surrounding background. At 90 degrees, the intensity along the central vertical strip appears reduced and the concentration shifts more toward the lower feature and portions of the circular rim. At 180 degrees, the distribution pattern resembles the 0 degree instance, with strong intensity returning to the central vertical strip and the lower feature, suggesting an inversion or repetition of the pattern observed at 0 degrees. At 270 degrees, the pattern resembles the 90 degree instance, with intensity again concentrated away from the central strip and more toward the lower feature and rim. The background surrounding the circular region shows low-level speckling across all four maps. No numeric data points, axis ranges, or colorbar values are present in the image.
Simulated and measured radiation patterns of the proposed antennas: (a) antenna-1 at 2.16 GHz and (b) antenna-2 at 2.45 GHz.

Figure 17 Long description
Two groups of polar radiation-pattern plots labeled (a) and (b). Each group contains an x-z plane plot and a y-z plane plot. Each plot overlays four series listed in the legend: simu co-pol, simu x-pol, meas co-pol, meas x-pol. The terms co-pol and x-pol appear as legend labels. The terms simu and meas appear as legend labels. Common angular scale for all plots: angle labels around the circle are 0, 30, 60, 90, 120, 150, 180, 210, 240, 270, 300, 330. Group (a). X-z plane plot. Radial axis label: Gain (dB). Radial tick labels: 0, minus 5, minus 10, minus 15, minus 20, minus 25, minus 30. The simu co-pol and meas co-pol traces form near-circular rings close to the 0 to minus 10 region, with a visible inward notch near the 90-degree direction. The simu x-pol and meas x-pol traces form a four-lobed shape centered near the origin, with lobes oriented roughly toward 45, 135, 225 and 315 degrees. Y-z plane plot. Radial axis label: Gain (dB). Radial tick labels: 0, minus 10, minus 20, minus 30, minus 40, minus 50, minus 60, minus 70, minus 80. The simu co-pol and meas co-pol traces form near-circular rings near the outer region, with a visible inward notch near the 90-degree direction. The simu x-pol and meas x-pol traces form smaller near-circular rings closer to the center. Group (b). X-z plane plot. Radial axis label: Gain (dB). Radial tick labels: 0, minus 5, minus 10, minus 15, minus 20, minus 25, minus 30. The simu co-pol and meas co-pol traces form near-circular rings close to the 0 to minus 10 region, with a visible inward notch near the 90-degree direction. The simu x-pol and meas x-pol traces form a four-lobed shape centered near the origin. Y-z plane plot. Radial axis label: Gain (dB). Radial tick labels: 0, minus 10, minus 20, minus 30, minus 40, minus 50, minus 60, minus 70, minus 80. The simu co-pol and meas co-pol traces form near-circular rings near the outer region, with a visible inward notch near the 90-degree direction. The simu x-pol and meas x-pol traces form a compact multi-lobed shape near the center.
Conclusion
This work presents double-band slot antennas with configurable FL. Theoretical analysis of the antenna’s performance was done using mathematical formulas, and the FL was changed without changing the antenna’s dimensions. The proposed slots’ symmetrical structure and the appropriate ground plane are selected to resonate the necessary dual bands. For the purpose of designing rectifier circuits, these antennas offer adequate gain, radiation efficiency, energy density, and received power values. The suggested antennas are beneficial for simultaneous wireless information and power transmission applications, according to the final findings. For triple-band GPS/WLAN/ISM band operations, a small planar slotted monopole antenna is presented in this work. Using simulation findings, the regulation of individual frequencies with circular and inverted L-slots is described. Analysis was also done on the radiation patterns and the dispersion of surface currents. The findings of the measurements and the simulations correspond quite well. The proposed antenna is formidably suitable for multiband independent frequency tuning applications.
Competing interests
The authors declare no competing interests.

Geriki Polaiah received the M.Tech. degree in electronics and communication engineering from Jawaharlal Nehru Technological University Anantapur, India, in 2010 and a Ph.D. degree in electronics and communication engineering from National Institute of Technology Karnataka, Surathkal, Mangalore, India. His current research interests include computational electromagnetics, microwave antennas, RF integrated circuits for wireless power transmission, and energy harvesting applications.