INTRODUCTION
The traditional chronology of the Inca Empire is primarily based on the three Spanish accounts of Inca oral history that included chronological information: Cabello Balboa (Reference Cabello Balboa1945), Betanzos (Reference Betanzos1987), and Sarmiento de Gamboa (Reference Sarmiento de Gamboa2007). Archaeologists have long relied on Rowe’s (Reference Rowe1944, Reference Rowe1945) interpretation that privileges Cabello Balboa’s dates (see Tantaleán Reference Tantaleán2015: 14). This chronology has its limitations but for many years there was no viable alternative. The most likely candidates, calibrated radiocarbon or thermoluminescence (TL) dates, have error ranges that are often greater than the historically recorded duration of the empire, making them unlikely prospects for improving the situation (McEwan Reference McEwan2008: 53). However, this limitation can be overcome by using Bayesian models, which treat dates in aggregate rather than individually (Bronk Ramsey Reference Bronk Ramsey2009a). The growing body of calibrated 14C and TL dates hints that Cabello Balboa’s chronology underestimates the date of Inca expansions out of Cuzco, especially to the south (e.g. Pärssinen and Siiriäinen Reference Pärssinen and Siiriäinen1997; D’Altroy et al. Reference D’Altroy, Williams and Lorandi2007; Cornejo Reference Cornejo2014), but Bayesian models have not been used to test this. Various problems with the traditional chronology and the potential of Bayesian models suggest that it is time to abandon Cabello Balboa’s chronology and give priority to radiometric dates, as argued by Ogburn (Reference Ogburn2012: 231), whose recent article motivated this re-evaluation of dates from Mendoza, Argentina.
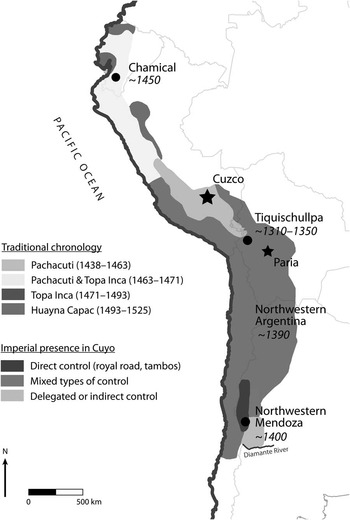
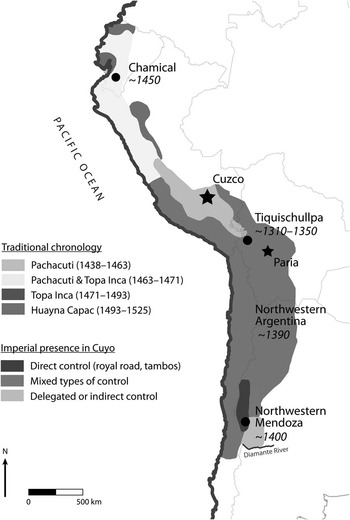
Toward an improved chronology of imperial expansion, we present two case studies from near the northern and southern extremes of the empire, in modern Ecuador and Mendoza, Argentina, respectively. These cases studies illustrate three methodological issues relevant for Bayesian models of Inca dates. The model from Ecuador highlights the benefits of stratigraphic priors and using the appropriate calibration curve at a single site, while the model from Mendoza uses an outlier analysis to address both 14C and TL dates from multiple sites. Refined dates of the initial Inca occupation of both locations lead to a re-evaluation of the chronology of imperial expansion (Figure 1).
Map of the Inca Empire in western South America, based on Ogburn (Reference Ogburn2012: Figure 1). Modern countries are outlined in gray. The traditional chronology is from Rowe (Reference Rowe1945). Inca control in the Cuyo region (the Argentine provinces of Mendoza, San Juan, and San Luis) is based on García’s (Reference García2011b) proposal. Dates on the map are the median results of four Bayesian models of Inca dates, which indicate the beginning of Inca occupation in the area. This simplification is for the sake of the figure and does not disregard the probability ranges associated with each median. All dates are AD.
DEVELOPING A CHRONOLOGY FOR THE EXPANSION OF THE INCA EMPIRE
For more than half a century, Rowe’s (Reference Rowe1944, Reference Rowe1945) landmark publications have been the authoritative version of Inca chronology (Figure 1). This traditional chronology is based primarily on the dates of the chronicler Cabello Balboa (Reference Cabello Balboa1945), which were the “most plausible” at the time (Rowe Reference Rowe1945: 277). However, Cabello Balboa’s information has a series of problems. One possible reason Cabello Balboa even attempted an absolute chronology was to synchronize Inca and European histories (Julien Reference Julien2000: 225). Only two other chroniclers proposed absolute dates for the Inca, most notably Sarmiento de Gamboa (Reference Sarmiento de Gamboa2007), who offers an unrealistic chronology based on a subjective and eclectic mix of dates from the Bible, Greek texts, the Spanish royal line, and interviews (González Díaz Reference González Díaz2015: 170–3). Cabello Balboa may have had similar influences, though this remains unclear because he does not report the source of his information (Rowe Reference Rowe1945: 277; Julien Reference Julien2000: 223; Ogburn Reference Ogburn2012: 230–1).
It seems unlikely that Cabello Balboa had access to absolute dates that other chroniclers did not. According to another chronicler, local people did not give much importance to linear time: “they did not count their age in years; neither did they measure the duration of their acts in years; nor did they have any fixed points in time from which to measure historical events” (Cobo Reference Cobo1979: 252). This is also evident in the Spanish interviews conducted in Cuzco in 1571, which included questions on the royal Inca chronology (Julien Reference Julien2000: 223–8; González Díaz Reference González Díaz2015: 164–6). Responses were inconsistent and included implausibly long lifespans of 100 and 130 yr (Rowe Reference Rowe1945: 277). In fact, there is no convincing evidence that there were any prehispanic linear calendars in the Andes, so Cabello Balboa’s dates were probably his own estimates (Bauer Reference Bauer1992: 38).
The sequence of conquered territories may not be correct either, as Inca histories do not appear to have been especially concerned with chronology. Instead, they relied on standardized narrative sequences (Ogburn Reference Ogburn2012: 232–3), as would be expected for a principally oral history. Similar versions of royal Inca history are recorded in many sources, but perhaps most reliably in a set of voluntary interviews of direct descendants of the emperor Topa Inca and two of his brothers (Rowe Reference Rowe1985: 193–9). These are more reliable than other chronicles for a number of reasons, not least because they are based on khipus, the Incas’ knot-and-string recording devices. While none of the descendants mention specific dates, they all list the conquered quarters in the same geographic order: Chinchaysuyu, Antisuyu, Collasuyu, and Condesuyu (Rowe Reference Rowe1985: 197). The same order is followed in other chronicles as well as lists of shrines (Pärssinen Reference Pärssinen1992: 75; Julien Reference Julien2000: 132). Because the quarters are always listed in the same order, it initially seemed reasonable to assume that this was a chronological listing of events (Ogburn Reference Ogburn2012: 232). However, conquered territories were often treated as accomplishments of each emperor and in these accounts, “genealogy, not chronology, is what gives the historical narratives their temporal order” (Julien Reference Julien2000: 52, our emphasis). Hence while the chronicles do include rich and useful information, the sequence of conquered territories seems to be a geographically ordered narrative device that does not offer reliable chronological information (Ogburn Reference Ogburn2012: 232–3).
This standard order of conquests and Cabello Balboa’s dates are the foundation of Rowe’s chronology, but elements of Inca oral histories may not have been exactly historical in the western sense and some scholars have suggested they are more mythical in nature (e.g. Zuidema Reference Zuidema1982: 174). These underlying problems have gone unaddressed by many but not all (e.g. Bauer Reference Bauer1992: 38; Pärssinen and Siiriäinen Reference Pärssinen and Siiriäinen1997: 255–6), in part because there was no promising alternative for building an Inca chronology. The only possibility was radiometric dates, but the empire’s historic duration, at least according to Cabello Balboa, was shorter than the error range of most 14C and TL dates. Hence, some researchers deemed it an unnecessary expense to process dates and continued to rely on Rowe’s chronology (see Bauer Reference Bauer1992: 36–40).
Rowe’s chronology places the conquest of the southern quarter, Collasuyu, mostly during the reign of Topa Inca, AD 1471–93 (Figure 1). However, growing sets of calibrated 14C and TL dates from a number of sites in modern Bolivia, Chile, and northwestern Argentina suggest that Collasuyu was conquered earlier (Stehberg Reference Stehberg1992; Pärssinen and Siiriäinen Reference Pärssinen and Siiriäinen1997; Muñoz Ovalle and Chacama Rodriguez 1988; Williams and D’Altroy Reference Williams and D’Altroy1998; Schiappacasse Reference Schiappacasse1999; Leibowicz and Jacob Reference Leibowicz and Jacob2012; D’Altroy et al. Reference D’Altroy, Williams and Lorandi2007; Lynch Reference Lynch2012). In recent years, statistical treatments of calibrated dates have shown that Inca expansion both north and south of Cuzco was earlier than Cabello Balboa’s dates (Michczyński and Pazdur Reference Michczyński and Pazdur2003; Ogburn Reference Ogburn2012; Cornejo Reference Cornejo2014). These include summed probability distributions, which have recently become popular, but have methodological limitations that are not always fully considered (e.g. Williams Reference Williams2012). Even so, calibrated date ranges are consistent and suggest that the southern expansion into northern Chile and Argentina began cal AD 1370–1400. These dates cast doubt on Rowe’s chronology and the sequence of conquests in ethnohistoric sources.
The next step in evaluating Rowe’s chronology and building a reliable Inca chronology is the use of Bayesian models (Bronk Ramsey Reference Bronk Ramsey2015). These models incorporate archaeological information and multiple dates to produce more reliable chronological estimates. They seem to be the only viable alternative for improving our chronology of the Inca. If we continue to rely on individual date ranges or summed probability distributions, additional dates may actually make the Inca period appear longer than it really was (see Bronk Ramsey Reference Bronk Ramsey2003). Before Bayesian models or hemisphere-specific calibration curves were available, the Inca 14C chronology could not effectively evaluate Rowe’s dates (Adamska and Michczyński Reference Adamska and Michczyński1996: 50). Bayesian models should be the standard for working with Inca dates and offer an effective counter to doubts of an Inca chronology based on radiometric dates. To date, only two Bayesian models have been analyzed with Inca dates: one set of dates from a site in Ecuador (Ogburn Reference Ogburn2012: 225–8) and a regional set of 33 dates from northwestern Argentina (Greco Reference Greco2012: 408–11). Both are single-phase models that produced starting dates that were earlier than Balboa’s chronology by 1–2 decades in Ecuador and nearly a century in Argentina.
METHODOLOGICAL ISSUES FOR BAYESIAN MODELS OF INCA DATES
Bayesian models have great potential to improve Inca chronologies, but like all models, they are only as good as the underlying assumptions (Bayliss and Bronk Ramsey Reference Bayliss and Bronk Ramsey2004; Bayliss Reference Bayliss2015; Buck and Meson Reference Buck and Meson2015; Pettitt and Zilhão Reference Pettitt and Zilhão2015; Wood Reference Wood2015). It is important to include TL dates when they are available because they can directly date Inca-style ceramics and are free of the potentially ambiguous association between diagnostic ceramics and 14C samples (Waterbolk Reference Waterbolk1971; Greco and Palamarczuk Reference Greco and Palamarczuk2014). In this paper, we attempt to follow recently published reporting guidelines for dates and models (Millard Reference Millard2014; Bayliss Reference Bayliss2015), but legacy data often do not include all the relevant details, for example, δ13C values, which were often neither measured nor reported. We use “cal AD” to refer to calibrated dates and italicize modeled dates, followed by their posterior probability and the name of event in the model (see Bayliss et al. Reference Bayliss, Bronk Ramsey, van der Plicht and Whittle2007: 5). Models were run in OxCal v 4.2 (Bronk Ramsey Reference Bronk Ramsey2009a) and dates were rounded by 10 yr. Multiple runs of the same model can have slightly different results, given the probabilistic nature of Markov chain Monte Carlo analysis. Multiple runs of the models presented were robust, showing minor differences of no more than a decade. Here, we address three relevant methodological issues: detailed stratigraphic sequences, choosing the most appropriate calibration curve, and dealing with outliers.
First, it is important to incorporate prior information such as stratigraphic sequences (Bayliss Reference Bayliss2009; Bronk Ramsey 2009). Bayesian models merge this information with dates to arrive at posterior estimates, that is, prior assumptions×probability distributions=posterior beliefs, or in other words, archaeological information (e.g. stratigraphy)×radiometric dates=more accurate temporal estimates (see Bayliss Reference Bayliss2009: 127–32). In the case of legacy data, detailed archaeological information is not always available, but basic assumptions can still significantly improve a site’s chronology. For example, all the dates from a site can be grouped in a single phase, and the starting and ending boundaries of the phase are useful estimates of when the site was founded and abandoned, respectively.
The second issue is which calibration curve to choose, IntCal13 (Reimer et al. Reference Reimer, Bard, Bayliss, Beck, Blackwell, Ramsey, Grootes, Guilderson, Haflidason, Hajdas, Hatté, Heaton, Hoffma, Hogg, Hughen, Kaiser, Kromer, Manning, Niu, Reimer, Richards, Scott, Southon, Staff, Turney and van der Plicht2013) or SHCal13 (Hogg et al. Reference Hogg, Hua, Blackwell, Niu, Buck, Guilderson, Heaton, Palmer, Reimer and Reimer2013). The curves differ by around 20 yr for Inca-period dates, which is a small but relevant difference (Adamska and Michczyński Reference Adamska and Michczyński1996: 38; Ogburn Reference Ogburn2012: 223). The Inca Empire is mostly located in the Southern Hemisphere, so SHCal might seem appropriate, but atmospheric mixing near the equator can extend as far south as Lake Titicaca, where IntCal is a better choice (see Finucane et al. Reference Finucane, Valdez, Pérez Calderon, Vivanco Pomacanchari, Valdez and O’Connell2007:581; Marsh Reference Marsh2012: 205–6, Reference Marsh2015: 15–6). Currently, there are insufficient data to identify which curve is most appropriate for the northern and central parts of the Inca Empire. To deal with this, Ogburn (Reference Ogburn2012: 227–8) compares results from both curves and suggests using a mixed curve that allows the full range of both IntCal and SHCal. We adopt a mixed curve because it provides more accurate dates, even though they are less precise in some parts of the curve (C Bronk Ramsey, personal communication, 2015). Accuracy is a priority because Inca chronologies are directly linked to events with reliable calendar ages, such as Pizarro’s AD 1532 landing on the Peruvian coast.
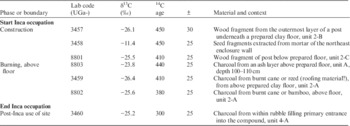
To illustrate the benefits of modeling a stratigraphic sequence and using an appropriate calibration curve, we present a revised Bayesian model of the site Chamical in Ecuador (Appendix A, online Supplemental Data). The model mixes the IntCal13 and SHCal13 calibration curves. The site has seven dates with sufficient stratigraphic information to model a sequence of three phases (Table 1; see additional details in Ogburn Reference Ogburn2012: 225–8, Table 2). After the starting boundary, the first phase is the site’s construction, comprising two dates from posts (UGa-3457, UGa-8801) and one from the mortar of the outer wall (UGa-3458). Next, there was a prepared clay floor, stratigraphically separating the first two phases. The second phase is probably of the site’s later occupation and subsequent destruction, which comprises three charcoal dates from above the floor, perhaps of burned roof material (UGa-8803, UGa-3459, UGa-8802). Cane roofs were often replaced and this material was likely harvested after the construction of the structure and before its abandonment. Next is a boundary that marks the end of the Inca occupation of the site. Finally, the latest date is from rubble that filled the primary entrance of the enclosure (UGa-3460), which postdates its use, most likely in the early Colonial period.
Dates and sequence used in the Bayesian model of Chamical.

The sample 13C/12C ratios were measured separately using a stable isotope ratio mass spectrometer and expressed as δ13C with respect to PDB, with an error of less than 0.1‰. Dates were corrected for isotope fractionation.
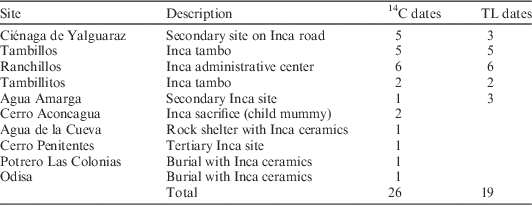
Dated Inca sites in Mendoza.

The model has an acceptable agreement index (121) and estimates the starting boundary as cal AD 1430–1460 (68% probability) and cal AD 1410–1480 (94% probability, Start Inca occupation). Querying the model with the Difference command, we can compare this date with Cabello Balboa’s date of AD 1463. There is a high probability (89%) that Chamical was founded before AD 1463. The model reduces the error ranges of individual dates to 10–15 yr for six of the dates. The site’s occupation lasted <30 yr (68% probability) and ended cal AD 1450–1500 (68% probability, End Inca occupation). This means that the site was probably abandoned while the Inca were still occupying other parts of Ecuador. The Inca army may have consolidated this area before continuing north, or perhaps they felt a small-scale military presence was only necessary to secure the area for a short period. It was likely built as an outpost during the military advance into Ecuador, so its starting date is a reliable estimate of the initial Inca incursion into the region (Ogburn Reference Ogburn2012: 225–6). It also agrees well with the documented-based expectation that the Inca occupied Ecuador before Huayna Capac’s birth in Ecuador in AD 1457 or 1458 (Ogburn Reference Ogburn2012: 231), also prior to Cabello Balboa’s date of AD 1463. Additional models of nearby sites and quantified comparisons would make it possible to piece together details of the invasion and consolidation within Ecuador with more veracity than documentary sources.
The third methodological issue is dealing with potential outliers (Bronk Ramsey Reference Bronk Ramsey2009b), particularly important for shorter periods like the Inca Empire. Given the need to reassess the Inca chronology with 14C dates, we must now contend with outliers. Apparent outlier dates can be identified subjectively, as Greco (Reference Greco2012: 409) does in his model of Inca dates from northwestern Argentina. Here, we use outlier models to both detect outliers for manual removal and down-weight outliers that remain in the model (Bronk Ramsey Reference Bronk Ramsey2009b: 1024). These models are an effective way to deal with dates of unexpected ages when the reason for the unexpected age is unclear, for both 14C and TL dates (Bronk Ramsey Reference Bronk Ramsey2009b: 1023–4). We use the General Outlier model because we had no reason to justify a specific outlier model (Bronk Ramsey Reference Bronk Ramsey2009b: 1028). An outlier model was appropriate for quantitatively evaluating the legacy data from Mendoza.
THE INCA OCCUPATION OF MENDOZA: PREVIOUS STUDIES AND CHRONOLOGY
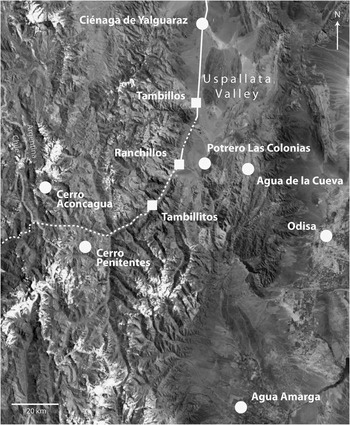
The clearest material indicators of the Inca occupation in Mendoza are found in the Uspallata Valley (Figure 2). They include Inca-style ceramics, rectilinear stone structures, and sites connected by the royal road, which were recognized by early historians and archaeologists (Morales Guiñazú Reference Morales Guiñazú1938; Aparicio Reference Aparicio1940; Rusconi Reference Rusconi1962: 232–63). The valley sits at 1700–2100 m asl and is located in the northwestern corner of the Province of Mendoza near the Chilean border (Figures 1, 2). The valley was near the southern limit of the empire and is also the southern limit of the puna environment with which the Incas would have been most familiar. This valley and surrounding highlands are attractive to human settlement and have been occupied since the Late Pleistocene (García Reference García2003). The region’s principal river flows along the valley’s southern edge. Following the river valley west is the simplest route for crossing the Andes at this latitude, and a string of small Inca sites over this mountain pass suggest they also used this route.
Map of dated Inca sites in Mendoza. Tambos with Inca architecture are indicated as squares, other sites as circles. The white line indicates the extant (solid) and likely (dotted) portions of the Inca road.

The bulk of Inca research in Mendoza has been directed by Bárcena (Reference Bárcena1979, Reference Bárcena1988, Reference Bárcena1998a, Reference Bárcena1998b, Reference Bárcena2008; Bárcena and Román Reference Bárcena and Román1990; Bárcena et al. Reference Bárcena, Terraza, Sabatini and Da Peña2013), though recent studies have seen a reinvigorated interest by other scholars (e.g. Ots and Cahiza Reference Ots and Cahiza2013; see reviews in García Reference García2009, Reference García2011a). Bárcena tracked the Inca road and excavated the principal sites in the Uspallata Valley, including the large site of Ranchillos (Rusconi Reference Rusconi1962; Bárcena Reference Bárcena1998b).Footnote 1 From there, the road then turns west into the mountains, along which there are a few smaller sites (Durán et al. Reference Durán, Cortegoso and Lucero2011), including the child sacrifice on Aconcagua Mountain (Fernández et al. Reference Fernández, Panarello and Schobinger1999; Schobinger Reference Schobinger1999, Reference Schobinger2001). The name of the valley has Quechua roots (Canals Frau and Semper Reference Canals Frau and Semper1956: 8; García Reference García2011b: 58), unlike other regional place names that have roots in Huarpe, the local language and culture that was present when the Inca arrived (Michieli Reference Michieli1983). There were translators between Huarpe and Quechua in the second half of the 16th century, who may have been brought in with mitmaqkuna, laborers relocated from elsewhere in the empire (Canals Frau Reference Canals Frau1943: 303–5, Reference Canals Frau1946: 40, 46, 1956:8; Michieili 1983:107; García Reference García2011a: 168). Based on historical documents, Bárcena (Reference Bárcena1994: 27, 39–41) suggests that Uspallata might have been the name of an important Inca person and that the Incas may have considered it part of an administrative division or imperial province named Cuyo, which is the current name of the region.
Inca architecture has been identified at only three sites in the Uspallata Valley, and there is little evidence of direct Inca presence at other sites. Historical documents hint that their influence extended to the populations living in lower-altitude valleys to the south and east, though the nature of this influence remains under debate (Bárcena Reference Bárcena1994; Cahiza and Ots Reference Cahiza and Ots2005; Parisii Reference Parisii2005; García Reference García2011a, Reference García2011b; Ots and Cahiza Reference Ots and Cahiza2013). One likely material expression of this influence is the production of Viluco pottery, which seems to be a local variant of Inca ceramic techniques and styles (García Reference García1992, Reference García1996, Reference García1999; Prieto Olavarría and Chiavazza Reference Prieto Olavarría and Chiavazza2009, Reference Prieto Olavarría and Chiavazza2015; Prieto Olavarría Reference Prieto Olavarría2012). The debated chronology of Viluco pottery and its relation to the Inca and Spanish empires is an excellent example of an issue that could be tackled with Bayesian models.
Despite sustained interest in the Inca occupation of Mendoza, its chronology has not been a point of discussion. Bárcena (Reference Bárcena1979, Reference Bárcena1994, Reference Bárcena1998a, Reference Bárcena2008) and his students (Cahiza and Ots Reference Cahiza and Ots2005; Parisii Reference Parisii1994, Reference Parisii2005; Ots and Cahiza Reference Ots and Cahiza2013) have consistently relied on Cabello Balboa’s date of AD 1471 for the Incas’ arrival, often rounded to AD 1470 or 1480, even though radiometric dates from adjacent regions are consistently earlier (Stehberg Reference Stehberg1992; Muñoz Ovalle and Chacama Rodriguez 1988; Williams and D’Altroy Reference Williams and D’Altroy1998; Schiappacasse Reference Schiappacasse1999). A series of 14C and TL dates from Inca ceramics and sites in Mendoza have been processed, but they have only been used in equivocal comparisons to Rowe’s chronology (Bárcena Reference Bárcena1998a). Despite thorough reference to historical documents (Bárcena Reference Bárcena1994; Parisii Reference Parisii1994), the radiometric dates have not been critically evaluated nor have they been used to improve our understanding of Inca chronology. The unquestioned veracity of AD 1471 may be the result of decades of academic inertia, deference to historical documents, or the clear advantage of uniformly following Rowe’s chronology, which avoids the “wide inconsistency in the chronological information embedded in the historical sources” (Ogburn Reference Ogburn2012: 231), not to mention the error ranges of radiometric dates. While this chronology was certainly the “most plausible” (Rowe Reference Rowe1945: 277) before 14C dating was possible, it should be treated as a hypothesis to be tested (Pärssinen and Siiriäinen Reference Pärssinen and Siiriäinen1997: 256–7). We do this with Bayesian models of dates from Mendoza.
MATERIALS AND METHODS: A BAYESIAN MODEL OF INCA DATES IN MENDOZA
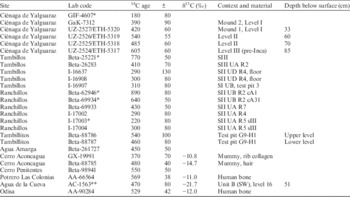
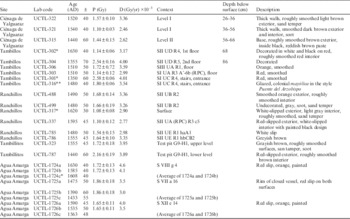
We use Bayesian models of the Inca dates in Mendoza to test to the hypothesis that the Inca arrived earlier than AD 1471. We can safely use the SHCal calibration curve, as Mendoza is well south of the area that may be affected by the Northern Hemisphere’s atmosphere. The ending boundary of the models was constrained by a date of AD 1595, when two first-hand travelers’ accounts describe the Inca sites in ruins (Parisii Reference Parisii1994: 55). They may have been in ruins as early as AD 1561 (Bárcena Reference Bárcena1994: 26–30), as inferred from indirect references, but this seems too speculative to include in the model. The models use 26 14C dates associated with Inca ceramics or architecture and 19 TL dates on sherds from 10 sites (Tables 2–4, Figure 2). TL dates were run on Inca-style sherds (Table 4; Bárcena Reference Bárcena1998a; Ots Reference Ots2007b) and were corrected with readings from on-site dosimeters at four sites in the Uspallata Valley (Bárcena Reference Bárcena1998a: 150–1, 225, 235–6, 241).
14C Inca dates from Mendoza. All samples are charcoal unless otherwise noted.

* Identified as an outlier and removed. Context abbreviations are as reported (Bárcena Reference Bárcena1998a). They seem refer to the sector (S), excavation unit (U), structure (R), room (h), level (c), and test pit (s), as suggested by the initial letter of Spanish terms.
** The sample’s δ13C was measured by conventional isotopic ratio mass spectrometry and was used to correct the 14C date (Albero and Angiolini Reference Albero and Angiolini1983).
TL Inca dates from Mendoza.
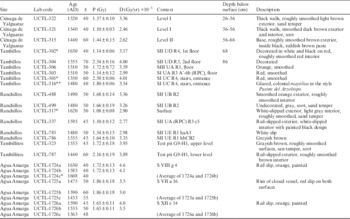
* Identified as outliers and removed. See Table 3 for context abbreviations.
** Not included in the models.
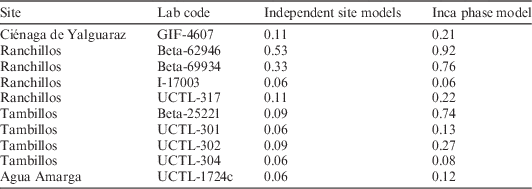
We began with separate models of each site (Appendix B). The sites do not have enough stratigraphic information to build a model like the one used for Chamical, so all dates from each site were modeled as a single uniform phase (Bronk Ramsey Reference Bronk Ramsey2009a: 343). The major challenge was dealing with outliers. Bárcena (Reference Bárcena1998a: 359–64) reported an unexplained discrepancy between TL dates and paired 14C and calendar dates, but overall, Inca-period TL dates seem more accurate than older TL dates. This is unexpected because TL dates in Chile are considered very reliable (e.g. Falabella et al. Reference Falabella, Cornejo, Sanhueza and Correa2015). Hence, all dates were treated as potential outliers. Dates were manually removed if they had a >0.05 (5%) posterior probability of being outliers and models were rerun to test for additional outliers, following Bronk Ramsey (Reference Bronk Ramsey2009b: 1023–4). For better chronological control, it is preferable to work with single-component sites such as Chamical. In Mendoza, the three principal Inca sites of Ranchillos, Tambillos, and Tambillitos as well as Cerro Penitentes have relatively shallow stratigraphy and a single occupational layer. At three other sites, Ciénaga de Yalguaraz, Agua Amarga, and Agua de la Cueva, there were pre-Inca occupations that were excluded from this analysis. The following section briefly describes each site’s dates and model, from north to south (Figure 2).
Ciénaga de Yalguaraz. The site Ciénaga de Yalguaraz is the northernmost Inca site in Mendoza, located near a dry lake bed (see Bárcena Reference Bárcena1979: 679–88). The site was originally identified because it is roughly 22–24 km from Inca sites to the north and south, which is the typical spacing between Inca road way stations, or tambos. The site is near the Inca road and Inca ceramics were found on the surface and in excavation, though no Inca architecture was present. The ceramics from surface collections and excavation were similar and approximately 10% were decorated. The decorated ceramics included Inca styles similar to those from Tambillitos (Bárcena Reference Bárcena1979: 675), with “typical Cusco motifs” but no Inca Diaguita or classic Diaguita styles. Forms included plates with modeled birds and one convex rim that appeared to be from an aryballoid (Bárcena Reference Bárcena1979: 682–3). Other artifacts included lithic scrapers, projectile points, and bones of camelids and Rhea. Nine circular or semicircular mounds with archaeological features were identified. Occupation layers were separated by 2-cm saline laminates, suggesting to Bárcena (Reference Bárcena1979: 682) that the site was occupied seasonally in the spring and summer.
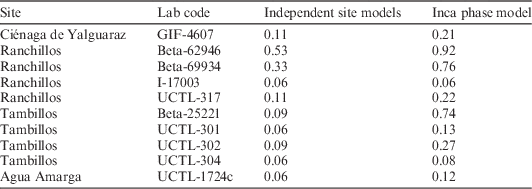
The site’s five 14C samples were from burning events (Bárcena Reference Bárcena1998a: 98). Four of these samples were from 33, 60, 70, and 85 cm below the surface but the dates do not follow the stratigraphic sequence (Table 3). The same is true of the three TL dates, from sherds in levels that were 26–36, 36–56, and 56–66 cm below the surface (Bárcena Reference Bárcena1998a: 227–8, 369). This may be explained by taphonomic processes (Bárcena Reference Bárcena1979: 680) or perhaps the occupation was too short for radiometric dates to show a clear sequence. The oldest date (UZ-2524/ETH-5317) is from the deepest level (III), which has only undecorated ceramics (Bárcena Reference Bárcena1979: 682–3, Reference Bárcena1998a: 98–9). This date is not included in the model because the associated level is interpreted as pre-Inca. The model takes a conservative approach and does not use any stratigraphic priors. It groups the dates from levels I and II in a single phase. A single outlier was identified and removed (Table 5). The estimated starting boundary for the Inca occupation is cal AD 1330–1500 (95% probability, Start Cienaga de Yalguaraz).
The 10 dates removed and their posterior probabilities of being outliers. The prior probability for all dates was set at the default 0.05 (5%).
Tambillos. Moving south along the Inca road, the next site is the tambo Tambillos (Rusconi Reference Rusconi1962: 261–3; Bárcena Reference Bárcena1988; Bárcena and Román Reference Bárcena and Román1990). The site includes a built surface area of 4618 m2 of round and rectilinear buildings with stone foundations (Bárcena Reference Bárcena2008: 329) made of cobbles, presumably from the dry river bed that runs through the site. The architecture includes a characteristically Inca “compound perimeter rectangle” shape (or RPC, in the Spanish acronym) with two rows of four rooms each. Surface collection and excavation recovered a variety of decorated Diaguita and Inca-Pacajes sherds, in addition to other styles from Chile and Cusco; forms included plates, bowls, and aryballoids. Analysis suggests that ceramics were produced here, perhaps by mitmaqkuna from northern Chile (Bárcena Reference Bárcena1988: 416; Bárcena and Román Reference Bárcena and Román1990: 56, 65, 73; Garcia Llorca Reference Garcia Llorca1995: 172).
There are five 14C dates and six TL dates from the site (Tables 3–4; Bárcena Reference Bárcena1998a: 85–91, 231–8, 245, 369–70). Most of these dates are directly associated with occupation floors of Inca-style buildings or contexts with decorated Inca pottery. Colonial ceramics were also found at this site, suggesting occupation that extended beyond the Inca occupation. The one TL date (UCTL-316) from a Spanish mayólica sherd was earlier than expected; it was not included in the model (Table 4). There seems to be some stratigraphic superposition of the samples (Bárcena Reference Bárcena1998a: 231), but following a conservative approach, we modeled all the dates as a single phase. We removed four dates that had a greater than 5% probability of being outliers (Table 5). A phase of the remaining six dates resulted in an estimated starting boundary and site founding at cal AD 1400–1570 (95% probability, Start Tambillos).
Ranchillos. This is the largest Inca site in Mendoza, with a built surface area of 6648 m2 (Bárcena Reference Bárcena2008: 329). Its ruins have been mentioned in numerous historic sources (Bárcena Reference Bárcena1998b: 7–14). Early archaeologists mapped a series of RPCs on either side of the Inca road that runs through the center of the site (Aparicio Reference Aparicio1940; Rusconi Reference Rusconi1962: 232–61). Based on its size and architecture, it has been interpreted as the regional administrative center (Bárcena Reference Bárcena1998b). It is located in a narrow valley with a reliable water source along the eastern edge of the Uspallata Valley. Diagnostic Inca sherds in red, black, and white have been identified as Diaguita and Inca provincial styles (Rusconi Reference Rusconi1962: 256–60; Bárcena Reference Bárcena1998b: 24–33). A variety of forms were documented such as plates, pucos, jars, cups, and aryballoids. The site is shallow, with occupational deposits no deeper than 30–40 cm below the surface. There are no indications of occupations before or after the Inca occupation.
The site includes 12 dates (Bárcena Reference Bárcena1998a: 101–2, 238–44, 247, 370–1) and 4 were identified as outliers (Table 5). Wide differences between 14C and TL were interpreted as the result of taphonomic disturbance or old wood (Bárcena Reference Bárcena1998a: 240–3). The single-phase model estimates the starting boundary at cal AD 1400–1560 (95% probability, Start Ranchillos).
Tambillitos. The smallest of the three sites with Inca architecture (Rusconi Reference Rusconi1962: 252), Tambillitos, has a built surface area of 2820 m2 (Bárcena Reference Bárcena2008: 329). It is notable for its rectangular stone architecture and decorated Inca ceramics (Bárcena Reference Bárcena1979: 670–9). The segments of the Inca road that would have connected it to neighboring sites have been destroyed by modern construction. Like Ranchillos, occupation layers are no more than 40 cm below the surface and mostly likely represent a single occupation. Decorated sherds are in the Inca Polychrome and Coripata Cuzco Polychrome styles. Other styles were identified as being originally from northern Chile and northern Argentina (Bárcena Reference Bárcena1979: 674–7). Small triangular projectile points and fragments of marine shell were also found, like at the other Inca sites. The four radiometric dates have clearer stratigraphic relationships than at other sites; no outliers were identified (Bárcena Reference Bárcena1998a: 156, 248–56, 371). The single-phase model estimates the starting boundary for the Inca occupation of the site at cal AD 1170–1550 (95% probability, Start Tambillitos).
Agua Amarga. Agua Amarga is located around 90 km south of the Uspallata Valley at a lower elevation (1100 m asl) in an agriculturally productive area. Excavations of secondary refuse deposits included a variety of lithics, bones, and notably, a very high density of domestic maize and beans, so people probably grew crops near the site (Ots et al. Reference Ots, Oliszewski and Llorca2011: 77–8). While there is no Inca architecture or direct connection to the main Inca road, surface collections identified sherds in the Inca Diaguita (Phase III) and Viluco Inca styles, which were also found at Tambillos and Ranchillos in the Uspallata Valley (Ots Reference Ots2007a: 208, 258, 261). Forms included pucos, keros, and aryballoids (Ots and Cahiza Reference Ots and Cahiza2013: Table 2). There was no evidence of post-Inca occupation (Ots Reference Ots2007a: 260; Ots et al. Reference Ots, Oliszewski and Llorca2011: 68).
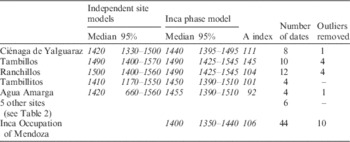
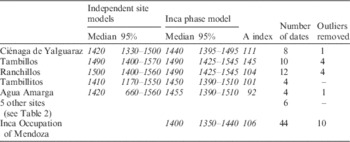
The Inca occupation of Agua Amarga is dated with one 14C date and three TL dates (Ots Reference Ots2007a: 190–1, 2007b: 484; Ots et al. Reference Ots, Oliszewski and Llorca2011: 68). On-site TL dosimetry was not available so two alternative corrections were used by the laboratory: (a) the average dosimetry from other sites in the region, which have similar sediments, and (b) the isochron method (Table 4). The results of these two methods were interpreted as minimum and maximum ages for each dated sample (Ots Reference Ots2007a: 191, 2007b: 484). We averaged the results using a sum of squares of the error ranges, which are listed in Table 4 as UCTL-1724c, 1725c, and 1726c. These averages were used in the site’s model, which estimates the starting boundary at cal AD 660–1560 (95% probability, starting boundary) or cal AD 1360–1500 (68% probability, Start Agua Amarga). The starting boundaries for the individual Inca sites have error ranges of at least 160 yr, though the medians are within a century of each other (Table 6). The next step was to group these independent site models into one large model.
Starting boundaries for independent site models and the Inca phase model, showing medians and 95% probability ranges. The A indices for individual sites are from the independent site models. The number of dates and outliers were the same in both the independent models and the Inca phase model.
Inca phase model. The Inca phase model groups the site models within a single Inca phase, adding a simple but significant assumption to the model: all the dates and sites belong to the same phase. This is based on their shared material associations with Inca architecture or ceramics. In addition to the models described above, the Inca phase model includes six other dates from five other sites, which we briefly describe from west to east (Figure 2; Tables 2–4). The first is a high-altitude child sacrifice that included a variety of Inca grave goods on Aconcagua mountain. The two dates are from the child’s rib collagen and hair (Bárcena Reference Bárcena1998a: 107; Fernández et al. Reference Fernández, Panarello and Schobinger1999: 37). Given the high rate of collagen turnover in young bones, these dates should be equivalent, so they were combined prior to calibration. Next, there is another high-mountain site near the Inca road, Cerro Penitentes (Bárcena 1998b: 12). In the bottom of the Uspallata Valley, Rusconi (Reference Rusconi1962: 213–22) excavated a series of human burials at Potrero Las Colonias, and the grave goods included a painted puco. The associated human bones have been recently dated (Gil et al. Reference Gil, Villalba, Ugan, Cortegoso, Neme, Michieli, Novellino and Durán2014: 219). The site Agua de La Cueva is a rockshelter in the Precordillera mountains (Durán and García 1989: 56–7). One unpublished 14C date (AC-1563) is from a 5-cm level that includes Inca-style ceramics. Finally, Rusconi (Reference Rusconi1967: 9–13) excavated the Odisa site in the modern city of Mendoza. The site included a series of burials and two polychrome vessels in the Viluco Inca style. One of the burials has been recently dated (Gil et al. Reference Gil, Villalba, Ugan, Cortegoso, Neme, Michieli, Novellino and Durán2014: 220) and the associated materials come from the same layer, though the association is admittedly less than certain (see Waterbolk Reference Waterbolk1971: 16). Although this is not the most reliable data point, it is the best chronological information for the low-altitude areas to the east of the Andes. The ceramics and possibly the Inca influence may have been similar to those of Agua Amarga, as hinted at by documentary references (Bárcena Reference Bárcena1994). All six of these dates were incorporated in the Inca phase model; none of them were identified as outliers.
For the Inca phase model (Appendix B), the 10 outliers detected from the independent site models were confirmed and removed (Table 5). The remaining 44 dates were included as a General Outlier model, with prior outlier probabilities of 0.05 (5%), allowing model averaging to statistically down-weight the data (Bronk Ramsey Reference Bronk Ramsey2009b: 1024). The model has an acceptable agreement index (106), though it should be noted the agreement index is no more than a diagnostic for outlier models, as it is affected by down-weighted outliers.
RESULTS AND DISCUSSION
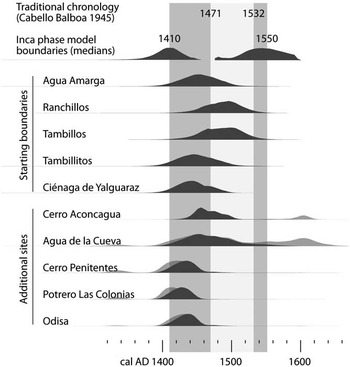
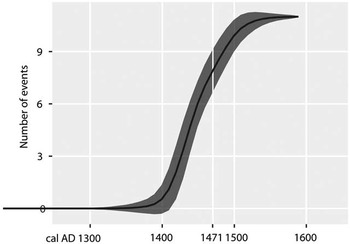
The starting boundary of the Inca phase model represents our current best estimate of when the Inca arrived in Mendoza (Figure 3): cal AD 1380–1430 (68% probability) and cal AD 1350–1440 (95% probability, Start Inca occupation). The model confirms the hypothesis that the Inca arrived well before Cabello Balboa’s date of AD 1471, by around 70 yr (30–130, 95% probability, Start v. AD 1471), according to a Difference query. The starting boundary is clearly earlier than the ethnohistoric data of AD 1471, even at the 99% probability range (cal AD 1280–1450). A summed probability distribution shows that the dates are well distributed within the Inca phase (Sum command). The cumulative occurrence of events can be graphically summarized with a tempo plot (Dye Reference Dye2016: 2), which includes 11 events: the starting boundary of the model, the starting boundaries of each site, and the dates from the five smaller sites (Figure 5). The shape of the curve suggests a rapid accumulation of events, that most sites were occupied or founded during the 15th century, and that 6–9 events occurred before AD 1471 (at 1σ). Table 6 shows the improvement in precision of the Inca phase model as compared to the individual site models. Overall, these results strongly reinforce Ogburn’s (Reference Ogburn2012: 231) call to abandon the traditional document-based chronology and give priority to 14C dates. We extend this call to include TL dates and most importantly, Bayesian models.
Comparison of probability density functions from the Inca phase model and the traditional chronology. Gray curves indicate calibrated date distributions; black curves indicate modeled posterior date distributions. For sites with multiple dates, the figure shows the starting boundaries. The vertical gray bar indicates the median dates of the Inca presence in Mendoza, based on the model’s starting and ending boundaries. The white vertical bar indicates the span suggested by Cabello Balboa (Reference Cabello Balboa1945) that is currently used in Inca research in Mendoza.

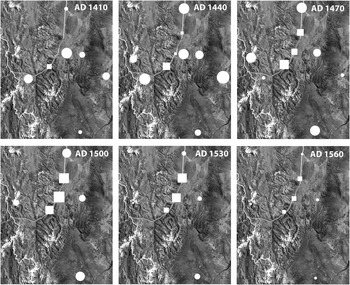
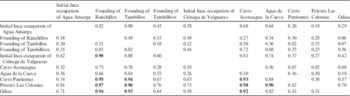
We can make some tentative site comparisons using the Order function, which gives the probable sequence of events in the Inca phase model (Table 7). These comparisons can be visualized in OxCal by mapping probability distributions from each site (Figure 4), which provides a general idea of which sites were contemporary. The earliest sites are small sites with one date each (Cerro Penitentes, Potrero Las Colonias, and Odisa), which may reflect the arrival of Inca material culture prior to any significant imperial presence. Next are the three smaller Inca sites with multiple dates (Ciénaga de Yalguaraz, Tambillitos, and Agua Amarga), perhaps reflecting a cautious investment in site-building, followed by the Aconcagua mountain sacrifice. This sacrifice may have marked the beginning of a greater commitment to the valley. The two largest sites, Ranchillos and Tambillos, were probably founded last, suggesting increasing imperial interest during the 15th century, as implied by the tempo plot (Figure 5). These comparisons involve highly overlapping probability distributions, so they remain tentative. In an earlier version of that model that included stratigraphic priors, the starting boundary was very similar, but as would be expected, the order of events was different. Hence, the model could be improved with a larger sample and more explicit stratigraphic priors, for both previous and future excavations. In terms of TL dates, greater care could be given to the identification and description of ceramic styles, which may have overlapping but not identical temporal spans. In this paper, the results of the Order command, tempo plot, and map of probability distributions are meant to demonstrate the range of the chronological tools available for exploring the data set. The results of these tools remain tentative.
Map of 95% probability densities of dates at Inca sites. The larger the dot, the greater the probability density (see Figure 2 for map details and site names).

Tempo plot of 11 Inca events in Mendoza. The dark line represents the mean number of cumulative events that took place prior to dates along the x axis; the shaded area represents 1σ (see Dye Reference Dye2016: 2).

Order of events, showing the probability that the event in the column on left was prior to the corresponding event at the top of the table. Probabilities of 0.90 or greater are indicated in bold.

The early arrival of the Incas in Mendoza has important implications for our understanding of the nature of Inca control in the region. One scenario describes enclaves that were directly controlled by the empire (Bárcena Reference Bárcena1994; Parisii Reference Parisii2005; Ots and Cahiza Reference Ots and Cahiza2013) while another suggests that control was delegated to the Diaguita group from Chile (García Reference García1996, Reference García1999, Reference García2009, Reference García2010, Reference García2011a, Reference García2011b). Both scenarios can now be re-evaluated based on a much longer occupation than suggested by Cabello Balboa. The Bayesian model estimates that the occupation lasted 70–230 yr (95% probability) or 100–190 yr (68% probability). This raises new questions, for example, did the Inca initially enter Mendoza from the west or north? Despite a presence lasting multiple generations, they did not build imperial centers in the valley bottom nor in the adjacent lowland valleys, both of which are agriculturally fertile areas that were occupied by local Huarpe groups. Despite their rapid and early expansion to Uspallata, they did not continue farther south, despite negligible armed resistance. The reasons they halted their expansion here are unclear, but one potential factor is that they reached the continent’s southern limit of the puna environment with which they were most familiar. The documentary evidence has little information, but a descendant of Topa Inca offered a plausible suggestion: “as they saw that all the people were poor, they stopped conquering them” (Rowe Reference Rowe1985: 198, our translation). This is a reminder that empires conquer people, not territories (Schreiber Reference Schreiber1992: 11), and would have stopped where there were no more people worth conquering. The area may have been annexed into the personal holding of an Inca conqueror, perhaps one of Pachacuti’s three sons, who were active in military campaigns. The conqueror may have left one of his lieutenants in charge, perhaps named Uspallata (Bárcena Reference Bárcena1994: 27). Another possibility is that there was no need to impose direct control because the lowlands were administered indirectly (García Reference García2009). One historical document hints the Inca explored as far south as the Diamante River in central Mendoza (Figure 1), where they left a marker and turned around (Bibar Reference Bibar1966: 155, cited in García Reference García2011a: 158; see Ots and Cahiza Reference Ots and Cahiza2013: 39). All of these possibilities could be better evaluated with a more explicit interpretation of the Empire’s material signature (see García Reference García2011a, Reference García2011b; Tantaleán Reference Tantaleán2015) in addition to an improved chronology. Bayesian models from neighboring regions would make it possible to define sequences from neighboring regions of central Chile, north-central Chile, and the Province of San Juan.
The model results agree well with Bayesian models from other regions, which begin to outline a radiometric chronology of the southern expansion. It was begun quite early and prior to the northern expansion, suggesting a major revision to the traditional chronology. Just south of Lake Titicaca at the Inca provincial capital Tiquischullpa (Figure 1), a preliminary Bayesian model of radiocarbon dates published by Pärssinen and Siiriäinen (Reference Pärssinen and Siiriäinen1997: Table 1) suggests that the Inca occupation, associated with three 14C dates, took place between cal AD 1310–1350 (medians of the First and Last dates of the Inca phase, with overlapping 68% probabilities of cal AD 1270–1400), estimated with IntCal13. Moving south, the Inca arrived in northwestern Argentina slightly later, around cal AD 1380–1400 (68% probability, Starting boundary) (Greco Reference Greco2012: Figure 8.15b). This range is similar to estimates for northern and central Chile (Schiappacasse Reference Schiappacasse1999; Cornejo Reference Cornejo2014). Finally, the Inca continued south and arrived in Mendoza at around cal AD 1380–1430 (68% probability, Start Inca occupation). Hence, the southern expansion was probably completed before the initial incursion into Ecuador at around cal AD 1430–1460 (68% probability, Start Inca occupation) as estimated from the model of Chamical. Overall, this chronology suggests that the empire began expanding at least a century earlier than proposed by the traditional chronology. It also supports the idea that the conquerors moved rapidly through large territories and then consolidated gradually, at least in the southern part of the empire where there was little armed resistance. Future research on the southern expansion would benefit from radiometric dates and a Bayesian model of the empire’s recently rediscovered southern capital near Oruro, Paria (Pärssinen et al. Reference Pärssinen, Kesseli and Faldin2010), which was probably the logistical base for forays into Chile and Argentina (Figure 1). The site’s large size of 100 ha and rich documentary information gives it great potential to shed light on the nature and timing of incursions farther south.
While inaccurate about the chronology of territorial expansion, historic documents do offer information on the people involved. The southern conquest is attributed to the reign of emperor Topa Inca by various chroniclers, which seem to have had similar sources of information (Rowe Reference Rowe1985: 200–1, 210). They suggest that the southern expansion was begun by Topa Inca’s father Pachacuti (Figure 1). Topa Inca’s brothers Amaro Topa and Topa Yupanqui probably participated (Rowe Reference Rowe1985: 199) in order to conquer their own lands, because they would not inherit their father’s holdings (Ogburn Reference Ogburn2012: 233–4). Since the chronicles reflect official royal versions of history, they may be attributing the conquests of the three brothers to only Topa Inca. The three brothers may have been expanding in multiple directions before or after their father’s death and established the empire’s southern limit in Mendoza. The official histories generally attribute entire regions to a single emperor, but large, rapid conquests were probably led by multiple leaders at the same time and then simplified in oral accounts.
The end of the Inca occupation of Mendoza is unclear. The ending boundary of the model is cal AD 1500–1600 (95% probability, End Inca occupation). This boundary is heavily influenced by the historical date that the sites were in ruins by AD 1595, so it does not offer a robust estimate of when the occupation ended (Figure 3). It is possible that Inca sites in Mendoza were abandoned soon after Pizarro’s AD 1532 arrival in Peru, but it may also be that occupation continued into the Colonial period. One site, Tambillos, had a diagnostic Colonial sherd (Table 4), though this is quite limited evidence to argue for a post-Inca occupation. Additional models with dates and priors from the Inca occupation and the early Colonial occupation could significantly improve the estimate of the Inca departure from Mendoza.
CONCLUSION
The emerging archaeological chronology of the Inca expansion confirms that dates in documentary sources are incorrect and strongly supports the argument to build an Inca chronology with radiometric dates and Bayesian models. Contrary to the traditional sequence of conquests, the southern expansion began first. Inca forces arrived in northern Argentina and Chile in the final decades of the 14th century. They probably arrived at the southeastern edge of their empire in Mendoza at cal AD 1380–1430 (68% probability). At this point, the empire stopped expanding southward and occupied the area for the next 100–190 yr (68% probability). Conquering leaders then looked north and marched on Ecuador beginning cal AD 1430–1460 (68% probability). To improve our picture of how Inca expansions progressed, dates and detailed stratigraphic priors should be harnessed with site-specific Bayesian models. Regional models can be useful in establishing the sequence of Inca occupations in different parts of the empire, toward refining and testing the expansion chronology outlined here.
One challenge for improving the Inca chronology will be for Inca ethnohistorians and archaeologists to learn to use Bayesian modeling or establish partnerships to take advantage of this method. Bayesian analysis has been used by UK researchers since the 1990s (e.g. Buck et al. Reference Buck, Cavanagh and Litton1996; Buck and Millard Reference Buck and Millard2004; Buck and Meson Reference Buck and Meson2015) and has become increasingly common in archaeology throughout the world (Bayliss Reference Bayliss2015). It was featured in a 2015 special issue of World Archaeology (volume 47, issue 4). Computer programs have made these analyses increasingly more accessible, among which OxCal stands out as a free, powerful, and continuously updated program (Bronk Ramsey Reference Bronk Ramsey2009a).
The main goal of this paper was to test the hypothesis that the Inca began expanding the empire earlier than suggested by the traditional ethnohistoric chronology. This was confirmed for both Ecuador and Mendoza with Bayesian models. The more general goal of this paper was to make a case for more abandoning the traditional Inca chronology for radiometric dates and Bayesian models. While individual dates have little promise to refine Inca chronologies, Bayesian models certainly do, especially when informed by detailed stratigraphic relationships and ceramic descriptions. Bayesian modeling of Inca dates is just beginning, so it still holds great potential. Better chronologies can improve our understanding of the empire’s history, internal workings, the nature of expansion, and interactions with local groups.
Acknowledgments
Thanks to the participants of the OxCal online forum, who for years have helped the first and second author navigate the finer points of OxCal, especially Alex Bayliss, Christopher Bronk Ramsey, Dan Contreras, and Andrew Millard. Tom Dye patiently assisted with the construction of the tempo plot. María Jose Ots clarified details from the site Agua Amarga. Sebastián Mundt and Horacio Chiavazza pointed out useful references. A preliminary version of the Inca phase model was presented at the 19th Congreso Nacional de Arqueología Argentina as part of the symposium Tawantinsuyu 2016; we extend our thanks to the organizers. The first and fourth authors acknowledge the continuing support of CONICET. Two anonymous reviewers made detailed and constructive criticisms that significantly improved the manuscript. We are grateful to all of these people. Any errors remain our own.
SUPPLEMENTARY MATERIAL
To view supplementary material for this article, please visit https://doi.org/10.1017/RDC.2016.118