

DISCUSSION POINTS
-
• The variability of wind and solar electric power is a consideration when integrating increasing amounts of renewable electric power.
-
• Interconnecting many wind plants with large transmission lines is not a cost-effective method to smooth variability, but other methods are available.
-
• While electric energy storage is helpful in smoothing out variability so that transmission lines can be more fully utilized, storage is unlikely to be profitable at large scale.
Introduction
Air pollution from the generation of electric power degrades human health Reference Lave and Seskin1,Reference Laden, Schwartz, Speizer and Dockery2 and is a major source of greenhouse gas. 3 Low-pollution sources such as some renewable electric energy generators are one option for reducing such emissions.
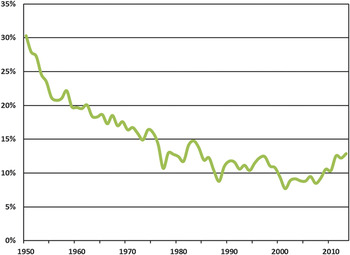
Renewable energy as a percentage of electricity generation in the United States fell from 30% in 1950, when hydroelectric power was the only significant renewable, to a low of 8% in 2001, as the market share of hydroelectric power was eroded by fossil fuel generation that was built to keep up with rapidly increasing demand for electricityFootnote * (Fig. 1). By 2013, renewables' market share had increased to 13%, primarily due to policies that encouraged an increase in wind power's proportion of generation.
Annual market share of renewable electric power generation, including hydroelectric power, in the United States from 1950 to 2013. The effect of increased wind power is evident in the past few years. The dips in renewables' market share in 1976, 1987, 2001, and other years are largely due to reduced rainfall and consequently decreased hydroelectric production. 4

Renewables in the U.S. may be able to regain or exceed the share of electric power they represented in 1950 if policies that encourage their adoption are continued. Unlike natural gas, coal, or nuclear plants, many of these power sources do not produce power on demand; they are subject to the variability caused by changes in the rainfall, wind, seasonal, and daily changes in sunlight, and clouds at timescales from seconds to decades. Most biomass and hydrogeothermal power production plants do not exhibit the sorts of variability observed in wind and solar plants. Hydroelectric plants have seasonal variability and other time-dependent constraints as captured in what are known as their guide curves, but their power production is steady in the short term. This study focusses on the integration of variable power sources such as wind and solar electric production.
In the first six months of 2014, wind supplied 10% of the electric energy generated in Germany and solar supplied 7%. Reference Burger5 It is likely that the proportion of electricity generation supplied by wind and solar energy in the United States can increase by about fivefold, from the present 4.3% to 20 or 30%; there are some indications from Germany and Spain that land use issues may limit the use of wind and solar power above those levels. 6 Many authors found that natural and engineering limits on wind power are only upper bounds; for example, Marvel et al. Reference Marvel, Kravitz and Caldeira7 wrote that “It is likely that wind power growth will be limited by economic or environmental factors, not global geophysical limits.” New sites for large-scale hydroelectric power in the United States have not been developed in the past fifty years, largely due to land use concerns. Renewable portfolio standards have been enacted that require up to 40% renewable energy (in the case of Hawaii). California provides evidence that renewable portfolio standards can be achieved. In 2012, its three major investor-owned utilities, Pacific Gas and Electric (PG&E), Southern California Edison (SCE), and San Diego Gas & Electric (SDG&E), were each able to meet a required mandate of supplying their customers with 20% of their energy from renewable sources. 8 California has committed to a 33% renewable market share. 9 While this is not a generalization applicable to areas such as the southeastern USA, high penetration of variable generation is occurring in some areas. Other regions, such as Texas, have been able to achieve and (in some cases) exceed targets that are less ambitious.
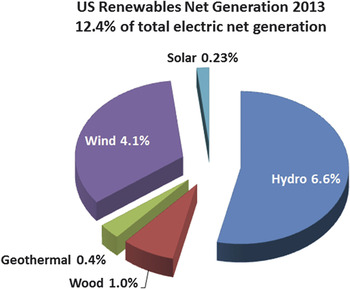
Wind power generators are the lowest cost and most widely available nonhydroelectric renewable power plants, so wind is expected to continue to dominate the growth in renewable energy power production in the U.S.Footnote † as it does at present (Fig. 2). In certain regions, solar electricity may present significant new contributions to the operations of the power grid. Geothermal power can be competitive in certain locations, and there is potential to use not only hydrogeothermal power (where nature supplies the hot water) but also enhanced geothermal power (where water is injected into hot underground rock and returned to the surface for use in generating electricity). Wood is used primarily as cogeneration in the pulp and paper industry, where black liquor boilers produce steam for both process heat and onsite power generation.
2013 U.S. renewable electricity generation by source. Values represent the percentage proportion of total U.S. generation from each generation type. Pie segments represent the share of renewable generation. 4

The variability of most renewable generation introduces system-level costs into the management of the electric grid; these arise from the need to manage the inherent variability. Hirth et al. Reference Hirth, Ueckerdt and Edenhofer10 have published an excellent recent framework for variability costs, focusing on wind and solar power and have compiled a large number of estimates from the peer-reviewed and gray literature.
Much of the work summarized below is the result of research performed during the four-year RenewElec (short for renewable electricity) project by a team of technical and policy experts at Carnegie Mellon University, the University of Vermont, Vermont Law School, and the Washington environmental law firm of Van Ness Feldman.
Characteristics of wind and solar power variability
Generation produced from wind and solar photovoltaic (PV) plants varies with time. Utility-scale renewable generators vary on both short- and long-term timescales, which can influence both power quality and reliability.
One method commonly used to measure variability is to construct a histogram of the step changes in power output over time. Reference Wan and Bucaneg11,Reference Wan12 Moura and de Almeida Reference Moura, de Almeida and Rebennack13 give a nice compilation of wind step changes in Europe. This method gives the statistics of the size of jumps in power output at various timescales (e.g., hourly). A complementary method, estimating the power spectral density (PSD), characterizes variability using power spectrum analysis. Reference Apt14–Reference Lueken, Cohen and Apt16 This method uses power output data to measure variability as a function of frequency. Imagine the music from a symphony orchestra; the PSD would give the volume of the bass notes from the timpani compared to that from the piccolo's treble notes.
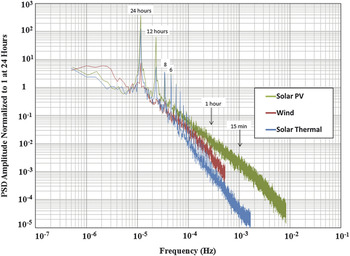
To perform power spectral analysis, the frequency domain behavior of the time series of power output data from generation plants is used to estimate the PSD. From these data, the discrete Fourier transform of the time series is computed. This results in a quantitative measure of the ratio of fluctuations at high frequency to those at a low frequency. Figure 3 shows the results of such an analysis of the power spectra of solar PV, wind, and solar thermal generation facilities.
Power spectra of solar PV, wind, and solar thermal generation facilities. The spectra have been normalized to one at a frequency corresponding to approximately 24 h. The PV plant had a capacity of 5 MW at the time these data were obtained. The solar thermal plant's capacity was 75 MW. Reference Lueken, Cohen and Apt16

The first important result from such an analysis is that the variability of all three generation types is much stronger at low frequencies (say, those corresponding to timescales of several hours to several days) than it is at high frequencies (minutes to seconds). This feature of nature has large economic consequences. The spectral power of high-frequency variability is many times smaller than that of low-frequency variability. If it were not, grid operators would need to use many generators that can quickly change their output (e.g., batteries or hydroelectric plants). Because the variability is sharply reduced at high frequencies, as first postulated in 1941 for turbulent fluids, Reference Kolmogorov17 the need for these expensive generators that change their output power rapidly is also sharply reduced. In slightly more technical terms, there is a linear region in the spectrum of wind turbine output power over four orders of magnitude of frequency, between about 30 s and 2 days, where the power decreases as the frequency f increases, as f −5/3, as predicted by Kolmogorov. Reference Apt14
The second result is that the variability characteristics of wind, solar PV, and solar thermal power generators are quite different from each other. By normalizing the spectra at a frequency corresponding to a range near 24 h for each of the three power sources analyzed, the difference in the variability of each resource at high frequencies is observable. These differences include:
-
• Solar PV electricity generation has approximately one hundred times larger spectral power variations at approximately 15 min (10−3 Hz) than the solar thermal electricity generation. The thermal inertia of the working fluid in solar thermal collectors reduces the fluctuations caused by clouds moving rapidly in front of the sun.
-
• Wind plant electricity generation is midway between solar PV and solar thermal at this timescale.
-
• Power spectra for all three sources for periods at frequencies corresponding to time periods greater than about 6 h (4 × 10⁻⁵ Hz) are similar.
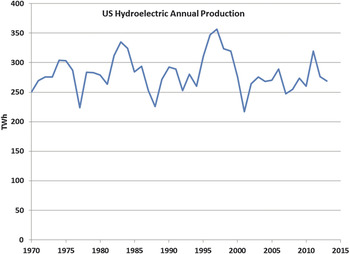
Hydroelectric power production in the United States has year-to-year variability that is a consequence of years with more and less precipitation. The annual production of hydro plants has varied by roughly ±20%, with three major drought years since 1975 and two major high-production years in the same period (Fig. 4). Katzenstein et al. Reference Katzenstein, Fertig and Apt18 estimated interannual variability of wind power production in the U.S. Great Plains states by scaling airport wind data acquired at 8 or 10 m from 1973 to 2008 up to 80 m wind turbine hub height. Their estimate was that wind power production from this region (North Dakota to Texas) would have interannual variability of approximately ±10%.
Total hydroelectric power produced in the United States, 1970–2013. 4

There are many ways that grid operators have responded to increased variability due to the wind not blowing all the time and clouds blocking the sun during the day. Recent results that pertain to the following responses that are available to integrate variable renewable generators at large scale are discussed here:
-
• Better prediction of variability
-
• Strategies for managing variability, including geographic aggregation and storage
-
• Changes in the operation of power plants, reserves, transmission systems, demand response (DR), and storage
-
• Improved siting of renewable facilities
Better prediction of variability
Electric power system operators use wind power forecasts that range from a few minutes to several days to help them make decisions that are used for economic dispatch or real-time trading (up to one hour), and longer for unit commitment decisions and day-ahead market bids for wind plant operators. As part of their decision-making process, grid operators must also take into account the uncertainty in the wind forecast.
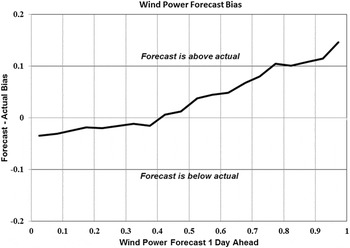
Mauch et al. Reference Mauch, Apt, Carvalho and Small19 found that forecasts of wind power in the United States systematically underpredict wind during periods of light wind and overpredict when there are strong winds (Fig. 5). This is important for those who manage power from a number of sources including wind power. It is the grid operators' responsibility to make sure that the power production matches consumers' demand for electricity at times as short as a few tenths of a second. To support large-scale deployment of wind and solar power, these operators can improve integration by correcting for forecasting errors.
Wind forecast bias as a function of the day-ahead wind forecast in the Electric Reliability Council of Texas (ERCOT) for 2009 and 2010. The horizontal scale has been normalized so that 1 represents the maximum wind power forecast; the vertical scale is in the same units. Reference Mauch, Apt, Carvalho and Small19

One common practice for estimating the uncertainty associated with wind power forecasts fits forecast errors to a specific distribution. Hodge et al., Reference Hodge, Florita, Orwig, Lew and Milligan20 for example, fit a hyperbolic distribution to the forecast errors in ERCOT and CAISO. This method assumes that forecast errors are independent of forecasted wind power, which is not what is observed. Forecast error distributions should be conditioned on the expected level of wind power. Using historical data for wind power forecasts and actual wind power output, Mauch et al. Reference Mauch, Apt, Carvalho and Small19 describe a method to model wind forecast errors conditioned on the forecast value by applying a logit (or logistic) transformation to the wind. Calculations of confidence intervals with this method use a model fit to the entire dataset while providing the ability to condition wind uncertainty on the wind forecast value for a given time period.
Operators define net load as the demand for electricity minus the renewable production. Almost all the existing wind power integration studies for the U.S. have used the standard deviation of net load step changes (the difference in the net load from one time period to the next) to estimate the need for regulation and load-following reserves. 21–25 Doing so implicitly assumes that load and wind are uncorrelated and that the data fit Gaussian statistical models. Neither assumption is valid, and accurate estimates of required reserve generation require a more accurate set of assumptions.
Understanding the variability of wind and net load, as well as wind-power forecast data on different timescales, provides some insight into the reliability effects of large-scale wind integration. The most common statistical method, used in almost all of the reviewed studies, is to measure statistical properties of changes in wind or net load over different time intervals (typically 10-min or 1-h interval).
Using the standard deviation as a measure of variability is a valid assumption if step changes or forecast errors are distributed according to a Gaussian probability density function. However, as noted by several authors, Reference Hodge and Milligan26,Reference Holttinen, Milligan, Kirby, Acker, Neimane and Molinski27 wind data do not follow Gaussian distributions. There is a much greater likelihood of periods where the wind fails completely than is predicted from a normal distribution. That is, the distribution of wind power has low probability but high-consequence “fat tails”.
The use of appropriate statistics should allow for increasing statistical accuracy, and thus more insightful results, in future integration studies. Methods such as the one proposed by Charles River Associates, 28 which use the magnitude of low-probability ramping events rather than standard deviations, are likely to produce balancing resource estimates that more accurately predict what will be needed to maintain system reliability. An even more useful improvement would be to build on the methods developed by KEMA, 29 which use a dynamic power system model to simulate the effect of different amounts and types of balancing resources.
Strategies for managing variability
Geographic aggregation
Electrically combining the output of several wind plants in a region can reduce variability in the aggregate power output, but the amount of reduction is dependent on the timescale involved. Reference Katzenstein and Apt30,Reference Katzenstein, Fertig and Apt18 Moura and de Almeida Reference Moura, de Almeida and Rebennack13 compile the results of decrease in forecast error due to geographic smoothing. Aggregation is achieved by interconnecting wind plants with transmission lines.
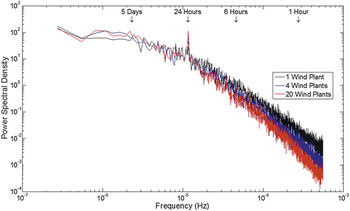
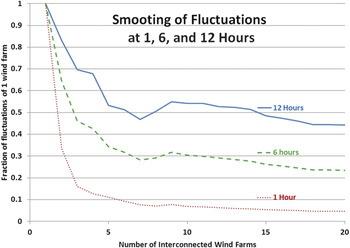
There are two important results from the analysis of data from aggregated wind plant output. First, the timescale is important when discussing the benefits of aggregation. Figures 6 and 7 show that aggregation significantly reduces variability at timescales of an hour or shorter; there is very little reduction at long timescales. The small variability at time intervals of an hour or shorter can be reduced by 95%, but the large variability at 12 h and longer is reduced by only 50%. It is the strong fluctuations at long timescales that require the most compensating resources. These fluctuations at long intervals mean that slow-ramping plants such as natural gas combined-cycle and coal can be scheduled to compensate for the variability.
PSD for 1 wind plant, 4 interconnected wind plants, and 20 interconnected wind plants in ERCOT. Reference Katzenstein, Fertig and Apt18

Fraction of a Kolmogorov spectrum of different timescales versus the number of interconnected wind plants. Reference Katzenstein, Fertig and Apt18

Second, although aggregating power from wind plants within a region reduces variability at a given timescale, there are quickly diminishing returns as more plants are interconnected. Figure 7 shows that interconnecting just 4 or 5 wind plants in ERCOT reduces the majority of the variability in power output, with only very small gains from adding additional wind plants.
Aggregating wind power generated over large geographical areas is also beneficial for reducing variability and increasing economic efficiency, but the costs of interconnection are likely to be higher than building new natural gas combined-cycle plants within each of the areas. Reference Fertig, Apt, Jaramillo and Katzenstein31 Thus, large new investments in transmission systems designed to interconnect large areas of the country are neither required nor desirable to decrease the variability of electric power generated from wind. Decreased transmission costs could change this conclusion.
There are no similar geographic aggregation studies for measured power output from solar power published in the peer-reviewed literature.
Using storage to help manage variability
Electric energy storage can provide another way to manage renewable energy variability. Grid-scale storage has very different parameters from those appropriate to electric vehicle batteries; cost, not power density, is the figure of merit. While grid-scale storage is presently limited to pumped hydroelectric facilities (with the exception of a few small installations of other technologies), there are prospects for affordable grid-scale battery storage in the near future. Reference Whitacre, Wiley, Shanbhag, Wenzhou, Mohamed, Chun, Weber, Blackwood, Lynch-Bell, Gulakowski, Smith and Humphreys32,Reference Huskinson, Marshak, Shuh, Süleyman, Gerhardt, Galvin, Chen, Aspuru-Guzik, Gordon and Aziz33 Pumped hydroelectric storage (PHS) capacity represents only ∼2% of the U.S. electric generation capacity 4 and requires special topography that is probably near maximum use in the United States. Compressed air energy storage (CAES) is another method to store electricity. Excess energy from wind power is used to compress air which is then stored underground in, for example, hollowed-out salt deposits (for grid-scale storage) or a carbon fiber storage tank (for smaller storage). When energy is needed, the compressed air is then released and heated, mixed with fuel, and used in a gas turbine to generate electricity. Because this process uses natural gas energy as fuel, the degree to which this storage process is economical depends on the price of gas (designs exist for CAES that uses no external fuel, but no operational plants have been built). There are only two CAES plants operating worldwide at the present time.
The costs of storage currently pose a barrier to large-scale deployment, although the advent of new battery technologies (e.g., Eos Energy Storage's zinc-air and Aquion Energy's aqueous hybrid ion) has reduced storage prices even for older battery technologies through competition. Storage is currently more expensive than using a dispatchable power plant, like a natural gas combined-cycle plant, to provide services to the grid. It is likely that financially successful storage will derive revenue from providing several grid services, not just one.
Hittinger et al. found that colocating a fast-ramping energy storage system, such as batteries, flywheels, or super capacitors that can respond on very short timescales to renewable power variability, can support the operations of small-scale grids. Reference Hittinger, Whitacre and Apt34 These authors modeled the power output of a system with 100 MW of natural gas capacity, 66 MW of wind capacity, and a sodium-sulfur (NaS) battery. The system has a target power output of 100 MW. Using this model, the authors found that batteries are not required until the delivered energy from wind exceeds 12% of the system total. The battery contribution to the electricity price is negligible relative to that of wind and no greater than that of the natural gas turbine. While the average costs are quite high at the higher wind levels, these costs may still be acceptable in systems with high wind requirements and high electricity prices, for example in Hawaii.
Pattanariyankool and Lave Reference Pattanariyankool and Lave35 demonstrated that the economically optimal size of a transmission line between distant wind plants and load is a tradeoff between transmission cost (that scales with the capacity of the line) and benefit from delivering wind power. A line with the nameplate capacity of the wind plant can transmit all the power produced, even on the relatively rare occasions that it produces nameplate capacity. However, such a line costs more than the optimally sized line that requires discarding power produced during such spikes. Colocating a storage device at the windy end of the line would smooth out the power to be transmitted and thus enable more of the wind plant's capability to be economically transmitted to load. Reference Hittinger, Whitacre and Apt34
While PHS is considered to be an established technology, the main challenge to using it to support wind and solar resources is the scarcity of appropriate topography. Other challenges to PHS include the long construction times and the high costs of $1–2 billion for a 1000 MW facility that can store about 8 h of power. There, currently, is about 22 GW of PHS capacity in the United States (approximately 2% of total generation capacity) and 127 GW worldwide. Although PHS storage represents a small fraction of the U.S. electricity generation, it is the dominant form of electric energy storage and is presently more economical than most other options for energy storage.
PHS has received significant attention in Portugal and Norway, where large amounts of wind power have been built in recent years. Portugal is expanding pumped hydro capacity to support wind by building 636 MW of new PHS, a 60% increase, in a system with a peak load of 9–10 GW. Wind provided 18% of Portugal's 2011 electricity. An analysis of the value of using PHS for energy arbitrage in the Iberian electricity market shows that independent PHS operators would not achieve a positive net present value. Reference Lueken36
Like Portugal, Germany would like to support its aggressive plans to expand wind power use, and storage operators might use energy arbitrage to profit from short-term price fluctuations created by the increase in wind power. Norway has considered adding to its PHS and building a transmission line to sell storage to Germany. However, investments in additions to Norwegian PHS would be profitable only if the price differential between on-peak and off-peak German energy prices significantly increases. Reference Fertig, Heggedal, Doorman and Apt37 This result further suggests that arbitrage is not sufficient for incentivizing investments in energy storage.
A CAES plant combined with a wind or solar plant could act as a baseload generator in place of fossil fuel and nuclear plants, or could be dispatched to meet peak demand. The operating flexibility of CAES also enables the system to provide ancillary services such as frequency regulation, spinning reserve, capacity, voltage support, and black-start capability. Reference Gyuk38 There are two existing CAES plants, located in Huntorf, Germany and McIntosh, Alabama. Plans for two CAES plants in Texas were announced in 2012. Apex Energy is building the 317 MW Bethel Energy Center and Chamisa Energy is building a 270 MW facility in the Texas panhandle. Both will use salt caverns for air storage and plan to earn revenue through intraday price arbitrage. Fertig and Apt Reference Fertig and Apt39 considered whether CAES is likely to be economical when used for energy arbitrage alone, with increased wind penetration and existing market structures. The results suggest that CAES does not appear likely to be profitable when used for energy arbitrage alone in ERCOT (and likely the United States in general) unless the market price differentials more than double or capital costs substantially decrease. The social benefits might outweigh the private costs if air quality benefits were included. Reference Siler-Evans, Azevedo, Morgan and Apt40
Plug-in hybrid electric vehicles have also been proposed as an energy storage source. Vehicle-to-grid energy transfer (V2G) is the term used to describe the transfer of energy back and forth between plug-in vehicles and the grid. Since vehicles are parked for the majority of the day and night, they could potentially become energy storage devices. Conceptually, an owner of a vehicle could make a profit by storing energy when the price is low and selling while the price is high. Peterson et al. examined the potential economic implications of using these batteries for grid storage for vehicles buying and selling power in three cities: Philadelphia, Rochester (New York), and Boston. Reference Peterson, Whitacre and Apt41 The research found that if battery degradation is applied to batteries with a replacement cost of $5,000, the vehicle owner's annual profit from energy arbitrage can be as low as $10 and is never greater than $120. This amount of profit is likely to be insufficient to encourage vehicle owners to use their battery packs for electricity storage. If factors such as replacing peaking generators with the batteries are taken into consideration, the profit level might be $30–$400, but only if the government offered an incentive for owners to use their vehicles for storage.
This lack of profit for large-scale energy storage does not mean that a few owners cannot make money from another energy service. V2G can help to keep the grid frequency stable when wind, solar, or load fluctuations occur. It has been known for some time that a relatively small number of vehicles can profit by providing frequency regulation services to the grid. Reference Letendre and Kempton42 Tests of using vehicle batteries for frequency regulation at small scale have been successful. Reference Kempton, Udo, Huber, Komara, Letendre, Baker, Brunner and Pearre43
The concept of “smart charging” is that a plug-in vehicle's demand for electricity would be controlled and managed relative to the amount of electricity generated by variable wind sources. Doing so may help states meet their renewable energy portfolio standards. When there are high levels of wind generation, which in the United States typically occur at night when the demand for other end-uses is low, the vehicles could potentially be charged at a lower cost while balancing the variability of wind. An analysis of the cost-effectiveness of this scenario for a hypothetical system similar to the one that serves the New York region found that controlled charging significantly reduces the cost of the vehicle charging, but the savings with high-wind penetration scenarios are not much larger than with low-wind penetrations. Controlled charging does not provide much additional value in mitigating the variability of renewable energy in these cases. Reference Weis, Jaramillo and Michalek44 These authors found that the use of controlled charging reduces system cost and the effects of electric vehicles on the grid by 50–70% or $70–$100 million per year, if electric vehicle penetration is 10%. Controlled vehicle charging was found to not help with the cost of integrating wind systems; the benefit for a 20% RPS is only slightly higher than if there were no RPS policy. This analysis assumed perfect information, no transmission constraints, and a 1-h and 15-min time resolution. Footnote ‡
Changing operations of power plants, reserves, transmission systems, DR, and storage
In some jurisdictions, a minimum amount of variable electric power generation is required by statute. In others, market and nonmarket drivers have increased the quantity of such generation. In the former, variable generators are often considered to be “must-run” until the targets have been achieved. In the latter, other strategies can be used to accommodate variable sources.
The character of power variability from wind and solar power is such that the strongest power fluctuations occur slowly over many hours or days (Fig. 3). Thus, slow-responding generators such as coal and most combined-cycle gas plants that take a long time to change their power output (called slow-ramping plants) can compensate for most of the variability. Reference Apt14
Fast-ramping power generators (those that are able to reduce or increase their power output over short periods of times, such as hydroelectric generators, natural gas turbines, newly designed flexible combined-cycle gas plants, and batteries) can play a role, because they are better suited for balancing higher frequency variability. For example, a very small complement of batteries can reduce wind power variability to the electricity transmission grid and increase the economic integration of wind power. Reference Hittinger, Whitacre and Apt34 Several U.S. electricity markets are considering market products for ramping services. Consideration in various stakeholder meetings has been given to rules that include storage and verifiable DR, rather than solely generators.
The use of fast-ramping gas plants can mitigate some of the high-frequency variability of wind. Frequent ramping of gas plants can increase emissions from the power plants, and thus reduce the emission benefits generally associated with wind. Reference Katzenstein and Apt30 New gas plant technologies like Siemens H-Class and GE's Flex 50 combined-cycle technology are designed to mitigate this effect. Coal plants can be cycled to manage the low-frequency variability of wind while incurring smaller emission penalties than those incurred by older natural gas plants that compensate for wind's or solar's variability. Reference Valentino, Valenzuela, Botterud, Zhou and Conzelmann45,Reference Oates and Jaramillo46 Incentives that would encourage coal plant cycling in China to accommodate wind's variability have been suggested by Yang et al. Reference Yang, Patino-Echeverri and Yang47
DR can also play a significant role in managing the integration of variable renewable power. A recent study has looked at the optimal generation mix with wind and DR, finding that DR facilitates the integration of renewable generation. Reference De Jonghe, Hobbs and Belmans48 DR has been analyzed for wind integration in Portugal Reference Moura and de Almeida49 and for the isolated power grid of Gran Canaria. Reference Dietrich, Latorre, Olmos and Ramos50 This is not just an academic discussion; companies such as VCharge currently bid building ceramic heating element control into the frequency response market in the US and Europe.
As briefly discussed in the introduction, the variability of wind and solar power can be predicted, but those predictions have inaccuracies that require reserve generation to be contracted for. Much short-term capacity is procured a day in advance when the day-ahead market determines which generators will be online the following day. Capacity procurement is done with a forecast of system conditions the following day. The excess capacity provides insurance against unexpected contingencies as well as forecast errors, such as higher than expected load or lower than expected wind power. Whether system operators rely on operating reserves for forecast errors or not, they still must ensure that adequate capacity is available to protect the system against a capacity shortfall. The proper amount of excess capacity depends on the uncertainty of forecasts and the cost associated with procuring additional capacity.
Operators are primarily interested in the errors that result from an underforecast of net load, since these errors are corrected by increasing generation or load curtailment from the dispatchable resources. Of course, even with no wind in the system, load forecast errors require some reserve capability. Load forecast uncertainty is dependent on the load forecast values; higher load forecasts tend to be more uncertain. The introduction of large-scale wind, with its attendant forecast errors, requires reserves that depend on the net load forecast uncertainties.
It has been shown that the standard deviation of wind forecast errors normalized by installed wind capacity decreases with additional wind capacity, largely due to spatial smoothing of the wind power. Reference Focken, Lange, Mönnich, Waldl, Beyer and Luig51 These authors found that the standard deviation of normalized forecast errors decreased 28% when the geographic area of the wind sites doubled. Mauch et al. Reference Mauch, Apt, Carvalho and Jaramillo52 used these results to model wind forecast uncertainty as a function of installed wind capacity, assuming that as wind capacity increases from 10 to 30 GW, the geographical area containing the wind sites doubles.
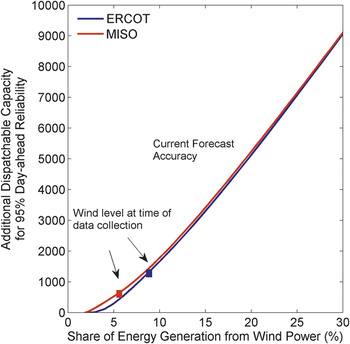
These authors modeled the ERCOT and MISO grids by scaling up wind forecast errors to simulate higher levels of wind power. High-load forecast uncertainty was used without scaling the load data. They modeled future wind uncertainty with high-load uncertainty to look at the maximum amount of generation capacity required beyond the net load forecast to compensate forecast uncertainty. A range of future capacity requirements are shown in Fig. 8 as a function of installed wind capacity for ERCOT and MISO. As wind capacity increases in ERCOT and MISO, the future day-ahead uncertainty will change. If the added wind increases the geographic diversity of the wind locations, the future uncertainty will decrease relative to the amount of wind in the system. However, if added wind is clustered around present locations, the future wind forecast uncertainty will not benefit from additional geographic diversity. Figure 8 considers the scenario in which the wind uncertainty for a future grid is the same as today. Somewhat smaller reserves would be required if the future wind uncertainty decreases due to additional geographic dispersal of the wind plants.
Additional day-ahead reserve capacity (MW) for a range of wind penetration values in ERCOT and MISO. The horizontal axis is the percentage of load served by wind power. Reference Mauch, Apt, Carvalho and Jaramillo52

Additional dispatchable capacity requirements in MISO computed by this method are much lower than in ERCOT due to the higher accuracy of load and wind forecasts in MISO's larger geographic region. As installed wind in ERCOT reaches a modeled 30 GW, dispatchable capacity requirements range from 9 to 13 GW. Since the capacity needed to cover load forecast errors is 4 GW, wind forecast uncertainty adds 5–9 GW to the day-ahead dispatchable capacity requirement. In MISO, wind adds 2–4 GW of day-ahead dispatchable capacity requirements for net load forecast error balancing. However, when the two grids are compared based on the percentage of energy coming from wind, the capacity required to compensate wind forecast uncertainty looks similar. While ERCOT has more forecast uncertainty, it also has a higher penetration of wind energy. At the time these data were collected, 8.7% of ERCOT's load was served with wind power while the percentage was 5.5% in MISO. Figure 8 shows the additional day-ahead dispatchable capacity requirements due to wind forecast uncertainty in ERCOT and MISO as a function of the share of energy from wind power in each grid.
Interstate grid operators are required by the U.S. Federal Energy Regulatory Commission (FERC) to treat all operators similarly. Specific requirements that have been introduced to manage variability of wind energy are forecasting, data and low voltage ride-through (a FERC requirement that specifies how long a wind turbine needs to remain online during any event in which the voltage on a single leg or multiple legs of the interconnecting transmission line drops).
One option, used in countries such as Denmark, Ireland, Great Britain, and Germany as part of their grid codes, is reducing the aerodynamic efficiency of wind turbines (by dynamically changing the angle at which the blades meet the wind) to decrease a wind plant's power output so that a reserve is created that can be available on demand. An analysis of using this strategy to manage the variability of wind Reference Rose and Apt53 found that this practice is less cost-effective than compensating with a natural gas turbine. In cases where it is required (perhaps when natural gas prices are very high), the requirement should not be uniformly spread across all wind turbines but instead placed on the fewest number required to achieve the desired compensation.
Improved siting of renewable facilities
When wind or solar energy displaces conventional generation, the reduction in emissions varies dramatically across the U.S. If the goal of renewable power is pollution reduction (including displacing CO2 from power plants), Siler-Evans et al. Reference Siler-Evans, Azevedo, Morgan and Apt40 found that it is much better to locate the facilities in the Mid-Atlantic States than in the Southwest or West because generators that emit a good deal of pollution are located in heavily populated areas there. Although the southwest U.S. has the greatest solar resource, a solar panel in New Jersey displaces significantly more criteria air pollutants than a panel in Arizona; Siler-Evans et al. found this results in 14 times more health and environmental benefits than in the Arizona location. A wind turbine in West Virginia displaces twice as much carbon dioxide as the same turbine in California. Depending on location, the combined health, environmental, and climate benefits from wind or solar range from $10 to $100 per megawatt-hour, and the sites with the highest energy output do not yield the greatest social benefits in many cases. As a result, Siler-Evans et al. pointed out that national production-based subsidies for wind and solar energy are poorly aligned with health, environmental, and climate benefits.
Some of the highest wind speeds in the U.S. are offshore, but currently the U.S. has no offshore wind plants. The U.S. Department of Energy has estimated that over 50 GW of offshore wind energy will be needed if the U.S. is to achieve a 20% renewable energy level. Reference Lindenberg, Smith, O’Dell, DeMeo and Ram54 Typhoons have caused wind turbines to buckle in Japan and China; hurricanes are likely to occasionally pose a similar risk. Rose et al. Reference Rose, Jaramillo, Small, Grossmann and Apt55,Reference Rose, Jaramillo, Small and Apt56 used probabilistic risk assessment to estimate the number of turbines that would be destroyed by hurricanes in an offshore wind plant at four representative locations in the Atlantic and Gulf Coasts of the United States: Galveston County, Texas; Dare County, North Carolina; Atlantic County, New Jersey; and Dukes County, Massachusetts. These authors found that, although hurricanes can pose a risk to offshore wind turbines, making small changes such as having emergency power to yaw the turbine nacelle rapidly into the wind can improve survivability. The risks can also be reduced by strengthening turbine designs. A Category 2 hurricane similar to Hurricane Ike (Galveston area) has a 95% probability of buckling one or fewer towers, but a Category 3 will buckle up to 12% of the towers. When the risk of multiple hurricanes is considered, the research found that Galveston County is the riskiest location, followed by Dare County, NC with Atlantic County, NJ and Dukes County, MA being significantly less risky.
While these analyses showed the risk to individual wind plants, a larger concern for system operators is the number of turbines that might be simultaneously unavailable as a result of hurricanes. To evaluate this risk, Rose et al. Reference Rose, Jaramillo, Small and Apt56 developed a model to estimate the catastrophe risk to offshore wind power. This analysis showed that only a small fraction of offshore wind power in a region would be offline simultaneously because of tower buckling by hurricanes. However, the cumulative damage over several years can be significantly larger, if repairs cannot be made in a single season. For Texas, there is a 10% probability that more than 0.8% of offshore wind power will be destroyed in any two-year period, more than 4.3% in any five-year period, and more than 9.2% in any 10-year period if the turbines cannot yaw.
Summary
Increasing the market share of variable renewable electric power generation in the United States from the present 4% is likely both technically and economically feasible. New research results in several areas can help to facilitate the large-scale integration of variable power sources into the electric power system. The variability of wind, solar PV, and solar thermal generation is many times stronger at frequencies corresponding to times of the order of a day than at high frequencies corresponding to times shorter than an hour. Thus, slow-ramping generators such as combined-cycle natural gas and coal can compensate for most of the variability. Solar PV plants have considerably more variability at high frequencies than solar thermal or wind plants. Interannual variability of hydroelectric generation in the United States can be as large as ±20%. It appears that the wind's aggregate variability in the windy Great Plains states is approximately half of that.
Day-ahead forecasts of wind power in the United States systematically underpredict wind during periods of light wind and overpredict when there are strong winds. It is now possible to remove that forecast bias using a straightforward logit transform.
Wind integration studies commonly implicitly assume that the demand for electricity and wind generation is not correlated, and that both can be characterized by Gaussian distributions. It has been shown that neither assumption is accurate, and such integration studies have opportunities for improved accuracy by properly accounting for these effects.
Geographic aggregation of wind plants to smooth the fluctuations in their output significantly reduces variability at timescales of an hour or shorter; however, there is very little reduction at long timescales where most of the variability occurs. The advantages quickly reduce as more wind plants are interconnected. The costs of interconnection are likely to be higher than building new natural gas combined-cycle plants within each of the areas. Large new investments in transmission systems designed to interconnect large areas of the country are neither required nor desirable to decrease the variability of electric power generated from wind.
There are companies now shipping batteries with the aim of expanding utility-scale electric energy storage beyond the present PHS facilities (these represent ∼2% of the U.S. generation capacity). Colocating storage with variable renewables can increase the utilization of transmission lines. While plug-in hybrid electric vehicles can be profitable for their owner if used for grid frequency regulation, they are unlikely to be profitable if used to mitigate the variability of renewable generation.
New extremely efficient and fast-ramping natural gas plants have come on the market. They can operate with very low air pollution emissions even while ramping to follow the fluctuations in wind and solar generation. It is now possible to predict the amount of additional capacity of this sort that must be procured by system operators to cover the uncertainty in wind forecasts; the required capacity increases roughly linearly with the share of energy generation from wind power.
Uniform national policies (such as a national renewable portfolio standard) would be less effective than specific incentives for wind and solar power in locations where they would displace high-pollution power.
Acknowledgments
This summary of recent research is based on the work of the RenewElec project and its team: Jonathan R. Dowds, Michael Dworkin, Emily Fertig, Mark Handschy, Paul Hines, Eric Hittinger, Paulina Jaramillo, Warren Katzenstein, Elizabeth Kirby, Colleen Lueken, Roger Lueken, Brandon Mauch, Jared Moore, M. Granger Morgan, Robert R. Nordhaus, David Luke Oates, Scott Peterson, Steven Rose, Deborah D. Stine, Allison Weis, and David Yaffe. Primary support for this work was provided by grants from the Doris Duke Charitable Foundation and the Richard King Mellon Foundation. Additional support was provided by The Heinz Endowments and by the Center for Climate and Energy Decision Making through a cooperative agreement between the National Science Foundation and Carnegie Mellon University (SES-0949710).