Introduction
The vestibular nerves convey information from the balance organs about the movement and spatial position of the head (see Fitzpatrick & Day, Reference Fitzpatrick and Day2004). Artificial stimulation of these nerves via the delivery of galvanic current to the overlying mastoid processes, a procedure known as galvanic vestibular stimulation (GVS) (Coats, Reference Coats1972), fools the brain into believing that the head has moved, which in turn triggers broad changes in cerebral blood flow. Preliminary evidence indicates that GVS can improve the speed and accuracy of visual performance in both neurologically healthy individuals and those who show impairment following brain injury. In one recent study, GVS speeded the rate at which healthy volunteers recalled the details of unfamiliar faces (Wilkinson et al., Reference Wilkinson, Nicholls, Pattenden, Kilduff and Milberg2008), while in another study, GVS dramatically elevated the accuracy with which a brain injured individual could detect differences between simultaneously presented faces (Wilkinson et al., Reference Wilkinson, Ko, Kilduff, McGlinchey and Milberg2005). Other studies indicate that GVS can reduce pathological biases in spatial attention (Rorsman et al., Reference Rorsman, Magnusson and Johansson1999; Saj et al., Reference Saj, Honoré and Rousseaux2006) and help overcome deficits in configural processing (Wilkinson et al., Reference Wilkinson, Zubko, DeGutis, Milberg and Potter2010). Although these results indicate that GVS can provide an effective means of facilitating visual performance, the underlying electrophysiological response has not been investigated.
General insight into how GVS affects the brain’s physiological activity has been gleaned from functional magnetic resonance imaging (fMRI) and positron emission tomography (PET), which show a relative deactivation of occipital cortex and activation of visual extrastriate cortex during GVS (Bense et al., Reference Bense, Stephan, Yousry, Brandt and Dieterich2001). These changes have been taken to reflect an attempt to counter the sensory mismatch between incoming visual and vestibular inputs. At a unisensory level, however, it remains unclear if and how these activation patterns affect the construction of visual representations. That is, whether vestibular information is used by the visual system to form sensory percepts. Other cross-modal studies have already shown that visual representations incorporate coincident information from the auditory and tactile modalities (see Lacey & Sathian, Reference Lacey and Sathian2011), and it remains to be established if the same holds for vestibular information. One reason for this lack of understanding is that previous imaging studies did not actively engage participants in a visual task. Participants instead lay passively in near darkness with the consequence that it was not possible to associate the observed patterns of brain activity with particular aspects of visual information processing. A second drawback of these previous studies is that participants received supersensory levels of stimulation. This made it difficult to disentangle the bottom-up effects of stimulation from those induced by top-down changes in attentional set. Third, the limited temporal sensitivity of fMRI and PET would have concealed any spontaneous changes in neural activity that occurred during GVS.
In light of the above, the aim of the present study was to investigate the effects of subsensory GVS on the encephalographic activity of healthy volunteers while they performed a visual task. Given that GVS has been shown to affect visual discrimination, we were particularly interested in whether it affected the N170 event-related component, a fine-grained temporal dynamic strongly associated with visual structural encoding (see Bentin et al., Reference Bentin, Allison, Puce, Perez and McCarthy1996). This waveform usually occurs 150–200 ms after stimulus presentation and is produced by early processes that precede identification. The N170 can be modulated by object category (i.e., faces vs. objects vs. words), low-level featural differences (luminance, contrast), and, especially in the case of faces, by spatial orientation (i.e., upright vs. inverted) (see Rossion & Jacques, Reference Rossion and Jacques2008). If it could be shown that GVS affects the amplitude of this time-locked waveform, then we would have moved beyond the findings of previous fMRI/PET experiments to show that GVS can bring about rapid changes in neural activity associated with visual perceptual recovery.
A second less important aim was to document the effects of GVS on more distributed forms of neuronal activity that invoke oscillations within the delta, theta, alpha, and beta frequency bands. The power spectra within these bands can be used to signal certain disease states and are also affected by the current demands of visual behavior (see Dockree & Robertson, Reference Dockree and Robertson2011). One recent study indicates that the perception and recognition of visual stimuli are particularly associated with changes to delta and theta responses (Başar et al., Reference Başar, Güntekin and Oniz2006) so we were especially interested in whether these can be altered by GVS. More generally, imaging studies show that vestibular stimulation upregulates activity within the reticular activating system, the brain’s core arousal system (Bense et al., Reference Bense, Stephan, Yousry, Brandt and Dieterich2001). This subcortical system sends fibers to many regions of cortex (see Purpura & Schiff, Reference Purpura and Schiff1997) and is believed to coordinate activity across attentional and perceptual systems (Schiff & Pulver, Reference Schiff and Pulver1999). If vestibular inputs play a significant role in arousal, then during GVS, we might expect to see increased power across those cortical sites strongly linked to attention and awareness.
To test the above hypotheses, we administered GVS to neurologically healthy participants, while electroencephalographic (EEG) recordings were concurrently performed. To elicit the N170, pictures of famous/nonfamous faces were randomly presented in either upright or inverted orientation. Given that changes in the magnitude of the N170 are not usually associated with changes in the speed or accuracy with which famous and nonfamous faces are distinguished, we did not expect GVS to alter the efficiency of behavioral response. At this stage, such overt changes seemed less important than utilizing a manipulation that is known to robustly elicit the waveform (i.e., stimulus inversion) and which in turn would provide a clear brain response for GVS to modulate. If robust electrophysiological changes could be induced, then subsequent studies could look for the behavioral correlates of any N170 modulation.
Participants viewed the faces across four blocks of trials. Blocks 1 and 4 served as pre- and poststimulation baselines and involved the administration of sham stimulation in which participants were falsely informed that they were receiving subsensory (i.e., undetectable) levels of stimulation. In blocks 2 and 3, subsensory and supersensory stimulation was administered (the order of which was counterbalanced). Subsensory intensities provided a simple means of blinding participants to the presence/absence of stimulation and are those most commonly used to facilitate behavioral performance (Wilkinson et al., Reference Wilkinson, Ko, Kilduff, McGlinchey and Milberg2005, Reference Wilkinson, Nicholls, Pattenden, Kilduff and Milberg2008, Reference Wilkinson, Zubko, DeGutis, Milberg and Potter2010). By administering separate blocks of supersensory stimulation, it was possible to determine whether higher, albeit still tolerable, levels of current invoked stronger electrophysiological responses. To control for any order effects, a separate group of participants received sham stimulation in blocks 2 and 3.
Materials and methods
Participants
Six male and 10 female right-handed (as determined by the Handedness Questionnaire of Briggs & Nebes, Reference Briggs and Nebes1975) participants (age 19–31 years) were recruited from the University of Kent in return for payment. At enrollment, participants were randomly assigned in equal number to either the active or sham stimulation group.
Stimuli
Stimuli consisted of 80 famous faces and 80 nonfamous faces, equally balanced for gender. The face images were cropped and sized at 170 × 213 pixels and displayed in grayscale on a black background, with screen resolution set to 1024 × 768 pixels. Each face was presented twice during the experiment, once in upright and inverted orientation.
Procedure
Following GVS and EEG electrode application, participants were seated in a comfortable chair in an isolated testing lab. The experiment was controlled using E-prime software. As illustrated in Fig. 1, each trial began with the presentation of a single centrally located white fixation cross on a black background for 1000 ms. After this time, the target face appeared on-screen until a response was made. Participants’ task was to indicate as quickly and accurately as possible whether the pictured face depicted a famous or nonfamous person. Responses were made by means of left/right keyboard responses, with the mapping between response type and response key counterbalanced across participants. A blank black screen appeared for 500 ms before the next trial was initiated. Trials were presented in a random order across four blocks, and at least, one block intervened between presentation of the same face at upright and inverted orientation. Thus, each block consisted of 80 face targets, 40 upright and 40 inverted, producing a total number of 320 experimental trials. Each block was separated by a 5-min break.
Schematic diagram of the experimental procedure.

Participants in the active stimulation group received bipolar binaural direct current to the left (anode) and right (cathode) mastoids during blocks 2 and 3 of the experiment, the order of which was counterbalanced. Stimulation during these blocks occurred at both a subsensory (0.4 mA) and supersensory (1–1.2 mA) level (see Wilkinson et al., Reference Wilkinson, Nicholls, Pattenden, Kilduff and Milberg2008 for details of the stepwise procedure of how sensory threshold was established. Stimulation was considered supersensory at the stage that either cutaneous sensation was felt under the GVS electrodes or participants reported vertigo, feeling of self-motion, or light-headedness). For those participants allocated to the active group, sham stimulation, in which participants were falsely informed that they were receiving stimulation, was applied during block 1 to establish a baseline and during block 4 to assess carryover. Participants in the sham stimulation group were informed at the outset that they would receive subsensory stimulation but in fact were not stimulated at all.
Electrophysiological recording and analysis
A QuickAmp amplifier system and Brain Vision recording software were used for continuous recording of EEG activity from 19 Ag/AgCl electrodes over midline electrodes Fz, Cz, and Pz, over the left hemisphere from electrodes Fp1, F3, F7, C3, T7, P3, P7, O1, and from the homologue electrodes over the right hemisphere. Eye movements and blinks were recorded with two additional sets of bipolar Ag/AgCl electrodes placed above and below the participants’ left eye (VEOG) and on the outer cathus of each eye (HEOG). During EEG recording, all electrodes were sampled at 500 Hz and electrode impedances were kept below 10 kΩ. Off-line, all EEG channels were recalculated to an average referenceFootnote 1, corrected for eye movements, and band-pass filtered (0.3–30 Hz, 24 dB/oct). Epochs of 900 ms, starting 100 ms prior to the onset of the target face, were generated from the continuous EEG record. Any trials containing artifacts, e.g., muscle activity or electrooculography (EOG), were excluded from analysis. The resulting event-related potential (ERP) waveforms were aligned to a 100-ms baseline. Finally, the signal at each electrode site was averaged separately for each experimental condition, time-locked to the onset of the target face.
Peak amplitudes were identified on a trial-by-trial basis for P1 (between 90 and 140 ms) and N170 (between 150 and 200 ms) and statistical tests were carried out at electrodes T7, T8, P3, P4, P7, P8, O1, and O2, where these effects have been shown to be maximal. Statistical analyses examined peak amplitudes for each component separately using mixed-design analysis of variance (ANOVA) with stimulation block (block 1 vs. block 2/3 vs. block 4)Footnote 2, face orientation (upright vs. inverted), electrode site (T7/8 vs. P3/4 vs. P7/8 vs. O1/2) and hemisphere as the within-subjects factors, and stimulation group (active vs. sham) as the between-subjects factor. Greenhouse–Geisser correction was used to adjust violations of sphericity for effects with more than two degrees of freedom. Note that for simplicity, the uncorrected degrees of freedom are presented here. Strength of association is reported in terms of partial eta-squared (pη 2).
Power spectral analysis
Raw EEG data during the four stimulation blocks were segmented into nonoverlapping artifact-free epochs, each lasting 3 s. Fast Fourier transform was then used to calculate the power spectrum in each epoch using a Hahn window. Power spectra data (collapsed across both face orientation conditions) were then averaged across epochs individually for each stimulation block, participant, and electrode channel within four frequency bands: Delta (0.5–3.5 Hz), Theta (3.5–7.5 Hz), Alpha (7.5–12.5 Hz), and Beta (12.5–30 Hz) and normalized by taking their decimal logarithms.
Statistical analyses compared normalized power spectral activity at each frequency band for midline electrodes (Fz, Cz, and Pz) and separately for lateral electrodes (Fp1, Fp2, F3, F4, F7, F8, C3, C4, T7, T8, P3, P4, P7, P8, O1, O2). Thus, for data recorded from midline electrodes, Greenhouse–Geisser corrected mixed-design ANOVAs were performed, with Stimulation group (active vs. sham) as the between-subjects factor and within-subjects variables: Stimulation block (pre vs. sub vs. super vs. post) and electrode (three levels). For the analysis of power at lateral electrode sites, equivalent mixed-design ANOVAs were performed, with Stimulation group (active vs. sham) as the between-subjects factor and within-subjects variables: Stimulation block (pre vs. sub vs. super vs. post), Electrode (eight levels), and Hemisphere (left vs. right). An interaction between stimulation group and block variables would indicate that, as hypothesized, GVS stimulation has modulated oscillatory activity differentially across blocks and groups. Significant differences were compared post hoc using Bonferroni-corrected t-tests. Note that for simplicity, the uncorrected degrees of freedom are presented here.
Results
Behavioral data
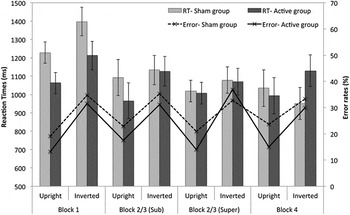
Mean correct reaction times and error rates were interrogated using separate 4 (Block) × 2 (Orientation) × 2(Group) mixed-effects ANOVAs.
Error rates
The main effect of orientation was significant, [F(1,14) = 60.29, P < 0.001], whereby upright faces were classified with fewer errors than inverted faces (18 vs. 33%). All other effects were nonsignificant (Fs < 1.8).
Reaction time
The main effects of block [F(3,42) = 5.69, P < 0.01] and orientation [F(1,14) = 5.48, P < 0.03] reached significance, reflecting significantly faster responses on blocks 2, 3, and 4 compared to block 1, and faster responses for upright versus inverted faces (1050 vs. 1138 ms). Block also interacted with orientation [F(3,42) = 5.55, P < 0.01]. Bonferroni-corrected pairwise comparisons indicated that judgments were significantly faster for upright compared to inverted faces in blocks 1 and 2/3 (Sub) but did not reach significance in blocks 2/3 (Super) and 4. All other F ratios are less than 1.0. (See Fig. 2.)
Mean correct reaction times (RT) (with standard error bars) and error rates (ER) elicited by upright and inverted face stimuli within each stimulation block and stimulation group.

ERP analysis
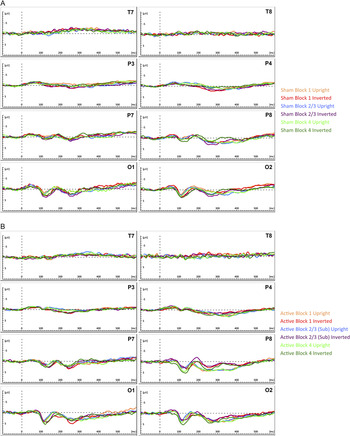
Grand average ERP waveforms are presented for the six conditions in Fig. 3, separately for each stimulation group.
Grand average ERPs elicited by the face stimuli at electrode P8, plotted separately for sham (a) and active (b) stimulation groups.

P1
In the P1 interval (90–140 ms), the ANOVA showed a main effect of electrode [F(3,42) = 21.25, P < 0.001, pη 2 = 0.6], reflecting the standard P1 topography; larger positivity over occipital electrodes (O1/2 = 4.24 μV) compared to temporal (T7/8 = 1.39 μV) or parietal electrodes (P3/4 = 0.46 μV; P7/8 = 2.86 μV). Inversion also emerged as a main effect [F(1,14) = 12.17, P < 0.004, pη 2 = 0.46], with inverted faces eliciting more positive P1 deflections compared to upright faces (2.45 vs. 2.03 μV). Electrode and inversion also appeared in a three-way interaction with stimulation group [F(3,42) = 3.83, P < 0.04, pη 2= 0.49].
N170
Analysis of the N170 component (150–200 ms) showed the predicted main effect of face orientation [F(1,15) = 44.74, P < 0.001, pη 2 = 0.76], where inverted faces led to a more negative-going wave compared to upright faces (−2.12 vs. −1.51 μV). Further, this inversion effect interacted with hemisphere [F(1,15) = 4.48, P < 0.05, pη 2 = 0.24], such that the inversion effect was largest over the right hemisphere. Inversion also appeared in a three-way interaction with electrode and hemisphere [F(3,42) = 4.33, P < 0.02, pη 2 = 0.24] and a four-way interaction with electrode, hemisphere, and group [F(3,42) = 5.36, P < 0.01, pη 2 = 0.28]. Additionally, electrode, hemisphere, block, and group emerged in a four-way significant interaction [F(6,84) = 2.78, P < 0.02, pη 2= 0.17]. To scrutinize the contributing effects of stimulation block and group at their maximal topographies, we ran follow-up analyses looking at electrodes P8 and O2 in isolation.
Analyses revealed significant stimulation group × block interactions at electrodes P8 [F(2,28) = 4.13, P < 0.04, pη 2 = 0.18] and O2 [F(2,28) = 4.3, P < 0.03, pη 2 = 0.24], suggesting that GVS stimulation has influenced the amplitude of the N170 component. Simple main effects analyses showed that the N170 differed across stimulation blocks in the active stimulation group [P8: F(2,14) = 3.71, P < 0.05, pη 2 = 0.33; O2: F(2,14) = 4.19, P < 0.05, pη 2 = 0.38], with a more negative amplitude in the subsensory stimulation block 2/3 (P8: −2.14 μV, s.e. = 1.27; O2: −2.21 μV, s.e. = 0.56) compared to prestimulation block 1 (P8: −0.66 μV, s.e. = 1.08, P < 0.02; O2: −1.08 μV, s.e. = 0.56, P < 0.02). Comparisons of block 4 (P8: −1.19 μV, s.e. = 0.88; O2: −1.29 μV, s.e. = 0.47) with block 1 or block 2/3 did not reveal any significant differences (Ps > 0.2). Importantly, no significant effects involving stimulation block were found in the sham stimulation group at either electrode (Ps > 0.3).
Power spectral analysis
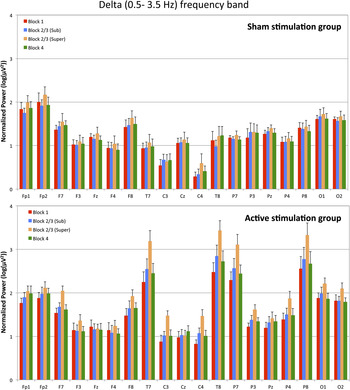
Normalized EEG power spectrum is presented for delta band activity in Fig. 4, for each stimulation group and block.
EEG power spectra in delta frequency band, showing differences across stimulation groups and stimulation blocks at each electrode site, as labeled.

Delta (0.5–3.5 Hz)
The ANOVA over midline sites revealed a main effect of electrode [F(2,28) = 8.47, P < 0.004, pη 2 = 0.38], which reflected increased delta wave activity in posterior Pz (1.32 μV2, s.e. = 0.08) compared to frontal Fz (1.18 μV2, s.e. = 0.08) or central Cz (1.06 μV2, s.e. = 0.08) sites. No other main effects or interactions were significant (Ps > 0.3).
Importantly, the ANOVA over lateral sites found a significant difference between stimulation groups [F(1,14) = 18.14, P < 0.001, pη 2 = 0.56], reflecting a general increase in activity in the active stimulation group (1.84 μV2, s.e. = 0.1) compared to the sham stimulation group (1.26 μV2, s.e. = 0.1). Analyses also revealed a main effect of stimulation block [F(3,42) = 14.26, P < 0.001, pη 2 = 0.51], which interacted with stimulation group [F(3,42) = 5.16, P < 0.01, pη 2 = 0.27]. Simple main effects analyses showed that while there was no significant difference across blocks in the sham stimulation group [F(3,21) = 1.1, P > 0.35], effects did differ between blocks in the active stimulation group [F(3,21) = 20.86, P < 0.001, pη 2 = 0.75]. This difference reflected significantly increased delta band activity during the supersensory stimulation block (2.16 μV2, s.e. = 0.1) compared to all other blocks (pre: 1.65 μV2, s.e. = 0.09, P < 0.002; sub: 1.8 μV2, s.e. = 0.1, P < 0.02; post: 1.76 μV2, s.e. = 0.1, P < 0.02) and increased activity in the subsensory stimulation block compared to prestimulation baseline (P < 0.05) (but not poststimulation). Finally, a main effect of electrode [F(7,98) = 54.5, P < 0.001, pη 2 = 0.8] and interactions between group × electrode [F(7,98) = 12.49, P < 0.001, pη 2 = 0.66], block × electrode [F(21,294) = 3.93, P < 0.001, pη 2 = 0.22], and group × block × electrode [F(21,294) = 4.56, P < 0.001, pη 2= 0.25] reflected larger delta band modulations over central (C3, C4), temporal (T7, T8), and parietal (P7, P8) electrodes, which was further enhanced in the active stimulation group during blocks 2 and 3.
Theta (3.5–7.5 Hz)
A main effect of electrode emerged across midline sites [F(2,28) = 5.39, P < 0.01, pη 2 = 0.28], with increased theta activity in frontal Fz (0.54 μV2, s.e. = 0.12) compared to posterior Pz (0.23 μV2, s.e. = 0.1, P < 0.01). Analysis of lateral electrodes showed no significant difference between stimulation groups either as a main effect [F(1,14) = 1.14, P > 0.3] or as an interaction with stimulation block [F(3,42) = 0.46, P > 0.6]. There was however a main effect of electrode [F(7,98) = 19.26, P < 0.001, pη 2 = 0.79] that also interacted with group [F(7,98) = 11.1, P < 0.001, pη 2 = 0.44]. Similar to delta band activity, this effect reflected increased theta band activity over temporal (T7, T8) and posterior (P7, P8) electrodes, which was further amplified in the active stimulation group. Finally, a main effect of hemisphere was revealed [F(1,14) = 4.72, P < 0.05, pη 2 = 0.25], showing increased activity in the right hemisphere (0.44 μV2, s.e. = 0.09) compared to the left hemisphere (0.51 μV2, s.e. = 0.1).
Alpha (7.5–12.5 Hz)
A main effect of electrode emerged over midline [F(2,28) = 5.76, P < 0.01, pη 2 = 0.29] and lateral electrode sites [F(7,98) = 46.92, P < 0.001, pη 2 = 0.77]. These effects reflected elevated alpha activity at posterior Pz (0.16 μV2, s.e. = 0.16) compared to central or frontal sites (Cz: −0.18 μV2, s.e. = 0.14, P < 0.05; Fz: −0.06 μV2, s.e. = 0.14, P < 0.04) and increased alpha in temporal (T7, T8), posterior (P7, P8), and occipital (O1, O2) electrodes sites. None of the interactions involving stimulation block or group were significant (Ps > 0.2).
Beta (12.5–30 Hz)
Once again, a main effect of electrode emerged over midline [F(2,28) = 5.61, P < 0.01, pη 2 = 0.29] and lateral electrode sites [F(7,98) = 29.82, P < 0.001, pη 2 = 0.68]. These effects were driven by increased beta activity in frontal (Fz, Fp1, Fp2), temporal (T7, T8), posterior (P7, P8), and occipital (O1, O2) electrodes sites. No other significant main effects or interactions involving block or group were found (Ps > 0.3).
General discussion
GVS has been shown to improve the speed and accuracy of visual judgments in both brain injured and neurologically healthy individuals (Wilkinson et al., Reference Wilkinson, Ko, Kilduff, McGlinchey and Milberg2005, Reference Wilkinson, Nicholls, Pattenden, Kilduff and Milberg2008); however, the underlying electrophysiological response has yet to be investigated. Here, we examined the effect of GVS on the N170, an aspect of the event-related component that is associated with early levels of visual coding. Compared to the sham, both sub- and supersensory GVS increased the amplitude of the N170. We also examined whether GVS altered power spectra within four main frequency bands alpha, beta, delta, and theta. Stepwise increases in delta and theta responses occurred as the level of stimulation increased, a pattern suggestive of broader-scale cortical modulation. Together these data provide clues to why GVS influences visual judgments and, more generally, constitute the first attempt to model the effects of GVS on the human electrophysiological response.
N170 amplification
The N170 event-related component has been associated with a variety of early stimulus encoding processes that precede identification (Bentin & Deouell, Reference Bentin and Deouell2000; Eimer, Reference Eimer2000), including those that support face detection and emotional categorization as well as the processing of both words and common nonface objects (see Rossion et al., Reference Rossion, Joyce, Cottrell and Tarr2003; Kim & Lai, Reference Kim and Lai2012). This has led to the idea that the N170 reflects a variety of visual perceptual processes distributed across the occipital–temporal pathway (Rossion et al., Reference Rossion, Joyce, Cottrell and Tarr2003). The observation that GVS modulates the N170 is important because it forces a reconsideration of why GVS changes blood flow across visual cortex. At one level, these changes are likely to reflect an attempt by the brain to counteract the vestibular–visual conflict induced by GVS (see Brandt et al., Reference Brandt, Glausauer, Stephan, Bense, Yousry, Deutschländer and Dieterich2002). But at another level, these changes may also reflect a more specific effect of GVS on unisensory visual processing. Signals from the vestibular system cannot provide information about the visual properties of faces, and yet, these signals somehow modulate how faces are coded. This multisensory interplay is known to occur between vision and other sensory modalities. For example, coincident sensations of touch or sound can enhance judgments of nearby color (see Driver & Noesselt, Reference Driver and Noesselt2008). Despite a burgeoning literature on cross-modal perception, none have addressed if and when visual structural encoding is affected by vestibular information. This oversight is perhaps all the more surprising given that both modalities provide information about spatial location and head movement. Although we can only speculate on why vestibular information impacts visual encoding, the current data are nevertheless important because they provide the first evidence that this interplay exists. In showing that subsensory GVS selectively modulates early components of the event-related visual response, we have also gathered evidence against the idea that the behavioral improvements reported in other vestibular stimulation studies reflect nonspecific attentional arousal. If that were the case, then we might only have expected ERP modulation during supersensory stimulation where the participant could feel that he/she was being stimulated and, in consequence, changed his/her attentional strategy.
Focusing more directly on the source of N170 modulation observed here, we were able to confirm other reports that face inversion increases N170 amplitude (see Eimer, Reference Eimer2000). This effect is believed by some to reflect a shift from global to more part-based perceptual analyses (Searcy & Bartlett, Reference Searcy and Bartlett1996). Interestingly, physical rotations of the head (and body) within the roll plane reduce the inversion effect (Lobmaier & Mast, Reference Lobmaier and Mast2007). This reduction points towards a greater local processing bias and has been attributed to the misalignment of retinal and gravitational reference frames, which makes it harder to discern the orientation of stimuli. This result is relevant to the current data because bipolar binaural GVS (i.e., the type of stimulation applied here) simulates head rotation within the roll plane (with a small yaw component) towards the cathodal electrode (Fitzpatrick & Day, Reference Fitzpatrick and Day2004). The implication is that GVS may modulate the N170 because, in signaling head roll, it encourages the brain to adopt a more part-based visual coding strategy.
In support of the above idea, we note that two of the experiments in which GVS has been shown to enhance visual perception both involved the direct matching of local information; in Wilkinson et al. (Reference Wilkinson, Ko, Kilduff, McGlinchey and Milberg2005), the task was to compare the orientations of the eyes and mouth in two adjacent face images, while in Wilkinson et al. (Reference Wilkinson, Nicholls, Pattenden, Kilduff and Milberg2008), the task was to compare the size or shape of other facial features. Unfortunately, the behavioral measure used in the current study (famous/nonfamous face judgments) tapped different processes to those examined in the ERP waveforms (upright/inverted faces), making it difficult to assess the relationship between behavioral response and N170. As such, the priority for future study must be to administer a task that, unlike the present one, is both relatively hard and yields a clear measure of local processing bias. If our interpretation is correct then under such conditions, concurrent GVS will lead to an enhanced N170 and behavioral improvement. Such an outcome would be especially relevant to individuals who suffer from face-blindness (i.e., prosopagnosia) and who show a depressed or absent N170 (Kress & Daum, Reference Kress and Daum2003; Minnebusch et al., Reference Minnebusch, Suchan, Ramon and Daum2007).
Spectral power amplification
The largest modulations of power were produced in the delta band frequency window, with a clear interaction between stimulation block and stimulation group. Specifically, increases in delta band activity were largest during supersensory stimulation and relatively increased during subsensory stimulation compared to baseline. Increased delta responses have been observed when faces must simply be detected as opposed to identified (Başar et al., Reference Başar, Özgören, Öniz, Schmiedt and Başar-Eroğlu2007), and when Thatcherized, compared to non-Thatcherized, faces are viewed (Gersenowies et al., Reference Gersenowies, Marosi, Cansino and Rodriguez2010). This has led to the idea that delta activity partly reflects the recruitment of networks underlying structural face encoding as opposed to higher-level semantic processing (Başar et al., Reference Başar, Schmiedt-Fehr, Öniz and Başar-Eroğlu2008). Since the increased delta band activity in the current study occurred over posterior and temporal, rather than frontal sites, it is highly unlikely that this effect simply reflects eye blink artifacts. The coincident, albeit more modest, increase in temporal–occipital theta activity has also been linked with global face detection, although there is evidence that elevated theta also occurs when familiar and unfamiliar faces must be distinguished (Başar et al., Reference Başar, Özgören, Öniz, Schmiedt and Başar-Eroğlu2007). On a cautionary note, although elevated delta and theta oscillatory responses have been strongly linked with face processing, one must not lose sight of the fact that the strong vestibular pertubations invoked by GVS affect a variety of brain systems associated with sensory integration and motor control (e.g., Fitzpatrick & Day, Reference Fitzpatrick and Day2004).
The widespread increases in spectral power also fit with the idea that vestibular stimulation increases cortical arousal (see Schiff & Pulver, Reference Schiff and Pulver1999). The vestibular nerves project to subcortical nuclei that share connections with the reticular activating formation, thalamus, and anterior corpus callosum—key elements of the brain’s core arousal system. When these structures are stimulated by microelectrode, they desynchronize slow large-amplitude cortical EEG waves associated with sleep and produce global disturbances of consciousness when focally ablated (see Schiff & Pulver (Reference Schiff and Pulver1999). The remediation of several neuropsychological impairments, including hemispatial neglect (Rorsman et al., Reference Rorsman, Magnusson and Johansson1999), anosagnosia (Cappa et al., Reference Cappa, Sterzi, Vallar and Bisiach1987), asomatognosia (Schiff & Pulver, Reference Schiff and Pulver1999), and hemianesthesia (Bottini et al., Reference Bottini, Paulesu, Gandola, Loffredo, Scarpa, Sterzi, Santilli, Defanti, Scialfa, Fazio and Vallar2005) during vestibular stimulation have been attributed to increased global arousal, and the current changes in power spectra during GVS support this interpretation.
In summary, we have demonstrated that GVS modulates specific aspects of the electrophysiological response. Given that the modulation occurred at subsensory levels, it is possible to discount the role of nonspecific factors invoked by attentional set. Previous studies have indicated that subsensory GVS can enhance the speed and accuracy of certain visual judgments (e.g., Wilkinson et al., Reference Wilkinson, Ko, Kilduff, McGlinchey and Milberg2005, Reference Wilkinson, Nicholls, Pattenden, Kilduff and Milberg2008), and here, we show that allied components of the brain’s oscillatory response associated with visual encoding are likewise elevated. These data imply that GVS constitutes a novel tool with which to manipulate processes associated with specific components of the event-related response, and from a clinical perspective, raise the hypothesis that patient groups who show either a depressed N170 (such as some prosopagnosics—Kress & Daum, Reference Kress and Daum2003) or low cortical arousal (following severe brain injury) will benefit from this simple procedure.
Acknowledgments
This study was partly funded by a British Academy grant (SG102500) awarded to D.W. and H.J.F. We thank Teri-Rose Johns for assisting with data collection.