Introduction
An increasing number of genetically modified maize varieties and hybrids are used in agriculture, but their effects on their wild relatives located in centres of crop origin and diversity are unknown. In Mexico, a country that harbours over 60% of the genetic variation of maize (Zea mays L.) (Piñeyro-Nelson et al., Reference Piñeyro-Nelson, van Heerwaarden, Perales, Serratos-Hernández, Rangel, Hufford, Gepts, Garay-Arroyo, Rivera-Bustamante and Álvarez-Buylla2009), the effects of gene flow, caused by the spatial and temporal dispersion of unwanted transgenic plants (AP) over traditional maize landraces and wild relatives such as Tripsacum and teocinte, are unknown. Different authors have reported different results in terms of detecting AP maize in Mexico. Two recent studies showed the presence of AP in the south-east and west-central regions of Mexico (Dyer et al., Reference Dyer, Serratos-Hernández, Perales, Gepts, Piñeyro-Nelson, Chavez, Salinas-Arreortua, Yúnez-Naude, Taylor and Alvarez-Buylla2009; Piñeyro-Nelson et al., Reference Piñeyro-Nelson, van Heerwaarden, Perales, Serratos-Hernández, Rangel, Hufford, Gepts, Garay-Arroyo, Rivera-Bustamante and Álvarez-Buylla2009).
The group testing method of Dorfman (Reference Dorfman1943) is effective for reducing the number of laboratory analyses. It involves dividing n individual samples (e.g. seeds) into g groups (or pools), each of size k. A formula for determining the sample size (n) required for detecting the AP can be derived from the Dorfman method. However, a major disadvantage of the Dorfman testing plan is that it is insensitive to the dilution that occurs when the group is formed; this is particularly true for large group sizes where the number of AP kernels in the pool can be diluted below the sensitivity of the analyses, which causes the rate of false negatives to increase. However, Hernández-Suárez et al. (Reference Hernández-Suárez, Montesinos-López, McLaren and Crossa2008) proposed models within the framework of the Dorfman model that consider the dilution effect when forming groups (pools) of seed to be tested, the detection limit of the laboratory test, and the different rates of false positives and false negatives. They also provide an assessment of consumer and producer risks assuming binomial and negative binomial distributions.
When attempting to detect AP, group testing can be used to reduce testing costs. Group testing is used for inferring small binomial proportions if the assay used is sensitive and expensive (Thompson, Reference Thompson1962; Swallow, Reference Swallow1985; Tebbs and Bilder, Reference Tebbs and Bilder2004; Hernández-Suárez et al., Reference Hernández-Suárez, Montesinos-López, McLaren and Crossa2008). In pool testing, groups of individuals are characterized instead of single individuals, so that the possible outcomes are a negative pool if all individuals are negative or a positive pool if just one individual is positive. Supposing the only objective is to estimate the proportion of AP in the population, it is important to design an experiment that guarantees the appropriate sample size for assuring narrow confidence intervals (Schaarschmidt, Reference Schaarschmidt2007). For this reason, sample size calculation plays an important role in the design of optimal agricultural experiments. A small sample size cannot assure sufficient precision for estimating the parameter of interest, while too large a sample size is an unnecessary waste of resources (Wang et al., Reference Wang, Chow and Chen2005).
Traditionally, statisticians have formulated sample size requirements in terms of power considerations. This approach is consistent with the emphasis on hypothesis testing for inference with results reported in terms of P values. Recently, there has been a growing interest in the use of confidence intervals (CI) instead of hypothesis tests for inference-making purposes (Pan and Kupper, Reference Pan and Kupper1999). In fact, some journals, recognizing potential problems with hypothesis tests, have recently adopted editorial policies (or issued editorial statements) encouraging the use of CI in papers submitted for publishing. Often, journal articles state that a hypothesis test for an effect is significant (or not) without giving a precise characterization of the effect whose null value is being tested. The use of CI ensures not only that the magnitude of the effect can be better assessed, but also that the effect in question can be readily identified by the reader. Furthermore, CIs also convey information about how precisely the magnitude of the effect can be ascertained from the data at hand (Beal, Reference Beal1989).
For the reasons mentioned above, attention has been given to design-stage methods for calculating sample sizes appropriate for CI-based statistical inferences. This approach to sample size estimation has been termed accuracy in parameter estimation (AIPE), because when the width of the (1 − α)100% CI decreases, the expected accuracy of the estimate increases (Kelley and Maxwell, Reference Kelley and Maxwell2003; Kelley et al., Reference Kelley, Maxwell and Rausch2003; Kelley and Rausch, Reference Kelley and Rausch2006; Kelley, Reference Kelley2007). Although the AIPE approach to sample size planning is not new (e.g. Mace, Reference Mace1964), it has been examined and used more in social science than in the agricultural sciences. However, CI estimation in agricultural studies is important because the goal is often to estimate the magnitude of the effect of interest, rather than simply to decide whether or not a treatment effect is significantly different, from a statistical point of view, than the effect of another treatment.
To perform sample size calculation, information regarding some parameters needs to be obtained. In practice, however, those parameters are unknown and usually obtained from the literature or from pilot studies. The estimates are then treated as true parameters. Consequently, this action fails to account for the uncertainty induced by the sampling error. As a result, the sample size obtained may not achieve the desired CI width for estimating a parameter, as was originally planned (Wang et al., Reference Wang, Chow and Chen2005). To account for the uncertainty induced by the sampling error, Kelley et al. (Reference Kelley, Maxwell and Rausch2003) and Kupper and Hafner (Reference Kupper and Hafner1989) pointed out that the stochastic nature of the CI width should be considered to avoid underestimating the sample size required to achieve the desired width (ω). These authors numerically demonstrated the underestimation of the sample size when using either a normal random sample or equal-sized random samples from two normal populations with common variance to make statistical inferences about population means. Wang and Kupper (Reference Wang and Kupper1997) extended this methodology to the case of unequal-sized random samples from two normal populations with unequal variances. Montesinos-López et al. (Reference Montesinos-López, Montesinos-López, Crossa, Eskridge and Hernández-Suárez2010) proposed an iterative sample size procedure for detecting and estimating the proportion of transgenic plants that assure a CI width (W) that is narrower than the desired value (ω) under the Dorfman model; however, this exact computational method does not give a closed analytical solution.
The objective of this research was to propose an analytical method for determining sample size given in terms of the required number of pools, with the aim of estimating the proportion of AP (p) using group testing with a perfect test and fixed pool size (k) that will assure a narrow CI. Accuracy in the estimation of p is achieved because the CI width is considered stochastic and thus treated as a random variable. We present an R program to reproduce the results and make it easy for the researcher to create other scenarios.
Materials and methods
Maximum likelihood estimate and confidence intervals for p under group testing
The estimator based on group testing gives rise to the following maximum likelihood estimate (MLE):
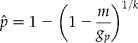
where k is the pool size, g p is the number of pools tested and m is the number of positive pools observed. This is the conventional MLE of p for group testing with groups of equal size and no detection threshold. For this MLE of p ( ) and according to Hepworth (Reference Hepworth1996) and Tebbs et al. (Reference Tebbs, Bilder and Moser2003), the following is the corresponding Wald CI:
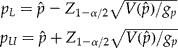
where

 , Z 1 − α/2 is the 1 − α/2 quantile of the standard normal distribution, and
 is the MLE estimated from equation (1). This approximation of the CI is easy to calculate and allows deriving closed form sample size formulas. However, when g p and p are small, the normal approximation for the MLE may be doubtful; in such cases, the Wald-type CI often produces negative endpoints. In addition, the coverage probability of the CIs constructed by Wald-type CIs is often smaller than 100(1 − α)%. Further details on determining the optimum pool size can be found in Katholi and Unnasch (Reference Katholi and Unnasch2006) and Montesinos-López et al. (Reference Montesinos-López, Montesinos-López, Crossa, Eskridge and Hernández-Suárez2010).
Derivation of the sample size formula for detecting transgenic plants
The quantity 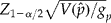 (added and subtracted to the observed proportion,
 ) in equation (2) is defined as W/2 (where W is the full width of the CI). The upper and lower confidence bounds are determined by W/2. The degree of precision of the CI, which can be conceptualized as W or W/2, is the value of most interest within the AIPE framework. As will be shown, the value of W (or W/2) can be set a priori by the researcher in accordance with the desired precision of the estimated parameter. The full width for the CI (from equation 2) can be expressed as:
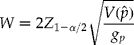
To estimate the necessary number of pools (sample size) for the proportion (p) for an expected width of ω, g p must be solved for in equation (3) (making W = ω), which yields the following formulation:
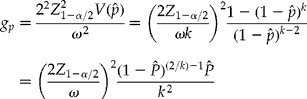
This sample size formula was derived by Worlund and Taylor (Reference Worlund and Taylor1983) and is currently used to estimate the required number of pools for estimating p with a perfect test and a fixed pool size (k), assuming V(p) is known. Note that if k = 1, equation (4) reduces to the standard formula for estimating p under simple random sampling
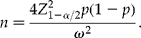
However, in equation (4) the value of V(p) is unknown and the sample variance ( ) is used. Equation (4) finds the required sample size for achieving a CI width (W) that is sufficiently narrow for estimating the proportion of AP using pools; however, it does not guarantee that for any particular CI the observed width (W) will be sufficiently narrow.
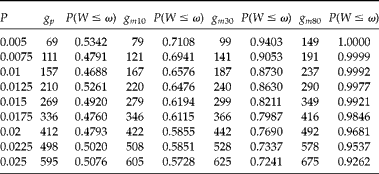
Since equation (4) uses an estimate of V(p), then the CI width (W) is a random variable that will fluctuate from sample to sample. This implies that roughly 50% of the sampling distribution of W will be smaller than ω (see the third column in Table 1). To demonstrate this, we need to calculate the probability of obtaining a CI width that is smaller than the specified value (ω). According to Montesinos-López et al. (Reference Montesinos-López, Montesinos-López, Crossa, Eskridge and Hernández-Suárez2010), this can be computed as:
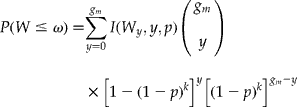
where I(W y, y, p) is an indicator function showing whether or not the actual CI width calculated using equation (2) is ≤ ω, g m is the number of pools, and W is considered a random variable because the exact value of p is not known.
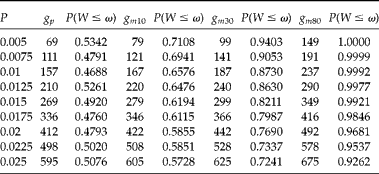
Initial sample size (g p, number of pools) for estimating the population proportion, computed with equation (4) and three sample size increments (g m10=g p+10, g m30=g p+30 and g m60=g p+80) with their corresponding probability that the confidence interval width (W) is smaller than the specified value (ω=0.005) (P(W≤ω) computed with equation 5). For a 95% CI and k=50, ω=0.005 is the desired CI width. P(W<ω) is the probability that (W) is smaller than the specified value (ω=0.005) calculated using equation (5)
Degree to which the sample size is underestimated using equation (4)
To show the degree to which the number of pools is underestimated by using equation (4), we give an example (Table 1) in which equation (5) is used to calculate P(W ≤ ω), that is, the probability that W will be smaller, or equal to the desired CI width (ω) for a given value g m = g p (number of pools) obtained using equation (4). The numerical example in Table 1 is given for several values of the population proportion (p) for a CI of 95%, k = 50 and for a desired width of ω = 0.005. Table 1 presents the initial sample size g p computed with equation (4), and three other increments computed as: g m10 = g p+10, g m30 = g p+30 and g m80 = g p+80. For each sample size, the probability that W is smaller than the specified value (ω = 0.005) (P(W ≤ ω)) is calculated using equation (5). This is done with the objective of showing that the required number of pools for the proportion (g p, second column in Table 1) computed using equation (4) has a probability of around 0.50 that W ≤ ω = 0.005 (third column in Table 1). For example, when p = 0.01, the initial sample size (g p) is 157 and the probability of obtaining a W ≤ ω = 0.005 is 0.4688. With p = 0.02, g p = 412, we can only be 47.93% certain that the W will be ≤ ω = 0.005. When the number of pools increases by 10 (g m10, fourth column, Table 1) or by 30 (g m30, sixth column, Table 1), the probability P(W ≤ ω = 0.005) increases. For example, when p = 0.01, there are g m30 = 187 units (pools) in the sample with P(W < 0.005) = 0.8730; for g m80 = 237 pools in the sample, the P(w < 0.005) = 0.9992. Thus, results in Table 1 show that in order to ensure P(W ≤ ω = 0.005) has a high probability, a bigger sample size (number of pools) than the initial g p calculated using equation (4), is required.
These results also show that the level of underestimation of the required number of pools (g p) caused by the use of equation (4) is important and mainly due to the fact that half of the time the sample variance  will be larger than the true variance V(p), and thus the obtained CI width (W) will be larger than the specified ω about half of the time. However, the expected value of the computed W is the value specified a priori (ω), provided the correct value of the population variance is used. Therefore, the use of equation (4) will ensure that the desired width ω for the CI will be obtained about 50% of the time, that is, (P(W ≤ ω) ≥ γ ≈ 0.5).
Since equation (4) underestimates the required number of pools, Montesinos-López et al. (Reference Montesinos-López, Montesinos-López, Crossa, Eskridge and Hernández-Suárez2010) proposed an optimal sample size procedure using group testing that considers the stochastic nature of the CI width. However, this method does not offer a closed form solution, and an R program is required for estimating the exact optimum sample size. In the following section, we briefly explain the computational method used to estimate the optimum sample size for an exact confidence interval.
Computing the optimum sample size for an exact confidence interval
According to Montesinos-López et al. (Reference Montesinos-López, Montesinos-López, Crossa, Eskridge and Hernández-Suárez2010), the optimal sample size is the smallest integer value (g m) such that
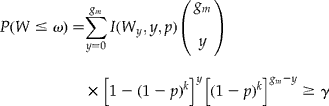
where I(W y, y, p) is an indicator function showing whether or not the actual CI width (W) calculated using equation (2) is ≤ ω. It is important to point out that Montesinos-López et al. (Reference Montesinos-López, Montesinos-López, Crossa, Eskridge and Hernández-Suárez2010) used the Clopper–Pearson confidence interval for determining the optimal sample size for group testing using equation (6).
In this procedure, we start with a minimal sample size, say g 0, increase the initial number of pools (g m) by one unit, and recalculate equation (6) each time, until the desired degree of certainty (γ) is achieved; this will produce a modified number of pools (g m) that assures with a probability of ≥ γ that the W will be no wider than ω. In other words, g m ensures that the researcher will have approximately 100γ percent certainty that the computed CI will have the desired width or smaller. For example, if the researcher requires 90% confidence that the obtained W will be no larger than the desired width (ω), (1 − γ) would be defined as 0.10, and there would be only a 10% chance that the CI width, around p, would be larger than specified (ω) (Kelley and Maxwell, Reference Kelley and Maxwell2003; Kelley, Reference Kelley2007).
Contrary to equation (4) above, the exact sample size proposed by Montesinos-López et al. (Reference Montesinos-López, Montesinos-López, Crossa, Eskridge and Hernández-Suárez2010) (equation 6) considers  as a random variable and gives a non-closed form solution for computing a minimum sample size (g m) that guarantees that W is smaller than, or equal to, ω with a probability of at least γ. In the following section, we propose a closed form analytical method for determining the optimal sample size (number of pools required) that uses a single formula which assures the estimation of a narrow confidence interval.
The proposed analytical optimum sample size for an exact confidence interval
The CI width for p is  and W must be smaller than a specified value (ω) with probability (γ). Therefore, the optimal sample size is defined to be the smallest integer value (g m) such that
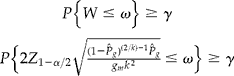
Since the distribution of

is unknown, it is not possible to obtain an analytical solution for g m. An alternative is to use the delta method to derive the asymptotic distribution of 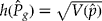 . It is known that
 and

Then, since  if g m → ∞,
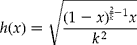
is differentiable with respect to x ∈ (0,1) and
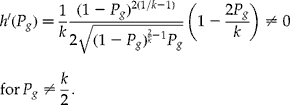
Then, using the delta method,  , that is,

where
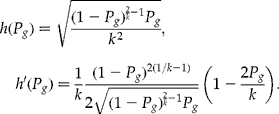
Therefore, equation (7) can be written as:
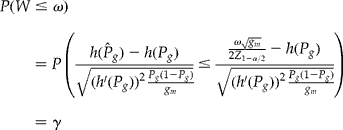
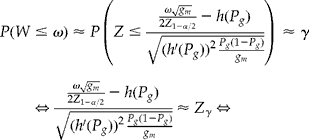

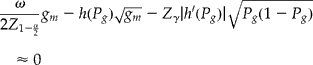
Note that equation (8) has a quadratic form: ax 2+bx+c = 0, with
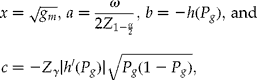
with two solutions given by  . Taking
 for fixed ω, the number of required pools is

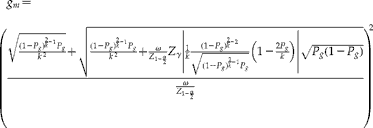
where γ represents the desired degree of certainty (required probability) of achieving a CI width (W) for p that is no wider than the desired value (ω). Z γ is the γ quantile of the standard normal distribution. P g = 1 − (1 − p)k is the probability of a positive pool. Note that if γ = 0.5, Z γ = 0 (because the 50% quantile of a standard normal distribution is required), and equation (9) reduces to equation (4), that is, the formula determines the required number of pools assuming that the variance proportion  is known and fixed; this means that the required width W will be achieved only 50% of the time. On the other hand, if k = 1, equation (9) reduces to
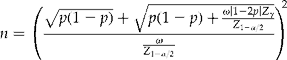
which is appropriate for determining the sample size without grouping (without making pools) (individual binomial because k = 1) and guarantees that W will be smaller than, or equal to, ω with a probability γ. In other words, only (1 − γ) of the time will W be larger than the desired CI width, ω.
Also note that equation (10) (individual binomial) reduces to the standard formula for estimating the sample size under simple random sampling,  if γ = 0.5; here the stochastic nature of the CI width is not considered. It is important to point out that the procedure proposed by Montesinos–López et al. (Reference Montesinos-López, Montesinos-López, Crossa, Eskridge and Hernández-Suárez2010) (equation 6) and the proposed formula (equation 9) determine a minimum sample size (g m) that guarantees that W will be smaller than, or equal to, ω with a probability of at least γ. In contrast to equation (4), equations (6), (9) and (10) account for the stochastic nature of the random variable
 via the desired degree of certainty (γ). It should be pointed out that we called g p the sample size obtained from equation (4) or from equation (9) using γ = 0.5, and g m is the sample size obtained with equation (9) and γ>0.5. For this reason, the values of the level of assurance would be γ ≥ 0.5.
Results
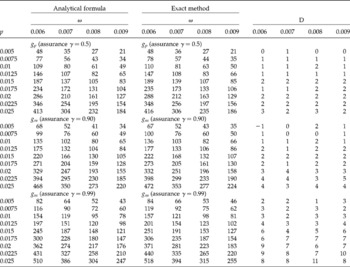
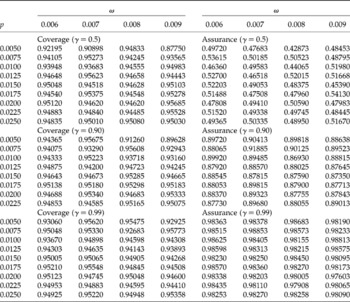
Sample sizes are shown for k values of 50 (Table 2), and p values ranging from 0.005 to 0.025, and ω values from 0.006 to 0.009 by 0.001. Within this table, we delineated three sub-tables with the modified number of pools (g m) and γ values of 0.50, 0.90 and 0.99, each for a CI coverage of 95%. Each condition is crossed with all other conditions in a factorial manner; thus there are a total of 108 different cases for planning an appropriate sample size. For the results of Table 2, a simulation study was performed to examine the coverage and assurances of the samples as compared with the nominal coverage and assurances (Table 3).
Sample size (number of pools) obtained based on the proposed analytical formula and the exact method of Montesinos-López et al. (Reference Montesinos-López, Montesinos-López, Crossa, Eskridge and Hernández-Suárez2010) for a CI of 95%, k=50, four desired widths (ω=0.006, 0.007, 0.008, 0.009) and three values of γ (0.5, 0.9 and 0.99). The value of p is the population proportion, g p is the initial number of pools, g m is the modified number of pools, γ is the assurance for the desired degree of certainty of achieving a CI for p that is no wider than the desired CI width (ω). The difference (D) in the number of pools is the sample size under the exact method minus the sample size under the proposed analytical method

Simulation study of the coverage and assurance for the sample sizes obtained with the analytical formula presented in the Table 2, for a CI of 95%, k=50, four desired widths (ω=0.006, 0.007, 0.008, 0.009) and three values of assurance γ (=0.5, 0.90 and 0.99)

Comparing the proposed analytical formula with the exact computational procedure of Montesinos-López et al. (Reference Montesinos-López, Montesinos-López, Crossa, Eskridge and Hernández-Suárez2010) using group size k=50
Table 2 gives the required number of pools obtained from the proposed analytical method and the exact computational method of Montesinos-López et al. (Reference Montesinos-López, Montesinos-López, Crossa, Eskridge and Hernández-Suárez2010), for group size k = 50. Equation (9) gives almost exactly the same results as those obtained by the exact method when calculations are done considering γ = 0.5 or γ = 0.90, in which case the differences in the number of pools between the two methods are 1, 2, 3 or 4 pools. However, when γ = 0.99 and p>0.01, the optimal sample size obtained by the analytical formula may give from 3 up to 11 fewer pools than those calculated using the exact method of Montesinos-López et al. (Reference Montesinos-López, Montesinos-López, Crossa, Eskridge and Hernández-Suárez2010). This indicates that when γ = 0.99 and p>1%, the difference between the two approaches increases and the analytical formula underestimates the optimal number of pools.
Suppose a researcher is interested in estimating p for AP maize in the region of Oaxaca, Mexico, where Quist and Chapela (Reference Quist and Chapela2001) reported finding AP maize. With this information and after doing a literature review it is considered that p = 0.025, with a CI of 95%, and k = 50, and it is assumed that the final desired width W y = (p U − p L) ≤ ω = 0.008. The application of the analytical method leads to a required number of preliminary pools of g p = 232, each of size k = 50. This sample size is contained in the first sub-table of Table 2 (g p with γ = 0.5, where k = 50, p = 0.025 and ω = 0.008).
Realizing that g p = 232 will lead to a sufficiently narrow CI only about 50% of the time; the researcher incorporates an assurance of γ = 0.90, which implies that the width of the 95% CI will be larger than the required width (i.e. 0.008) no more than 10% of the time. From the second sub-table of Table 2 (g m with γ = 0.90), it can be seen that the modified sample size procedure yields a necessary number of pools g m = 273. Using a sample size of 273 will provide 90% assurance that the obtained CI for p will be no wider than 0.008 units. This sample size is contained in the second sub-table of Table 2 (g m with γ = 0.90, where k = 50, p = 0.025 and ω = 0.008).
Calculating the analytical optimal sample size – an example
Suppose that a researcher interested in estimating p for AP does not have access to Table 2 and does not have the R package. She/he hypothesizes that p = 0.01, wants a CI of 95%, uses a pool size of k = 25, and assumes that the final CI width is  with an assurance level of 99% (γ = 0.99). First, it is necessary to calculate
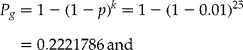
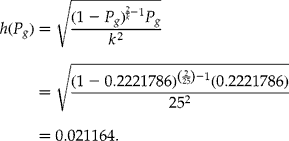
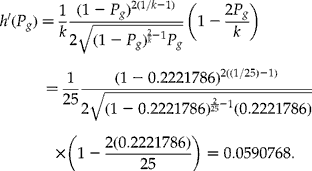
A CI of 95% is required, so that Z 1 − 0.05/2 = 1.96. It is assumed that γ = 0.99 so Z 0.99 = 2.33, ω = 0.007, k = 25. Therefore,


With equation (9), the optimum number of pools is calculated with a 99% probability that the CI width will be smaller than 0.007, the desired error. Note that for calculating g m = 200, the double precision format was used; otherwise, a slight overestimation would occur. It should be pointed out that if γ = 0.5, the value of Z γ = 0 and the required number of pools reduces to equation (4), that is, 140 pools.
The Appendix provides information for implementing the proposed method and for obtaining sufficiently narrow CIs for any combination of k, p, ω, γ and α using the R package (R Development Core Team, 2007). The R package computes the sample size using the proposed formula, equation (9), and the sample size obtained with the interactive method proposed by Montesinos-López et al. (Reference Montesinos-López, Montesinos-López, Crossa, Eskridge and Hernández-Suárez2010).
Simulation study for examining the coverage and assurance levels
The sample sizes obtained analytically as well as using the exact method guarantee that the (1 − α)100% CIs are narrower than the desired width (ω) with a certain probability of assurance (γ). Using the Monte Carlo method it is possible to examine whether the analytically computed sample sizes achieve (1) the coverage probabilities of the nominal (1 − α)100% CI used to calculate the CIs; and (2) the expected assurance probabilities.
To examine the coverage and the assurance for each sample size (g p and g m) obtained for the analytic formula in Table 2, we decided to take 40,000 random samples of g p pools each of size k = 50, and from all of them we obtained the proportion of CI that contains the true value of p, and the proportion of CI that has a CI width narrower than the desired CI width (ω). The results shown in Table 3 indicate that the coverage of the sample is very similar to the nominal value. However, several studies have shown that the coverage of small sample sizes using the Wald CI is poor (Hepworth, Reference Hepworth1996, Reference Hepworth2005; Brown et al., Reference Brown, Cai and DasGupta2001, Reference Brown, Cai and DasGupta2002). In this example, some samples did not achieve the nominal value (i.e. 0.87), but other samples did achieve the nominal value of 0.95.
The results also show that as the level of assurance increased, the coverage had slight increases and achieved the nominal value of 0.95. In general, since the sample sizes are relatively large, the coverages are close to the nominal values. Concerning the assurance, if γ = 0.5, the levels of assurance are smaller than 0.5 (values ranging from 0.42 873 to 0.5413); this is consistent with the results in Table 1, which indicate that sample sizes with no assurance (γ = 0.5) guarantee the desired CI width only 50% of the time. However, when the level of assurance is 90 or 99%, the achieved levels of assurance are only slightly smaller than the nominal values. Therefore, the general behaviour of the CI improves as the level of assurance increases, indicating that is important to use levels of assurance of at least 90%.
Discussion and conclusion
In this paper, we presented a formula for determining the optimal sample size for estimating the proportion of transgenic plants in a population, taking into account the stochastic nature of the confidence interval width. This formula assures a probability γ that the desired CI width (ω) will be achieved. Within a certain range of k, p and γ, the results from the formula were very precise and were compared with the computational method proposed by Montesinos-López et al. (Reference Montesinos-López, Montesinos-López, Crossa, Eskridge and Hernández-Suárez2010). However, the proposed formula underestimated the optimum number of pools, mainly for γ ≥ 0.99, for k>75 at p>0.01. We thus recommend using this formula for pool sizes that are smaller than, or equal to, 50 and for small p values (p < 0.1). This formula can also be used with pool sizes greater than 50 but assuming values p < 0.01, which is consistent with the recommendations given when using group testing (Thompson, Reference Thompson1962; Swallow, Reference Swallow1985).
Under the assumption that AP concentration is low, the restriction of having p < 0.1 does not pose serious difficulty for using the formula proposed here, when pool sizes are smaller than, or equal to, 50 and with a level of assurance of at least 90%; this has been confirmed by the Monte Carlo study for coverage and assurance. Pool size can be an important consideration, since from an economic perspective, it is always better to have a large pool size and a smaller number of pools than vice versa. However, a pool size of 50 may be a good number to combine with a manageable number of pools in order to achieve a safe total sample size. Another safe measurement a researcher may consider is to increase by 5–8 pools the number of pools given by the formula of the analytical method. This will ensure that the necessary numbers of pools are used when p < 0.1 and k = 50.
The proposed analytical formula developed in this study has the advantage over the exact computational method of Montesinos-López et al. (Reference Montesinos-López, Montesinos-López, Crossa, Eskridge and Hernández-Suárez2010) that no R programs are necessary for obtaining an appropriate sample size. Furthermore, the proposed analytical formula is superior to the standard method given by equation (4), which produces smaller sample sizes that yield unacceptably low probabilities (typically less than 0.5) of attaining the desired inference-making goals. An additional advantage of the proposed analytical formula for estimating the required number of pools is that it is not related to the issue of rejecting null hypotheses and focuses only on the precision of estimating p using group testing.
The R program (see the Appendix) developed using the R package (R Development Core Team, 2007) allows the user to quickly and simply plan the sample size according to her/his requirements or needs using the analytic formula (equation 9) or the computational method of Montesinos-López et al. (Reference Montesinos-López, Montesinos-López, Crossa, Eskridge and Hernández-Suárez2010). However, if the researcher does not have access to the R program, the best practical solution is to use equation (9). Finally, it is important to point out that the methods presented assume perfect sensitivity and specificity, which must be taken into account when designing a study.
Appendix
Using SAMGT to implement the analytical formula and the exact method of Montesinos-López et al. (Reference Montesinos-López, Montesinos-López, Crossa, Eskridge and Hernández-Suárez2010)
To calculate the appropriate sample size, we have developed the R package SAMGT, available at the CIMMYT web site (http://apps.cimmyt.org/english/wps/biometrics/index.htm), Biometrics and Statistics Unit, and then in Manuals and Programs. The two methods for computing sample sizes (analytical and computational) that are presented and discussed in this article can be implemented using this R package (R Development Core Team, 2007). This appendix provides a brief overview of the SAMGT functions that can be used to calculate the required sample size. Because SAMGT is an optional package, it must be loaded during each new R session. Packages in R are loaded with the library( ) command, which is illustrated with SAMGT as follows:

To calculate the required sample size with the SAMGT package, the function gsample( ) should be used. For example,
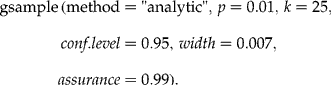
In ‘method’ there is the need to specify which method is required to calculate the sample size, that is, method = “analytic” computes the sample size using the proposed formula, equation (9), and method = “computational” calculates the sample size with the interactive method proposed by Montesinos-López et al. (Reference Montesinos-López, Montesinos-López, Crossa, Eskridge and Hernández-Suárez2010) using equation (6). The value p is the population prevalence, k is the required pool size, conf.level is the confidence level (i.e. 1 − α), width is the desired CI width, and assurance is the desired degree of certainty (γ) that can be used in the function by specifying the certainty. Implementation of the function above yields the necessary sample size, which provides 99% assurance that the obtained CI width for p will be no wider than 0.007 units. The value of assurance should be at least 0.5 (50%).