



1. Introduction
The classic experiment by Mowbray & Rarity (Reference Mowbray and Rarity1967) of oscillating a cylinder in a stratified fluid was the first demonstration of the remarkable X-shaped pattern of internal gravity waves that is now known as ‘St. Andrew's Cross’. Interestingly, the four arms of the cross are in the form of time-harmonic plane waves with locally confined spatial profile, determined by the oscillating cylinder, and stretch along specific directions relative to gravity set by the dispersion relation. Such beam-like disturbances are fundamental propagation modes that derive from the inherent anisotropy of internal wave motion, whereby energy is transported along rather than perpendicularly to surfaces of constant phase (e.g. Lighthill Reference Lighthill1978, § 4.4). Since the original observations of Mowbray & Rarity (Reference Mowbray and Rarity1967), there have been numerous experimental and theoretical investigations of internal wave beams in connection with forced internal waves by oscillating bodies and related configurations (see e.g. Kataoka et al. Reference Kataoka, Ghaemsaidi, Holzenberger, Peacock and Akylas2017, and references therein). Furthermore, internal wave beams arise in oceans due to the interaction of the barotropic tide with bottom topography (e.g. Lamb Reference Lamb2004; Peacock, Echeverri & Balmforth Reference Peacock, Echeverri and Balmforth2008; Johnston et al. Reference Johnston, Rudnick, Carter, Todd and Cole2011) and in the atmosphere due to thunderstorms (e.g. Fovell, Durran & Holton Reference Fovell, Durran and Holton1992).
In an effort to shed light on the dissipation process of oceanic internal waves, a body of recent work has focused on possible instability mechanisms of internal wave beams (see e.g. Dauxois et al. Reference Dauxois, Joubaud, Odier and Venaille2018, and references therein). Theoretically, the stability of wave beams can be viewed as an extension of the simpler, but less realistic problem, of the stability of plane waves with sinusoidal profile. The latter problem has been studied systematically using Floquet theory, and a wide range of instabilities have been found for finite-amplitude sinusoidal waves (e.g. Mied Reference Mied1976; Klostermeyer Reference Klostermeyer1991; Sonmor & Klaassen Reference Sonmor and Klaassen1997). In the small-amplitude limit, these instabilities can be understood in terms of resonant triad interactions of the primary wave with two subharmonic perturbations (e.g. Staquet & Sommeria Reference Staquet and Sommeria2002). A particular case of such triadic resonant instability (TRI) is the widely studied parametric subharmonic instability (PSI), which involves subharmonic perturbations with half the frequency of the primary wave and very fine wavelength. In view of the possibility of transferring energy into much smaller scales, PSI has been suggested as a potentially significant factor in the dissipation of oceanic internal waves (e.g. Hibiya, Nagasawa & Niwa Reference Hibiya, Nagasawa and Niwa2002; MacKinnon & Winters Reference MacKinnon and Winters2005; Young, Tsang & Balmforth Reference Young, Tsang and Balmforth2008).
It is now recognized, however, that the finite width of an internal wave beam reduces the efficiency of PSI: subharmonic perturbations travel across the beam with their group velocity and thus have only limited time to extract energy from the primary wave. On these grounds, Karimi & Akylas (Reference Karimi and Akylas2014) argued that, in the small-amplitude nearly inviscid limit, only beams with nearly monochromatic profile are susceptible to PSI. This possibility of PSI, which requires that the beam profile comprise a large enough number of carrier wavelengths, is further limited by background mean flows (Fan & Akylas Reference Fan and Akylas2019). An exception arises in the presence of background rotation for beams with frequency close to twice the inertial frequency. In this instance, which is of geophysical relevance, owing to the Earth's rotation, beams with general locally confined profile can suffer PSI because subharmonic perturbations of near-inertial frequency have group velocity close to zero (Karimi & Akylas Reference Karimi and Akylas2017).
On the experimental side, Bourget et al. (Reference Bourget, Dauxois, Joubaud and Odier2013) examined the stability of wave beams of finite width comprising approximately three wavelengths of a well-defined carrier, which were generated in a stratified fluid tank by a stacked-plate wavemaker (Mercier et al. Reference Mercier, Martinand, Mathur, Gostiaux, Peacock and Dauxois2010) specially designed for this purpose. Owing to the increased importance of viscosity under laboratory flow conditions, rather than PSI, which involves perturbations of very fine spatial scale, Bourget et al. (Reference Bourget, Dauxois, Joubaud and Odier2013) observed a form of TRI: the two unstable subharmonic perturbations formed a resonant triad with the beam carrier but the three waves had comparable wavelengths. Furthermore, in a follow-up study using a similar set-up, Bourget et al. (Reference Bourget, Scolan, Dauxois, Le Bars, Odier and Joubaud2014) confirmed that the finite beam width weakens this triad resonance instability, consistent with Karimi & Akylas (Reference Karimi and Akylas2014). In an earlier experiment, however, using a similar wave generator, but in a relatively wide tank where the generated nearly monochromatic beams featured significant transverse variations, Bordes et al. (Reference Bordes, Venaille, Joubaud, Odier and Dauxois2012) found no evidence of TRI. Instead, they observed a growing horizontal mean flow of the streaming type which also impacts the beam itself via refraction. This induced mean flow is of viscous origin and hinges on the combined effects of transverse variations and nonlinearity (Kataoka & Akylas Reference Kataoka and Akylas2015; Fan, Kataoka & Akylas Reference Fan, Kataoka and Akylas2018; Jamin et al. Reference Jamin, Kataoka, Dauxois and Akylas2020). However, as noted by Dauxois et al. (Reference Dauxois, Joubaud, Odier and Venaille2018), it is unclear whether streaming and TRI can coexist, and the conditions that would favour one over the other remain largely unexplored.
In contrast to nearly monochromatic beams, there have been only a few reports of instability in the original St. Andrew's Cross, which features internal wave beams whose typical width is only one or two wavelengths. Importantly, such ‘thin’ beams with a broadband spectrum of spatial wavenumbers are not only readily generated in the laboratory by oscillating bodies, but also typify beams that arise in oceans and the atmosphere (e.g. Fovell et al. Reference Fovell, Durran and Holton1992; Lamb Reference Lamb2004; Johnston et al. Reference Johnston, Rudnick, Carter, Todd and Cole2011). Most prior laboratory experiments that used an oscillating cylinder as forcing, in particular, were concerned with small-amplitude beams. Specifically, the typical ratio of oscillation amplitude (half peak-to-peak) to cylinder radius was less than 0.2, and the generated beams agreed well with linear theory (e.g. see Sutherland & Linden Reference Sutherland and Linden2002). Thus, considering the theoretical findings of Karimi & Akylas (Reference Karimi and Akylas2014) for small-amplitude thin beams, it is not surprising that no instabilities have been observed under these laboratory flow conditions. At a larger amplitude-to-radius ratio of 0.66, Clark & Sutherland (Reference Clark and Sutherland2010) report an instability that resembles PSI, but experimental limitations of their synthetic schlieren technique precluded detailed quantitative measurements regarding this instability. Finally, Ermanyuk & Gavrilov (Reference Ermanyuk and Gavrilov2008) used amplitude-to-radius ratios of up to 1.2. However, they did not observe instability probably because of the large viscous effects introduced by their small cylinder radius of 1 cm. The only significant nonlinear effect noted in this study was the radiation of a second-harmonic beam when the cylinder driving frequency is less than half the buoyancy frequency.
Apart from the St. Andrew's Cross, thin internal wave beams arise also in the so-called ‘internal wave attractor’ (e.g. Hazewinkel et al. Reference Hazewinkel, Van Breevoort, Dalziel and Maas2008; Scolan, Ermanyuk & Dauxois Reference Scolan, Ermanyuk and Dauxois2013; Brouzet et al. Reference Brouzet, Sibgatullin, Scolan, Ermanyuk and Dauxois2016), which forms by the focusing of wave energy via wall reflections. In this setting, there have been observations of an instability of thin beams that appears to resemble TRI (i.e. satisfy the triad resonance conditions in an approximate sense). However, it remains unclear whether the observed instability can be predicted using TRI theory, which was originally developed for small-amplitude sinusoidal waves, and whether this instability persists outside of the strict geometric constraints of the attractor set-up.
The present joint experimental and theoretical investigation aims to improve the current understanding of instability mechanisms of isolated thin internal wave beams, akin to those originally observed by Mowbray & Rarity (Reference Mowbray and Rarity1967). Specifically, we experimentally study internal wave beams due to a horizontal cylinder that is oscillated harmonically in the direction of propagation of the generated beam. This forcing arrangement permits the generation of coherent, finite-amplitude wave beams, which are then measured using particle image velocimetry (PIV). We present novel observations of instability above a threshold forcing amplitude-to-radius ratio depending on the driving frequency, which are compared against the predictions of a formal linear stability analysis based on Floquet theory. Although it bears resemblance to TRI, the observed instability cannot be predicted by TRI theory since thin wave beams have no well-defined carrier wavevector. This is in contrast to the predictions of the Floquet stability analysis, which agree well with the experimental observations. Finally, we present experimental evidence that transverse beam variations induce a horizontal mean flow of the streaming type and significantly weaken the observed instability.
2. Experimental set-up
Laboratory experiments were performed in a glass wave tank 5.46 m long and 0.51 m wide, filled to a depth of 0.54 m with salt water. Using the double-bucket method, a linear density stratification was set up with buoyancy frequency  $N=0.94\ \textrm {s}^{-1}$. The final stratification was measured using a Precision Measurements Engineering conductivity/temperature probe. Waves were generated by oscillating a 0.5 m long horizontal cylinder (see schematic in figure 1) whose length spanned the transverse width of the tank with approximately 5 mm clearance between the ends of the cylinder and the tank walls on each side. Two thin metal rods attached to opposing ends of the cylinder were connected to a National Instruments/Axis New England-based motion control system, which used a lead screw traverse to drive the cylinder oscillations. Cylinders were 3-D printed using ABS plastic, allowing for precise control of the cylinder diameter along its length. We used two types of cylinders: (i) a uniform cylinder with radius 22.2 mm (figure 1b); and (ii) a non-uniform cylinder comprised of three cylindrical sections of equal length whose radii were 15.6 mm, 22.2 mm and 15.2 mm (figure 1c). We shall use
 $L = 22.2\ \textrm {mm}$, the common radius in the centre section of the two types of cylinders, as the characteristic length scale for all experiments.
Schematics of the experimental set-up. (a) Side and transverse view of the wave tank and horizontal cylinder. The cylinder is harmonically oscillated at frequency  $\omega _{0}$ and angle
 $\theta$ relative to the horizontal such that
 $\omega _{0}^{2} = N^{2}\sin ^{2}\theta$. The laser sheet is in the
 $xy$-plane at
 $z=4.3\ \textrm {cm}$. (b) Sketch of the uniform cylinder and (c) non-uniform cylinder used for the experiments. Dimensions are given in § 2. (d) Sketch of the generated wave beams (in grey), which reflect off the free surface and tank bottom. The dotted-line box shows the PIV window, with the primary beam of interest propagating from the upper right to the bottom left. The beam-oriented coordinate system
 $(\xi ,\eta ,\zeta )$ is defined by the along-beam, cross-beam and transverse horizontal coordinates, respectively.

Cylinders were harmonically oscillated at angle  $\theta$ to the horizontal with frequency
 $\omega _{0}$ and half peak-to-peak amplitude
 $A$ (figure 1a). For each experiment,
 $\theta$ was chosen to match the angle of inclination to the horizontal of the generated wave beams (see figure 1d), set by the linear dispersion relation
 \begin{gather} \omega_{0}^{2} = N^{2}\sin^{2}\theta. \end{gather}
This arrangement allows for complete forcing of the fluid velocity in two of the four generated beams, since the motion of the cylinder is then exactly parallel to the direction of fluid motion. Our interest centres on one of these two preferentially excited beams (see figure 1d), which reach higher amplitude as compared with the four symmetric beams that would be generated by vertical ( $\theta =90{{}^{\circ }}$) cylinder oscillations at the same forcing amplitude
 $A$. We note that an analogous result was found by Mercier et al. (Reference Mercier, Martinand, Mathur, Gostiaux, Peacock and Dauxois2010) in their analysis of the forcing efficiency of a wavemaker comprised of stacked plates. In our experiments,
 $\theta \in \{35{{}^{\circ }}, 40{{}^{\circ }}, 45{{}^{\circ }}, 50{{}^{\circ }}, 55{{}^{\circ }}\}$ and
 $0.36\leq A/L\leq 1.26$. For all these forcing conditions, the wave beam amplitudes were below the threshold for overturning (see § 5.2). Finally, the size of our wave tank was large enough to ensure that reflections of the other three beams from the tank walls and free surface do not interfere with the primary beam of study.
Flow visualization was performed using a LaVision PIV system. A pulsed Nd:YAG laser located beneath the wave tank was used to generate a vertical laser sheet in the  $xy$-plane located at
 $z=4.3\ \textrm {cm}$ (unless otherwise noted), where
 $z=0$ specifies the midline of the tank (see figure 1a). The density stratification was seeded with Sphericel hollow glass oxide particles of diameter
 $8\text {--}12\ \mathrm {\mu }\textrm {m}$ and densities ranging from 1000 to
 $1050\ \textrm {kg}\,\textrm {m}^{-3}$. Images were captured using an Imager Pro X CCD camera at a resolution of
 $2048 \times 2048$ pixels from the start of forcing to 8–20 min later. The camera frame rate was 8 Hz, which corresponds to a minimum of 64 images per forcing period for the range of forcing frequencies used. Images were processed using LaVision DaVis software to obtain two-dimensional velocity fields in the plane of the laser sheet.
3. Stable versus unstable beams: experimental observations
Figure 2 compares the horizontal ( $x$) velocity field of the internal wave beam generated using the uniform cylinder for
 $\theta =45{{}^{\circ }}$ at two forcing amplitudes,
 $A/L=0.45$ and 0.63. For both amplitudes, at
 $t=8T_{0}$ after start of forcing (figure 2a,b), where
 $T_{0}=2{\rm \pi} /\omega _{0}$ is the oscillation period, the wave beam has propagated across the observation window from the upper right to the lower left (phase travelling from lower right to upper left) and has reached a quasi-steady state. At the later time
 $t=36T_{0}$, the lower-amplitude beam (at
 $A/L=0.45$) remains uniform in the along-beam direction aside from the effects of viscous dissipation, which cause slight broadening and decay of the wave profile far from the cylinder (figure 2d), and this steady state persisted even for larger times, e.g.
 $t=120T_{0}$, with no noticeable instability. In contrast, at the larger forcing amplitude
 $A/L=0.63$ after
 $36T_{0}$ of forcing, an instability is visibly apparent (figure 2e), causing breakdown of the primary wave beam. These observations are also consistent with a time series of the horizontal velocity at a position along the beam centreline roughly 20 cm away from the cylinder: the lower-amplitude forcing produces a steady time-harmonic signal (figure 2f), while the higher-amplitude forcing eventually results in a modulated, multifrequency signal due to instability (figure 2g).
(a) Horizontal ( $x$) velocity for beam inclination angle
 $\theta =45{{}^{\circ }}$ and forcing amplitude
 $A/L= 0.45$ at
 $t=8T_{0}$ after start of forcing. The grey box corresponds to the region around the cylinder that is masked out. (b) Same as panel (a) but for
 $A/L = 0.63$. (c) Theoretical beam profile used in the linear stability analysis of § 5 to approximate the experimental beam in panel (b). (d) Same as panel (a) but at
 $t=36T_{0}$ after start of forcing. (e) Same as panel (d) but for
 $A/L = 0.63$. (f) Time series of the horizontal velocity for
 $A/L= 0.45$ at the location marked with the cross in panels (a,d). The vertical lines indicate the times
 $t=8T_{0}$ and
 $36T_{0}$. (g) Same as panel (f) but for
 $A/L= 0.63$ and at the location marked with the cross in panels (b,e).

Figure 3(a) compares the spatially averaged frequency spectra of the stable and unstable beams, obtained by calculating the time-frequency spectrum at each spatial point and averaging over the region of the primary wave beam. Both spectra feature a dominant peak at the primary wave frequency  $\omega _{0}/N$, as well as smaller peaks corresponding to the second and third harmonic. As
 $2\omega _{0}>N$ for all experiments reported in this study, these higher harmonics exist only within the primary beam and do not propagate. Given that a uniform inviscid beam involves a single harmonic (Tabaei & Akylas Reference Tabaei and Akylas2003, see also (4.2) below), the observed higher harmonics arise from nonlinear self-interactions of the primary wave brought about by along-beam variations in the beam profile due to the effects of viscosity. In contrast to the lower-amplitude, stable beam (at
 $A/L=0.45$), however, the frequency spectrum of the higher-amplitude, unstable beam (at
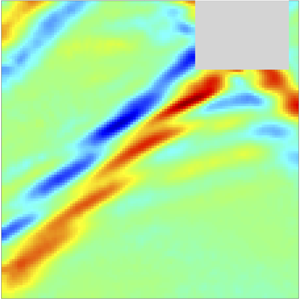
 $A/L=0.63$) features several additional peaks, corresponding to multiple daughter waves spontaneously generated via instability. According to figure 3(a), the strongest of these peaks occur at the subharmonic frequencies
 $\omega _{1}/N=0.26$ and
 $\omega _{2}/N=0.45$. The corresponding spatial disturbances, obtained by filtering the experimental wave field about the selected frequency with a window of
 ${\pm }0.05\ \textrm {rad}\,\textrm {s}^{-1}$, are plotted in figure 3(b,c). Both subharmonic waves have wavepacket-like spatial structure with smaller carrier wavelength than the width of the primary beam (carrier wavelengths measured to be approximately 44 mm for
 $\omega _{1}/N=0.26$ in figure 3b and 29 mm for
 $\omega _{2}/N=0.45$ in figure 3c), and they propagate in opposite directions with respect to the primary beam. Furthermore, upon estimating the inclination angle to the horizontal of their wave crests (
 $\theta _{1}\approx 15{{}^{\circ }}$ for
 $\omega _{1}/N=0.26$ and
 $\theta _{2}\approx 27{{}^{\circ }}$ for
 $\omega _{2}/N=0.45$), it is concluded that the subharmonic waves approximately satisfy the internal wave dispersion relation,
 $\omega ^{2}=N^{2}\sin ^{2}\theta$.
(a) Spatially averaged time frequency spectra for the experiments shown in figure 2. The dotted line corresponds to the stable case at  $A/L= 0.45$ (figure 2a,d) while the solid line corresponds to the unstable case at
 $A/L = 0.63$ (figure 2b,e). The subharmonic frequencies
 $\omega _{1}/N=0.26$ and
 $\omega _{2}/N=0.45$ are labelled. (b) Experimentally measured horizontal velocity field from figure 2(e), filtered at
 $\omega _{1}/N=0.26$. (c) Same as panel (b) but filtered at
 $\omega _{2}/N=0.45$. (d) Time frequency spectrum of the fastest-growing Floquet mode. The vertical dotted line marks the primary wave frequency at
 $\omega _{0}/N$. (e) Theoretically predicted spatial mode shape corresponding to the first peak (from the left) in the frequency spectrum in panel (d) at
 $\omega /N=0.24$. (f) Same as panel (e) but for the second peak at
 $\omega /N=0.47$. Dashed arrows in panels (b,c,e,f) indicate direction of phase propagation. Solid arrows in panel (b,c) indicate direction of group velocity
 $\boldsymbol {c}_{g}$. Velocity scale in panels (e,f) is normalized to have the same maximum velocity as in panels (b,c).

It is worth noting that the observed subharmonic instability disturbances along with the primary beam appear to satisfy, to a rough approximation, the conditions for TRI. Specifically, according to the classical theory of TRI (e.g. Bourget et al. Reference Bourget, Dauxois, Joubaud and Odier2013), a sinusoidal primary wave of infinitesimal amplitude with frequency  $\omega _{0}$ and wavevector
 $\boldsymbol {k}_{0}$ can be unstable to subharmonic perturbations, also in the form of sinusoidal waves, with frequencies
 $(\omega _{1},\omega _{2})$ and wavevectors
 $(\boldsymbol {k}_{1},\boldsymbol {k}_{2})$, if the three waves form a resonant triad,
 \begin{gather} \omega_{1} + \omega_{2} = \omega_{0}, \end{gather}
 \begin{gather} \boldsymbol{k}_{1}+\boldsymbol{k}_{2} = \boldsymbol{k}_{0}. \end{gather}
Here, the observed subharmonic frequencies  $\omega _{1}/N=0.26$ and
 $\omega _{2}/N=0.45$ of the instability, along with the primary wave frequency
 $\omega _{0}/N=0.71$, clearly satisfy to a good approximation the frequency resonance condition (3.1a). In regard to the spatial resonance condition (3.1b), the carrier wavevectors of the observed subharmonic disturbances, calculated using the carrier wavelength and inclination angle estimated above, are given in the coordinate system
 $(\xi , \eta )$ by
 $\boldsymbol {k}_{1} = (71, -124)\ \textrm {m}^{-1}$ for
 $\omega _{1}/N=0.26$ and
 $\boldsymbol {k}_{2}=(-67,206)\ \textrm {m}^{-1}$ for
 $\omega _{2}/N=0.45$. Then, taking the primary beam width of roughly
 $80\ \textrm {mm}$ to correspond to a single wavelength, we find that
 $\boldsymbol {k}_{0}=(0,79)\ \textrm {m}^{-1}$, which is approximately equal to
 $\boldsymbol {k}_{1}+\boldsymbol {k}_{2} = (4,82)\ \textrm {m}^{-1}$.
However, in spite of this apparent resonant triad, the theory for TRI, strictly, is not applicable in the present setting: the primary wave is not sinusoidal, but rather a thin beam with a broadband spectrum of wavenumbers and no defined carrier wavevector  $\boldsymbol {k}_{0}$, so the meaning of (3.1b) is not clear. As noted in § 1, the finite width of the beam dramatically affects the instability dynamics and adds new physics, namely the group velocity of the perturbations, which is ignored in the classical TRI theory (Karimi & Akylas Reference Karimi and Akylas2014). Furthermore, the stability predictions of TRI theory cannot be trusted: treating our thin beam as one wavelength of a primary sinusoidal wave with
 $\omega _{0}/N=0.71$ and
 $\boldsymbol {k}_{0}=(0,79)\ \textrm {m}^{-1}$, the most unstable triad according to TRI theory involves a subharmonic perturbation with wavelength greater than the primary beam width, contradicting our findings (figure 3b,c). Thus, to make quantitative comparisons with experimental observations, we turn to a formal stability analysis based on Floquet theory that takes into account both the finite width and finite amplitude of the primary wave beam.
4. Stability analysis
The analysis assumes an unbounded, incompressible, uniformly stratified Boussinesq fluid with constant buoyancy frequency  $N$. While in the rest of the paper we use dimensional variables, here we find it more convenient to work with non-dimensional variables for ease of notation. Using
 $1/N$ as the time scale and the cylinder radius
 $L$ (see § 2) as the length scale, the dimensionless governing equations for the velocity field
 $\boldsymbol {u}$, the reduced density
 $\rho$ and pressure
 $p$ are
 \begin{gather} \boldsymbol{\nabla} \boldsymbol{\cdot}{\boldsymbol{u}}=0, \end{gather}
 \begin{gather} \rho_{t}+\boldsymbol{u} \boldsymbol{\cdot} \boldsymbol{\nabla} \rho = \boldsymbol{u} \boldsymbol{\cdot}\boldsymbol{j}, \end{gather}
 \begin{gather} \boldsymbol{u}_{t}+\boldsymbol{u} \boldsymbol{\cdot} \boldsymbol{\nabla} \boldsymbol{u} = - \boldsymbol{\nabla}{p}-\rho\boldsymbol{j}+\nu \nabla^{2}{\boldsymbol{u}}. \end{gather}
Here,  $\boldsymbol {j}$ is a vertical unit vector pointing upwards and
 $\nu =\nu _{*}/NL^{2}$ is the inverse Reynolds number, where
 $\nu _{*}$ denotes the kinematic viscosity.
In the inviscid limit ( $\nu =0$), (4.1) supports time-harmonic plane waves in the form of uniform beams (Tabaei & Akylas Reference Tabaei and Akylas2003)
 \begin{gather} u = u_{0}(\eta,t) = U(\eta)\exp({-\text{i}\omega_{0} t}) + \text{c.c.}, \quad v = v_{0} = 0, \quad w = w_{0} = 0, \end{gather}
 \begin{gather} \rho = \rho_{0}(\eta,t) = -\text{i} U(\eta)\exp({-\text{i}\omega_{0} t}) + \text{c.c.}, \end{gather}
 \begin{gather} p = p_{0}(\eta,t) = \text{i} \cos\theta \int^{\eta}U(\eta')\,\textrm{d}{\eta'}\exp({-\text{i}\omega_{0} t}) + \text{c.c.}, \end{gather}
where  $U(\eta )$ describes the beam profile and is related to the wave generation mechanism. Here,
 $\boldsymbol {u} = (u,v,w)$ are the velocity components in the beam-aligned coordinate system
 $(\xi , \eta , \zeta )$ defined by the along-beam, cross-beam and transverse horizontal coordinate, respectively (see figure 1d). These coordinates are related to
 $(x,y,z)$ by
 $\xi = -x\cos \theta -y\sin \theta$,
 $\eta = -x\sin \theta +y\cos \theta$ and
 $z=-\zeta$, where
 $\theta$ is the beam inclination angle to the horizontal, specified by the forcing frequency
 $\omega _{0}$ via the (non-dimensional) dispersion relation
 $\omega _{0} = \sin \theta$.
The uniform beam given by (4.2) will be used as the basic state for the ensuing stability analysis. The choice of  $U(\eta )$ for comparison with experimental observations will be specified later in § 5.1. As already noted, viscous effects (
 $\nu \neq 0$) introduce along-beam (
 $\xi$) variations in (4.2), corresponding to broadening and a decrease in amplitude of the beam profile far from the forcing (Mowbray & Rarity Reference Mowbray and Rarity1967; Thomas & Stevenson Reference Thomas and Stevenson1972). However, in the interest of simplifying the stability analysis, these effects will be ignored.
To examine the linear stability of the uniform beam (4.2), we now superimpose infinitesimal perturbations in the form of normal modes,
 \begin{equation} u = u_{0}(\eta,t) + \left\{\hat{u}(\eta,t) \exp({\text{i} (\mu \xi + m \zeta)}) + \text{c.c.}\right\}, \end{equation}
with similar expressions for  $v,w,\rho$ and
 $p$. Here,
 $\mu$ and
 $m$ are real parameters that specify the along-beam and transverse wavenumbers of the perturbation. Inserting (4.3) into (4.1), linearizing with respect to the perturbations and dropping the hats, we obtain the following equations governing the perturbations:
 \begin{gather} 0 = \text{i} \mu u + \frac{\partial {v}}{\partial {\eta}} + \text{i} m w, \end{gather}
 \begin{gather} \frac{\partial {\rho}}{\partial {t}} = - \text{i} \mu u_{0} \rho - \frac{\mathrm{d} {\rho_{0}}}{\mathrm{d} {\eta}}v - u\sin\theta + v\cos\theta, \end{gather}
 \begin{gather} \frac{\partial {u}}{\partial {t}} = - \text{i} \mu u_{0} u - \frac{\mathrm{d} {u_{0}}}{\mathrm{d} {\eta}}v -\text{i} \mu p +\rho \sin\theta +\nu \left(-\mu^{2} + \frac{\partial^{2}}{\partial \eta^{2}}-m^{2}\right)u, \end{gather}
 \begin{gather} \frac{\partial {v}}{\partial {t}} = - \text{i} \mu u_{0} v -\frac{\partial {p}}{\partial {\eta}} -\rho \cos\theta +\nu \left(-\mu^{2} +\frac{\partial^{2}}{\partial \eta^{2}}-m^{2}\right)v, \end{gather}
 \begin{gather} \frac{\partial {w}}{\partial {t}} = - \text{i} \mu u_{0} w - \text{i} m p +\nu \left(-\mu^{2} + \frac{\partial^{2}}{\partial \eta^{2}}-m^{2}\right)w. \end{gather}
It can be verified by eliminating  $p$ that it is sufficient to consider
 $\mu \geq 0$ and
 $m\geq 0$ owing to symmetry (see Fan Reference Fan2020, for details). It should be noted that (4.4) includes the full effects of viscosity on the perturbations.
To solve the stability equations (4.4), as the basic state  $u_{0}(\eta ,t)$ in (4.2) is periodic in
 $t$, it is necessary to apply Floquet theory. In the widely studied case of a sinusoidal plane wave, i.e.
 $U(\eta )=U_{0}\exp ({\text {i} k_{0}\eta })/2$ in (4.2), this task is carried out (e.g. Mied Reference Mied1976; Klostermeyer Reference Klostermeyer1991) by expressing
 $(\boldsymbol {u},\rho ,p)$ as an infinite Fourier series in
 $k_{0}\eta -\omega _{0}t$, multiplied with an exponential term that contains the Floquet exponent. After truncating the Fourier series, the resulting eigenvalue problem is solved numerically to obtain the Floquet exponents, which give the instability growth rates. This procedure is then performed over a variety of parameters
 $\mu$ and
 $m$ in order to determine the perturbations with the highest growth rate. In the present setting, however, the primary wave profile
 $U$ is a general, locally confined function of
 $\eta$. Thus, in addition to a Fourier expansion in
 $t$, separate discretization in
 $\eta$ is also necessary, resulting in an eigenvalue problem that is too large to be solved efficiently.
Instead, we follow the approach recently taken by Onuki & Tanaka (Reference Onuki and Tanaka2019) to study the stability of finite-amplitude internal wave beams under oceanic flow conditions and by Jouve & Ogilvie (Reference Jouve and Ogilvie2014) for the stability of inertial wave beams, as well as by earlier authors for Floquet problems in other contexts (e.g. Schatz, Barkley & Swinney Reference Schatz, Barkley and Swinney1995). Briefly, this approach relies on the monodromy matrix, which can be easily computed using time-integration. First, we eliminate  $v$ and
 $p$ from (4.4) and discretize in
 $\eta$ to obtain the matrix equation
 \begin{equation} \frac{\mathrm{d} {\chi}}{\mathrm{d} {t}} = A(t) \chi, \end{equation}
where  $\chi = \{u,w,\rho \}$ is the state vector and
 $A(t)=A(t+T_{0})$ is the periodic matrix (with period
 $T_{0}=2{\rm \pi} /\omega _{0}$) that results from the right-hand side of (4.4). Based on Floquet theory, a fundamental solution matrix to (4.5) is given by
 $X(t) = \textrm {e}^{Bt}P(t)$, where
 $X = \{\chi _{1}, \chi _{2},\ldots \}$ is composed of linearly independent solutions to (4.5),
 $B$ is a constant matrix whose eigenvalues are the Floquet exponents
 $\lambda _{i}$ and
 $P(t) = P(t+T_{0}) = \{P_{1}, P_{2},\ldots \}$ is a periodic matrix composed of the Floquet modes. Because
 $P$ is
 $T_{0}$-periodic, it follows that
 $X(T_{0}) = MX(0)$, where
 $M\equiv \textrm {e}^{BT_{0}}$ is called the monodromy matrix and represents the effect of the operator
 $A$ over one period (i.e. the linearized Poincaré map). To find
 $M$, we set
 $X(0)=I$, the identity matrix, as the initial condition, integrate (4.5) over one period to obtain
 $X(T_{0})$ and compute
 $M= X(T_{0})$. Next, we compute the eigenvalues of
 $M$, denoted
 $\alpha _{i}$, to obtain the Floquet exponents
 $\lambda _{i} = (\log \alpha _{i})/T_{0}$. By definition of the Floquet exponent,
 $\chi \propto \exp (\lambda _{i}t)$ so
 $\mathrm {Re}(\lambda _{i}) > 0$ implies instability. Finally, we repeat this procedure for various
 $\mu$ and
 $m$ in order to find the instability modes with the highest growth rate. We implemented this procedure by discretizing (4.4) using a pseudo-spectral method with 512 Fourier modes in
 $\eta \in [-30, 30]$ and integrating (4.5) with fourth-order Runge–Kutta time stepping and a typical
 $\Delta t=0.02$. The ensuing eigenvalue problem was then solved using standard MATLAB algorithms.
5. Comparison of observations with Floquet analysis
5.1. Instability dynamics
We now make comparisons between the observed instability in § 3 and the predictions of the linear stability analysis outlined in § 4. Taking into account the experimental parameters, the inverse Reynolds number  $\nu =0.0021$. In addition, we chose the primary beam profile
 $U(\eta )$ in (4.2) to be
 \begin{equation} U(\eta) = \frac{1}{2}U_{0} \frac{\displaystyle\int_{0}^{\infty}J_{1}(K)\exp(-\textrm{d}K^{3}+\text{i} K\eta)\,\textrm{d}{K}}{\max \left| \displaystyle\int_{0}^{\infty}J_{1}(K)\exp(-\textrm{d}K^{3}+\text{i} K\eta)\,\textrm{d}{K} \right|}, \end{equation}
where  $J_{1}$ denotes the Bessel function of order one. Here,
 $U_{0}$ is an amplitude parameter that corresponds to the maximum non-dimensional along-beam velocity (i.e.
 $\max |u_{0}| = U_{0}$) and
 $d$ controls the shape of the profile. Expression (5.1) is based on the linear viscous solution by Hurley & Keady (Reference Hurley and Keady1997) for a beam generated by an oscillating cylinder. However, rather than using their solution as originally formulated, which would give
 $U_{0}$ as a function of
 $d$, we instead independently fit
 $U_{0}$ and
 $d$ using the experimentally measured beam profile at a cross-beam slice located 20 cm away from the cylinder. This allowed us to accurately approximate the experimental beam profile and to study the effect of beam amplitude independently of the profile shape (see § 5.2). It should be noted that the agreement between the original solution of Hurley & Keady (Reference Hurley and Keady1997) and the experimental observations is overall satisfactory, although it varies depending on the beam inclination angle and forcing amplitude, and our choice to decouple
 $U_{0}$ from
 $d$ is primarily for convenience. Here, for
 $U_{0}=0.25$ and
 $d=0.0137$ in (5.1), the basic state (4.2) agrees nicely with the experimentally generated unstable beam (at
 $A/L=0.63$) discussed in § 3 for all times after the initial transient (due to start-up of the forcing) and prior to the onset of instability. For comparison, figure 2(c) plots a snapshot of the theoretical beam (4.2) using the profile (5.1) at the same time as the experimentally observed beam in figure 2(b). These values of
 $U_{0}$ and
 $d$ were used for the stability results presented in § 5.2 below, as well as in § 6.1, unless otherwise noted. Furthermore, here we only consider two-dimensional (
 $m=0$) instability modes. A discussion of the effects of transverse variations (
 $m\neq 0$) is presented in § 6.1.
Figure 3(d) plots the frequency spectrum of the computed two-dimensional Floquet mode with the highest growth rate. The theoretical spectrum shows good quantitative agreement with the experimentally measured frequency spectrum (figure 3a) across all instability peaks. For instance, the strongest four frequencies, in order of power, that comprise the experimentally measured instability are  $\omega /N= \{0.45, 0.26, 0.97, 1.17\}$, while the strongest four instability frequencies predicted theoretically are
 $\omega /N=\{0.47, 0.24, 0.94, 1.18\}$. Furthermore, the spatial disturbances associated with the strongest two predicted frequency components at
 $\omega /N=0.24$ and
 $\omega /N=0.47$ (figure 3e,f) are in excellent agreement in both length scale and direction of propagation with the experimental measurements filtered at
 $\omega _{1}/N=0.26$ and
 $\omega _{2}/N=0.45$ (figure 3b,c). The filtered experimental observations were obtained using the Hilbert transform technique (Mercier, Garnier & Dauxois Reference Mercier, Garnier and Dauxois2008). The velocity scale for the theoretically predicted spatial disturbances is normalized to have the same maximum velocity as the experimental measurements.
It is important to note that our theoretical predictions correspond to linear stability modes, which decay outside the primary wave beam and are valid only for limited times after the onset of instability, while the experimental observations correspond to perturbations that evolve according to fully nonlinear dynamics and may eventually propagate freely. This is evident in figure 3(b,c) as the perturbations extend outside the primary wave beam in the direction of their group velocity. In addition, our theory assumes an infinitely long, uniform primary beam, while the experimentally generated beam is of finite length and features slight along-beam variations in amplitude and profile shape as a result of viscosity. Accordingly, the theoretically predicted perturbations extend the entire length of the beam, whereas the experimentally observed perturbations are locally confined in the along-beam direction. Finally, although the Floquet analysis makes quantitative predictions of the instability growth rate, it is not possible to make accurate comparisons with our experimental observations. Figure 2(g) indicates that the initial (exponential) growth of the perturbations likely lasts no more than 10 periods of oscillation of the primary wave. As a result, estimation of the observed growth rate using a short-time Fourier transform yields poor temporal resolution and significant errors, especially since the observed subharmonic perturbations with frequencies  $\omega _{1}/N=0.26$ and
 $\omega _{2}/N=0.45$ have even longer period than the primary wave. Instead, a qualitative discussion of growth rates is made later in connection with the threshold amplitude for instability (see § 5.2).
Our theoretical results confirm that the Floquet stability analysis captures the observed instability of a finite-amplitude thin beam: there is excellent agreement between theory and experiment across the multifrequency spectrum associated with the instability. Even though the classical TRI theory is not applicable for our system as argued in § 3, the observed instability still displays similarities to TRI. Specifically, both our experimental observations and stability analysis show that the dominant components of the instability are two subharmonic disturbances in the form of modulated wavepackets. These disturbances, moreover, satisfy the frequency resonance condition (3.1a) and also very roughly satisfy the spatial resonance condition (3.1b). The observed instability thus may be regarded as a finite-amplitude form of TRI, whose dynamics still features subharmonic disturbances that satisfy triad resonance to some extent, but the finite width and amplitude of the underlying beam are major controlling factors as well.
5.2. Effects of beam amplitude and angle
We now assess the effects of beam amplitude and propagation angle  $\theta$ (i.e. forcing frequency) on the instability dynamics. Figure 4 shows a phase diagram of all stable and unstable experimental configurations observed across a range of amplitudes and angles. Here, just as in § 5.1,
 $U_{0}$ is the maximum non-dimensional along-beam velocity (
 $\max |u_{0}| = U_{0}$) of the observed beam at a slice located 20 cm away from the cylinder and prior to onset of instability, if present. The stable and unstable beams shown in figure 2 and discussed in §§ 3 and 5.1 correspond to the points located at
 $\theta =45{{}^{\circ }}$ and
 $U_{0}= 0.18$ and 0.25, respectively.
Phase diagram showing the dependence of the instability on the non-dimensional beam amplitude  $U_{0}$ and beam angle
 $\theta$. Experimental configurations where instability was visibly apparent, (
 $\blacktriangle$); experimental configurations where instability was not visibly apparent but small instability peaks could be seen in the time frequency spectrum, (
 $+$); stable configurations, (
 $\circ$). Overlaid are contour lines of the (non-dimensional) real growth rate
 $\sigma \equiv \max _{i,\mu }\mathrm {Re}(\lambda _{i})$ as predicted by Floquet stability analysis.

Figure 4 indicates that for given beam angle there exists a critical amplitude below which the beam is stable. This is in qualitative agreement with the analysis of Karimi & Akylas (Reference Karimi and Akylas2014), according to which weakly nonlinear (i.e.  $U_{0}\ll 1$) thin beams are stable to PSI, although formally, their asymptotic assumption of fine-scale perturbations (relative to the primary beam) does not hold here. Figure 4 also shows that beams with shallower angles of propagation (i.e. smaller
 $\theta$) require higher amplitudes to undergo instability. It should be noted that all experimental wave beams were below the overturning amplitude for density inversions given by
 $\textrm {d}\rho _{0}/\textrm {d}{y} = 1$ (e.g. see Kataoka & Akylas Reference Kataoka and Akylas2013), which occurs at
 $U_{0}\cos \theta \approx 0.47$ for the uniform beam (4.2) with the profile (5.1).
Furthermore, figure 4 overlays the non-dimensional growth rate  $\sigma \equiv \max _{i,\mu }\mathrm {Re}(\lambda _{i})$, where
 $\lambda _{i}$ are the (non-dimensional) Floquet exponents predicted by the Floquet stability analysis, as a function of
 $\theta$ and
 $U_{0}$ for the same primary beam profile (5.1) as in § 5.1. Here, for simplicity, we take the parameter
 $d$, which controls the shape of the beam profile, to be fixed
 $d=0.0137$ as
 $\theta$ and
 $U_{0}$ are varied. In reality, the observed beam profiles show slight dependence on
 $\theta$, with the experimentally fitted
 $d$ ranging between 0.012 and 0.017 at a location 20 cm away from the cylinder; however, these differences do not significantly affect the predicted growth rate and are ignored.
Although the contours of constant growth rate in figure 4 appear to qualitatively follow the observed transition region between stability and instability, we find that the linear stability analysis predicts instability for all experimental configurations, including those observed to be stable. According to the Floquet analysis, there is a critical amplitude for instability in qualitative agreement with observation, but the theoretical amplitude threshold is smaller than what is observed. For example, at  $\theta =45{{}^{\circ }}$, the Floquet analysis predicts the critical amplitude for instability to be
 $U_{0}\approx 0.09$, whereas the experimental observations suggest that it is between 0.18 and 0.23. This discrepancy may be attributed to various factors not accounted for in the stability analysis, including the presence of along-beam variations in the beam profile, three-dimensional (transverse) effects and induced mean flows such as streaming. An analysis of the effects of along-beam profile variations lies outside the scope of this study. The effects of three-dimensional variations and mean flows on the instability dynamics are discussed below.
6. Three-dimensional effects
6.1. Perturbations with transverse variations
The stability results reported in § 5 assume that the primary wave beam as well as the perturbations are purely two-dimensional, i.e. there are no variations in the transverse horizontal ( $\zeta$) direction. While these assumptions are reasonable given the small radius-to-length ratio (
 ${\approx }0.044$) of the uniform cylinder used in the experiments described thus far, some three-dimensional effects are inevitably introduced by the finite transverse extent of the tank. First, we consider the effect of
 $m\neq 0$ in (4.3), corresponding to infinitesimal perturbations that vary sinusoidally in
 $\zeta$ on a purely two-dimensional primary beam. Using the same beam profile (5.1) with
 $d=0.0137$, figure 5 plots the theoretically predicted growth rate as a function of the dimensionless transverse wavenumber
 $m$ for various values of beam angle
 $\theta$ and dimensionless beam amplitude
 $U_{0}$. These results indicate that perturbations with transverse variations have lower instability growth rate, and this effect is more pronounced for shallower beam angles and lower beam amplitudes. As a crude estimate, by taking the tank width to be half a wavelength of transverse variation, we find that
 $m\approx 0.26$, which would decrease by
 $\lesssim 10\,\%$ the growth rates for
 $35{{}^{\circ }} \leq \theta \leq 55{{}^{\circ }}$ and
 $0.15\leq U_{0}\leq 0.25$.
Dependence of the instability growth rate  $\sigma$ on the dimensionless transverse wavenumber
 $m$ as predicted by the Floquet analysis for beam angle (a)
 $\theta =35{{}^{\circ }}$, (b)
 $\theta =45{{}^{\circ }}$, (c)
 $\theta =55{{}^{\circ }}$; and dimensionless beam amplitude
 $U_{0} =0.15$ (dotted line),
 $U_{0} =0.20$ (dashed line), and
 $U_{0} =0.25$ (solid line). All growth rates are normalized by the two-dimensional (
 $m=0$) growth rate.

6.2. Transverse beam variations and induced mean flows
As pointed out by recent work, transverse variations in the primary wave beam enable production of mean potential vorticity, which results in a horizontal mean flow (Bordes et al. Reference Bordes, Venaille, Joubaud, Odier and Dauxois2012; Kataoka & Akylas Reference Kataoka and Akylas2015; Fan et al. Reference Fan, Kataoka and Akylas2018; Jamin et al. Reference Jamin, Kataoka, Dauxois and Akylas2020). This induced mean flow has two components, one of inviscid and the other of viscous origin. The latter, known as streaming, grows resonantly in time and is expected to dominate in a laboratory setting where viscous effects are more pronounced (Fan et al. Reference Fan, Kataoka and Akylas2018). It should be noted that along-beam modulations of a purely two-dimensional inviscid beam can also generate a mean flow, but unlike streaming this mean flow is in the along-beam direction and does not grow resonantly (Tabaei & Akylas Reference Tabaei and Akylas2003).
Throughout our experiments using the uniform cylinder, we indeed observed a slowly evolving horizontal mean flow within the primary wave beam (e.g. see time-frequency spectra in figure 3a). Figure 6 plots two examples of this mean flow, obtained by filtering the horizontal velocity about the zero-frequency. As no vertical mean flows were observed, this horizontal mean flow suggests that three-dimensional effects due to the finite width of the tank are indeed present and may play a role in the instability dynamics. It is worth noting that a mean flow is also generated by near-cylinder boundary-layer effects, but it is confined to the vertical ( $y$) location of the cylinder (seen as the long horizontal bands at the top of figure 6) and remains distinct from the mean flow generated within the beam itself.
Experimental mean horizontal velocity field at  $t=300\ \textrm {s}$, obtained by filtering the horizontal velocity field around the zero-frequency. The uniform cylinder is used as forcing. (a) Beam inclination angle
 $\theta =35{{}^{\circ }}$ and forcing amplitude
 $A/L = 0.72$, with
 $t=300\ \textrm {s} \approx 26 T_{0}$; (b)
 $\theta =45{{}^{\circ }}$ and
 $A/L = 0.54$, with
 $t=300\ \textrm {s} \approx 32 T_{0}$. In both cases, the primary wave beam has non-dimensional maximum along-beam velocity
 $U_{0}\approx 0.22$ measured 20 cm away from the cylinder, and did not exhibit any visible signs of instability. Contours of the horizontal velocity field of the primary wave beam at
 ${\pm }1\ \textrm {mm}\,\textrm {s}^{-1}$ are plotted in the dotted lines.

In order to more concretely assess the effect of three-dimensional variations on the instability dynamics, experiments were also conducted using a non-uniform cylinder whose middle section had the same radius as the straight cylinder, but whose end sections had smaller radius (see § 2 and figure 1c). Figure 7 plots the experimentally observed wave fields using the uniform and non-uniform cylinders at  $\theta =45{{}^{\circ }}$ and forcing amplitude
 $A/L = 0.63$. For the uniform cylinder, these forcing conditions are precisely the ones used to generate the unstable beam discussed in § 3 and shown in figure 2. Here, however, PIV measurements were made at two different transverse locations: (i)
 $z=4.3\ \textrm {cm}$, where both the uniform and non-uniform cylinders have radius 22.2 mm; and (ii)
 $z=14.3\ \textrm {cm}$, where the non-uniform cylinder has radius 15.2 mm. The beam generated using the uniform cylinder undergoes instability (figure 7a,b), just as discussed in § 3. Even so, transverse variations, introduced by the finite width of the tank, are visible as the instability appears to be slightly weaker at
 $z=14.3\ \textrm {cm}$ (figure 7b), which is closer to the lateral tank walls, than at
 $z=4.3\ \textrm {cm}$ (figure 7a). The beam generated using the non-uniform cylinder (figure 7d,e) is noticeably thinner at
 $z=14.3\ \textrm {cm}$ than at
 $z=4.3\ \textrm {cm}$, as a result of the smaller cylinder radius at
 $z=14.3\ \textrm {cm}$. Most importantly, however, in contrast to the beam due to the uniform cylinder, the beam due to the non-uniform cylinder appears to be essentially stable, and remained so even at longer times (
 $t=63T_{0}$). This suggests that transverse variations significantly weaken the TRI-like instability discussed in § 3.
Experimental velocity fields for beam inclination angle  $\theta =45{{}^{\circ }}$ and forcing amplitude
 $A/L=0.63$ using the uniform cylinder (a–c) and the non-uniform cylinder (d–e) at
 $t=39 T_{0}$, where
 $T_{0}$ is the forcing period. Panels (a,d) show the horizontal velocity field at
 $z=4.3\ \textrm {cm}$ while panels (b,e) show the horizontal velocity field at
 $z=14.3\ \textrm {cm}$, closer to the lateral tank wall. Panels (c,f) show the mean horizontal velocity field at
 $z=14.3\ \textrm {cm}$ obtained by filtering panels (b,e), respectively, around the zero-frequency. No significant vertical mean flows were observed.

Furthermore, figure 7(c,f) compares the strength of the induced horizontal mean flow due to the uniform cylinder against that due to the non-uniform cylinder, at  $t=39T_{0}$ after start of forcing. As expected, the mean flow generated by the non-uniform cylinder was much stronger than its counterpart due to the uniform cylinder. For the non-uniform cylinder, this mean flow was observed to grow approximately linearly (resonantly) in early times and is therefore likely of the streaming type. Furthermore, in this instance, the strong mean flow noticeably bends the beam (figure 7e), as was found for streaming (Fan et al. Reference Fan, Kataoka and Akylas2018).
Our observations thus indicate that enhancing transverse variations weakens the TRI-like instability and instead favours streaming, an effect that is likely also dependent on forcing amplitude and beam angle, as suggested by the results of § 5.2. This provides a plausible explanation for why Bordes et al. (Reference Bordes, Venaille, Joubaud, Odier and Dauxois2012) observed strong streaming but not TRI: the presence of significant transverse beam variations due to their wavemaker, which spanned only approximately 1/6 of the tank width, as well as the shallow beam angles ( $15{{}^{\circ }}\leq \theta \leq 30{{}^{\circ }}$) used in their study, apparently acted to completely mask TRI.
7. Concluding remarks
Most prior stability studies of internal gravity wave beams focused on subharmonic instabilities due to resonant triad interactions. This instability mechanism is pertinent to small-amplitude nearly monochromatic beams – either as PSI in the nearly inviscid limit appropriate to oceans (Karimi & Akylas Reference Karimi and Akylas2014, Reference Karimi and Akylas2017) or as TRI under laboratory flow conditions (Bourget et al. Reference Bourget, Dauxois, Joubaud and Odier2013). By contrast, the present investigation considered finite-amplitude wave beams whose profile comprises roughly one wavelength, akin to those originally observed by Mowbray & Rarity (Reference Mowbray and Rarity1967). Such thin beams, generated in a stratified fluid tank by oscillating a cylinder in the direction of beam propagation, were observed to be unstable above a threshold wave amplitude to two subharmonic perturbations with wavepacket-like spatial structure. Despite certain similarities to the familiar TRI of small-amplitude nearly monochromatic wave beams, this novel instability can be treated theoretically only via formal stability analysis of a finite-amplitude beam based on Floquet theory. Adapting to our experimental flow conditions the computational procedure used by Onuki & Tanaka (Reference Onuki and Tanaka2019) for finite-amplitude oceanic internal wave beams, the computed most unstable Floquet modes are in very good agreement with the observed subharmonic disturbances.
Our observed instability bears resemblance to recent observations of instability in internal wave attractors (Scolan et al. Reference Scolan, Ermanyuk and Dauxois2013; Brouzet et al. Reference Brouzet, Sibgatullin, Scolan, Ermanyuk and Dauxois2016), which also involve thin beams that feature no more than a single wavelength. In these studies, the authors report that the observed instability appears to satisfy the triad resonance conditions. However, as discussed at the end of § 3, the TRI theory is not strictly applicable for these thin beams, and it is unclear whether the most unstable triad predicted by TRI theory matches their observed instability. In view of the results presented here, it is possible that Floquet stability analysis, which takes into full account the finite width and amplitude of the beam, may be used to predict the observed instability frequencies and wavevectors of the attractor system. This approach has been used by Jouve & Ogilvie (Reference Jouve and Ogilvie2014) to predict theoretically the instability found in numerical simulations of an inertial wave attractor.
We also explored the significance of three-dimensional effects on the observed subharmonic instability. According to our Floquet stability analysis, under the experimental flow conditions, infinitesimal perturbations with sinusoidal dependence in the transverse direction generally have smaller growth rates than their two-dimensional counterparts. Furthermore, finite transverse beam variations, introduced by using as forcing a cylinder with non-uniform radius, were observed to weaken the subharmonic instability and, in addition, to induce a horizontal mean flow of the streaming type. Thus, although it is possible for TRI-like subharmonic instability and streaming to coexist, in the presence of significant transverse variations the latter effect is expected to dominate, consistent with the observations of Bordes et al. (Reference Bordes, Venaille, Joubaud, Odier and Dauxois2012). However, in more complex three-dimensional geometries, such as in the thin beams generated by an oscillating torus (Shmakova & Flór Reference Shmakova and Flór2019), instability of the TRI-type may still be important, particularly in the intersection region of various wave beams.
In the nearly inviscid oceanic context, the strength of streaming probably would be greatly diminished as it hinges on the generation of mean potential vorticity by dissipative processes. On the other hand, as also hinted by the nearly inviscid stability computations of Onuki & Tanaka (Reference Onuki and Tanaka2019), the finite-amplitude TRI-like instability of thin beams discussed here is likely to persist. However, as we find that the beam propagation angle  $\theta$ plays an important part in the instability dynamics, a complete stability analysis for
 $\theta$ in the range
 $3 {{}^{\circ }} \lesssim \theta \lesssim 5{{}^{\circ }}$, appropriate to oceanic beams, is necessary and is left to future studies.
Acknowledgements
The authors would like to thank Professor T. Peacock for use of the experimental facilities and advice about the experimental set-up, as well as R. Supekar for guidance on the experimental methods. This work was supported in part by the US National Science Foundation under grant DMS-1512925 and a Graduate Research Fellowship (grant 1122374) to B.F.
Declaration of interests
The authors report no conflict of interest.



