Introduction
Primary and secondary metabolites exuded by plants are utilized by soil-dwelling phytophagous insect larvae to locate and identify host-plant species (Johnson & Gregory, Reference Johnson and Gregory2006; Johnson & Nielsen, Reference Johnson and Nielsen2012). Secondary plant metabolite attractants generally include species, genus and family-specific chemicals that may allow both monophagous and oligophagous larvae to identify their specific host-plants (Johnson & Gregory, Reference Johnson and Gregory2006). Primary plant metabolites are metabolites directly involved in essential plant processes and are thus ubiquitous to all plants (Taiz & Zeiger, Reference Taiz and Zeiger2010). Primary plant metabolites such as carbon dioxide (CO2) and carbohydrates have been shown to have an important role in host-plant location in a number of insect species (Thorpe et al., Reference Thorpe, Crombie, Hill and Darrah1947; Strnad et al., Reference Strnad, Bergman and Fulton1986; Honda & Ishikawa, Reference Honda and Ishikawa1987; Galbreath, Reference Galbreath1988; Hopkins et al., Reference Hopkins, Griffiths, Birch, McKinlay and Hall1993; Huang & Mack, Reference Huang and Mack2001; Johnson et al., Reference Johnson, Zhang, Crawford, Gregory, Hix, Jarvis, Murray and Young2006), including a number important to agriculture, such as Diabrotica spp. (corn rootworm, Strnad et al., Reference Strnad, Bergman and Fulton1986; Jewett & Bjostad, Reference Jewett and Bjostad1996), Agriotes spp. (wireworm, Klingler, Reference Klingler1957), Delia radicum (cabbage root fly, Jones & Coaker, Reference Jones and Coaker1978) and Psilia rosae (carrot root fly, Jones & Coaker, Reference Jones and Coaker1977).
Despite being found to induce behavioural changes in a number of soil-dwelling phytophagous insects, CO2 gradients as a means for host-plant location is difficult to conceive, due to: (1) The universal production of CO2 by plants prevents distinction from host and non-host species. (2) There are a number of potential non-host point sources of CO2 in the soil such as microbial interactions (Hanson et al., Reference Hanson, Edwards, Garten and Andrews2000). (3) Interaction between atmospheric and soil CO2 concentrations disrupt CO2 gradients from plants (Gollany et al., Reference Gollany, Schumacher, Rue and Liu1993; Sheppard & Lloyd, Reference Sheppard and Lloyd2002).
In some systems, CO2 has been proposed as being attractive to host-plant seeking insects, with larvae orientating towards a source (Jones & Coaker, Reference Jones and Coaker1977; Jewett & Bjostad, Reference Jewett and Bjostad1996). However, for species such as Sitona lepidus (clover weevil) no attraction has been demonstrated, but behavioural changes are observed when larvae are exposed to concentrations of CO2 comparable with that found around the root system of its host-plant (Johnson et al., Reference Johnson, Zhang, Crawford, Gregory, Hix, Jarvis, Murray and Young2006). It has been suggested that CO2 does not always play a direct role in identifying suitable hosts in the subterranean environment, but plays a role in initiating searching behaviour (Johnson et al., Reference Johnson, Zhang, Crawford, Gregory, Hix, Jarvis, Murray and Young2006; Hiltpold & Turlings, Reference Hiltpold and Turlings2012; Johnson & Nielsen, Reference Johnson and Nielsen2012; Turlings et al., Reference Turlings, Hiltpold and Rasmann2012). Understanding the mechanisms underpinning host-plant location in pest species can be keyed to the development of novel pest control strategies.
Delia coarctata (Fallén, Diptera: Anthomyiidae, wheat bulb fly (WBF)) oviposit in bare and exposed soil such as that colonized by its suspected natural host couch grass (Elytrigia repens) (Marriott & Evans, Reference Marriott and Evans2003). In agricultural environments, WBF display a preference for fallow ground or fields containing potato, sugar beet and open canopy vegetables (Petherbridge, Reference Petherbridge1921; Morris, Reference Morris1925). Often, crop rotations result in wheat (Triticum aestivum L.) being sown after these crops, allowing WBF larvae to infest vulnerable wheat seedlings when the eggs hatch in January and February (Way, Reference Way1959). Since the eggs are not laid in association with a host-plant (Petherbridge, Reference Petherbridge1921), hatching larvae are required to seek out host-plants quickly before energy reserves run out.
Wheat bulb larvae have been shown to display positive taxis towards exudates of host-plants (Marriott & Evans, Reference Marriott and Evans2003; Rogers & Evans, Reference Rogers and Evans2013). However, no research has looked at the role of primary plant metabolites such as CO2 in host-plant location by WBF larvae. The studies on WBF larval behavioural responses to exudates and chemical constituents have previously concentrated on analysing the final resting position of the larvae or observing movement to a source (Stokes, Reference Stokes1956; Scott, Reference Scott1974; Greenway et al., Reference Greenway, Scott, Calam and Smith1976; Marriott & Evans, Reference Marriott and Evans2003; Rogers & Evans, Reference Rogers and Evans2013), and these methodologies simply allow the description of attraction or repellence. However, valuable information contained in the movement path of the larvae is not recorded.
Analysis of the tracks left by insects exposed to semiochemicals can provide evidence of the role these chemicals play in the insects' ecology (Nams, Reference Nams2005). The analysis of the fractal dimension of track shape is commonly used to interpret tracks left by animals (Doerr & Doerr, Reference Doerr and Doerr2004). The fractal dimension of a track shape allows the inference of the behaviour of the animal based on its movements (Nams, Reference Nams1996). The lower the fractal dimension value attributed to a track in a homogeneous environment the more direct the animal is moving from one point to another, suggesting movement between resource patches (Wiens et al., Reference Wiens, Crist, With and Milne1995). However, a higher fractal dimension associated with a more tortuous track can indicate searching behaviour within a resource, with the area being covered more intensively.
Understanding the chemical ecology of WBF allows the potential to develop new control measures that can lessen the current dependence on the use of organophosphate insecticides in control of this species. The aim of this study was to observe the behavioural response of WBF larvae in relation to CO2. Bioassays were conducted to identify whether larvae orientated towards a point source of CO2 (chemotaxis) (Adler, Reference Adler1966; Eisenbach, Reference Eisenbach2004) or alter their searching behaviour (turning pattern, indicated by a change in fractal dimension) in the presence of differing concentrations of CO2 without moving towards the source (kinesis) (Gillott, Reference Gillott2005). Finally, the concentration of soil CO2 in relation to host-plant seedlings was determined to relate the bioassay response to CO2 to the concentration typically encountered by WBF larvae in soil.
Materials and methods
Biological material
Field collected WBF eggs were surface sterilized with 0.3% NaOCl before being rinsed in sterile distilled water (Bellows & Fisher, Reference Bellows and Fisher1999; Marriott, Reference Marriott2001). The eggs were stored between sections of nylon, positioned on top of moist vermiculite in a sealed 90 mm Petri dish. Eggs were stored at 5 °C for at least 2 months; methyl paraben was added to the eggs to control fungal infections as required. Eggs were stored at 10 °C to initiate hatching after the two month diapause had elapsed, and larvae were used within 24 h of hatching, with individual larvae used once only.
Wheat seeds (cv. Aristos) were surface-sterilized in 3% NaOCl solution for 2 min, before being thoroughly rinsed in sterile distilled water. The seeds were then germinated in 90 mm Petri dishes containing 0.3% technical grade agar under sterile conditions. The seeds were germinated in the dark at 13 °C for 7 days (until coleoptiles were at least 80 mm in length), before being used in the experiment.
CO2 as an attractant
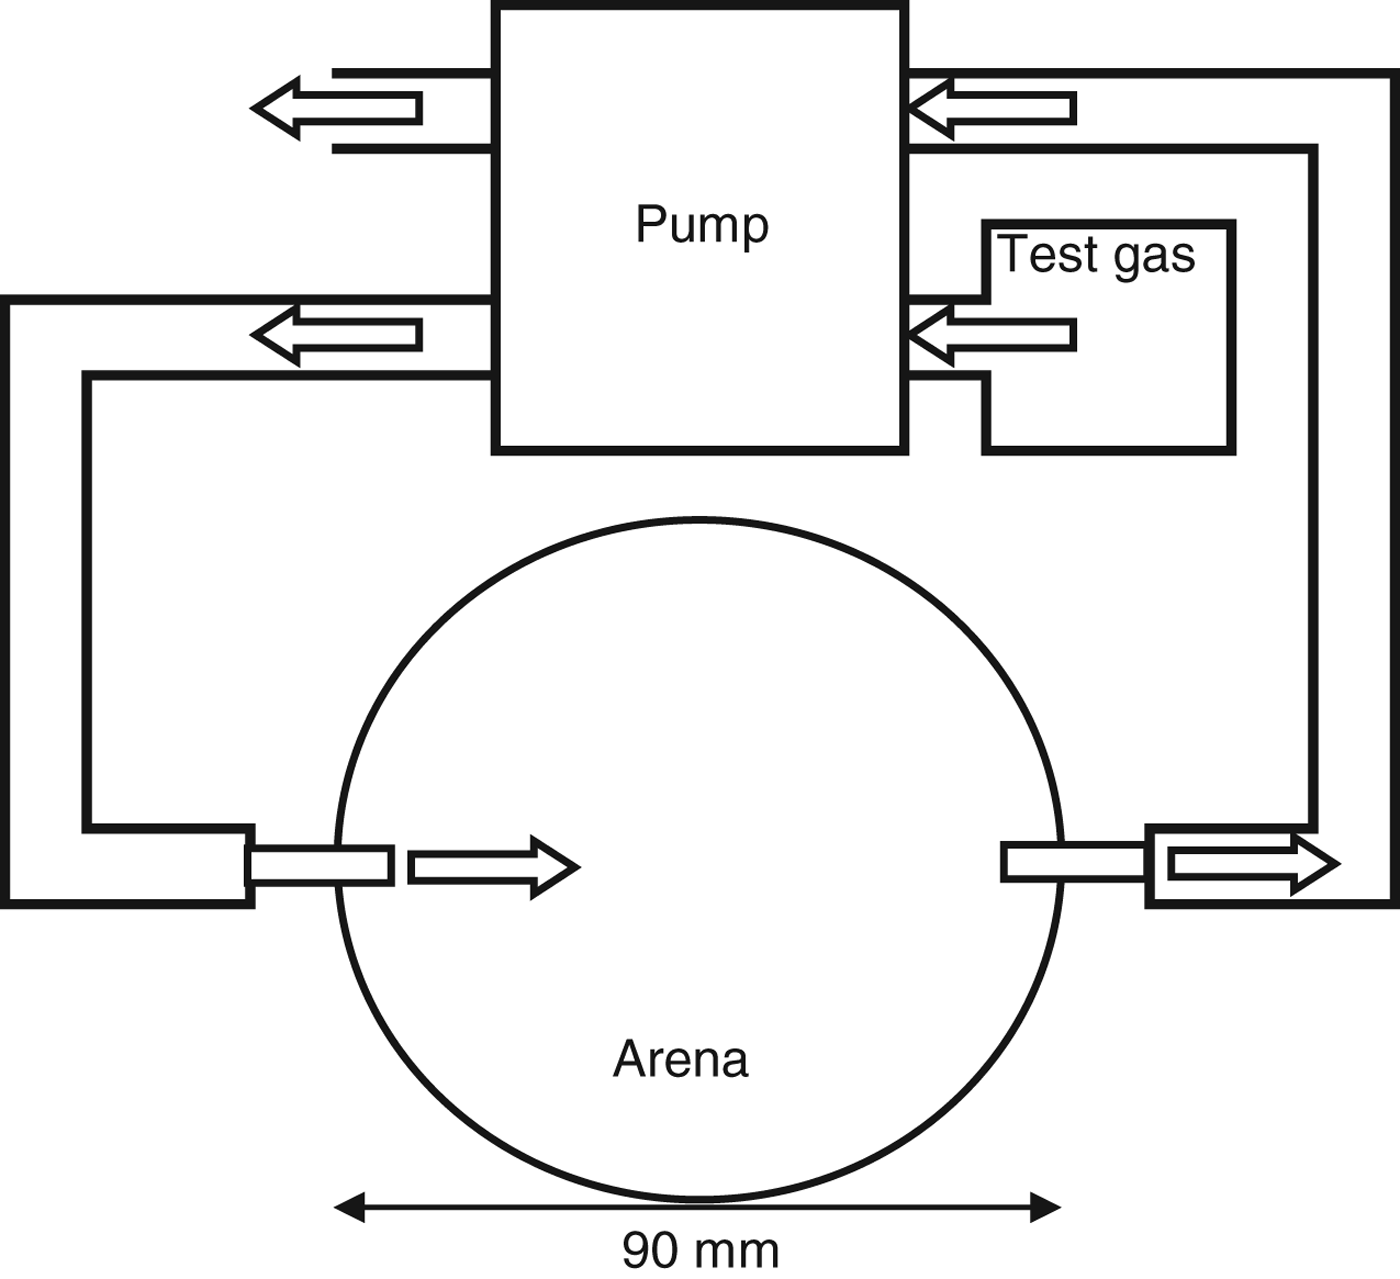
Larval tracks were observed in circular arenas consisting of a 90 mm diameter Petri dish with an inlet and an outlet valve at opposite sides of the arena (fig. 1). The base of the arena was lined with a 5-mm thick film of agar (Oxoid, Technical grade 0.3%), while an opening on the lid allowed access for placement of test larvae, without disrupting the atmosphere of the arena. A cap coated with petroleum jelly was used to seal the opening during the experiment.
Diagram of area bioassay used to record the behavioural response of WBF larvae to different concentrations of CO2: 0, 380, 1000, 1500, 2000 and 2500 ppm. Direction of system airflow indicated by:  .

A constant stream of CO2 (>99%) or CO2-free air (BOC, UK) (absorbed using sodium hydroxide (Tepe & Dodge, Reference Tepe and Dodge1943)) was pumped into the arena at 8 ml h−1 (the most attractive rate found by Jones & Coaker, Reference Jones and Coaker1977; Johnson et al., Reference Johnson, Zhang, Crawford, Gregory, Hix, Jarvis, Murray and Young2006), while air was drawn out of the arena directly opposite the inlet at the same rate. The CO2 gradient was allowed to build for 1 h before a larva was introduced into the centre of the arena, presenting it towards the airflow. Arenas were stored in the dark at 18±2 °C for 20 min after which the larval track visible on the agar film was traced on to the base of the arena, and the number of larvae that moved to within 20 mm of the inlet were recorded. The number of individuals tested for each treatment was 20, with each larva being used once only.
CO2 as a behavioural modifier
Larvae were released in the centre of Petri dish arenas (the same as described in the previous experiment), which were then sealed and saturated with specific concentrations of either CO2: 380 (ambient), 1000, 1500, 2000 and 2500 ppm, or a control consisting of CO2-free air. CO2 concentrations were verified using a CO2 meter (Gascard II, Edinburgh Instruments Ltd.). Larval start position was recorded and arenas were stored in the dark at 18±2 °C for 20 min, after which the resulting larval track visible on the agar film was traced on to the base of the arena. Tracks were digitized and x–y co-ordinates for the tracks were captured. The number of individuals tested for each treatment was 20, each larva being used once only.
Behavioural statistical analysis
Larval attraction to CO2 was assessed by analysing the movement of larvae to within 20 mm of the point source using Fisher's exact P test (Johnson et al., Reference Johnson, Zhang, Crawford, Gregory, Hix, Jarvis, Murray and Young2006). Larval behavioural response to constant CO2 atmospheres were assessed by analysing larval tracks using Fractal (v. 5.18.0) software (Nams, Reference Nams1996). Fractal dimension is commonly used to interpret tracks left by animals (Doerr & Doerr, Reference Doerr and Doerr2004). A fractal is a geometric shape that has ‘self similarity’, meaning when divided into sections, each section looks like a smaller sized version of the original shape. The fractal dimension is a statistical quantity that indicates how completely the fractal fills space as the scale is reduced (Mandelbrot, Reference Mandelbrot1967; Milne, Reference Milne, Turner and Gardner1991). When analysing an animal track its fractal dimension is a measure of track tortuosity (how tortuous the track is i.e., how much it twists and turns) (Milne, Reference Milne and Bissonette1997). The fractal dimension of a track lies between the values 1.0 and 2.0, with a value of 1.0 representing a track that is a straight line and 2.0 being a tortuous track that completely covers a plane (Nams, Reference Nams1996).
Tracks that are produced in heterogeneous environments will show direct lines from resource to resource with tortuous sections within each resource patch, and not display self-similarity (Wiens et al., Reference Wiens, Crist, With and Milne1995). The assumption that the environment in the arena was homogeneous was tested by examination of the correlation between track length (number of fractal dividers) and the fractal divider size. If the relationship between the track length and the divider size conforms to a power-law relationship, then it is seen to be scale-invariant, displaying self-symmetry (Mandelbrot, Reference Mandelbrot1983), therefore laid by larvae experiencing a homogeneous environment (Johnson et al., Reference Johnson, Zhang, Crawford, Gregory, Hix, Jarvis, Murray and Young2006).
Fractal dimension (FD, a dimensionless quantity) and length (mm) were calculated for each track using Fractal (v. 5.18.0) software (Nams, Reference Nams1996) and transformed by log10 and square root respectively to normalize the data (tested by an Anderson–Darling test), as a normal distribution is a requirement for analysis by one-way analysis of variance (ANOVA) (Fowler et al., Reference Fowler, Cohen and Jarvis1998). Fractal dimension values and track length were analysed with ANOVA, with post-hoc comparisons by Tukey's test (Johnson et al., Reference Johnson, Zhang, Crawford, Gregory, Hix, Jarvis, Murray and Young2006), and finally 95% confidence intervals (CI) were calculated. All statistics were conducted using Minitab statistical software version 15 (Minitab Inc.). The number of individuals tested for each treatment was 20.
CO2 concentration in soil, sample collection
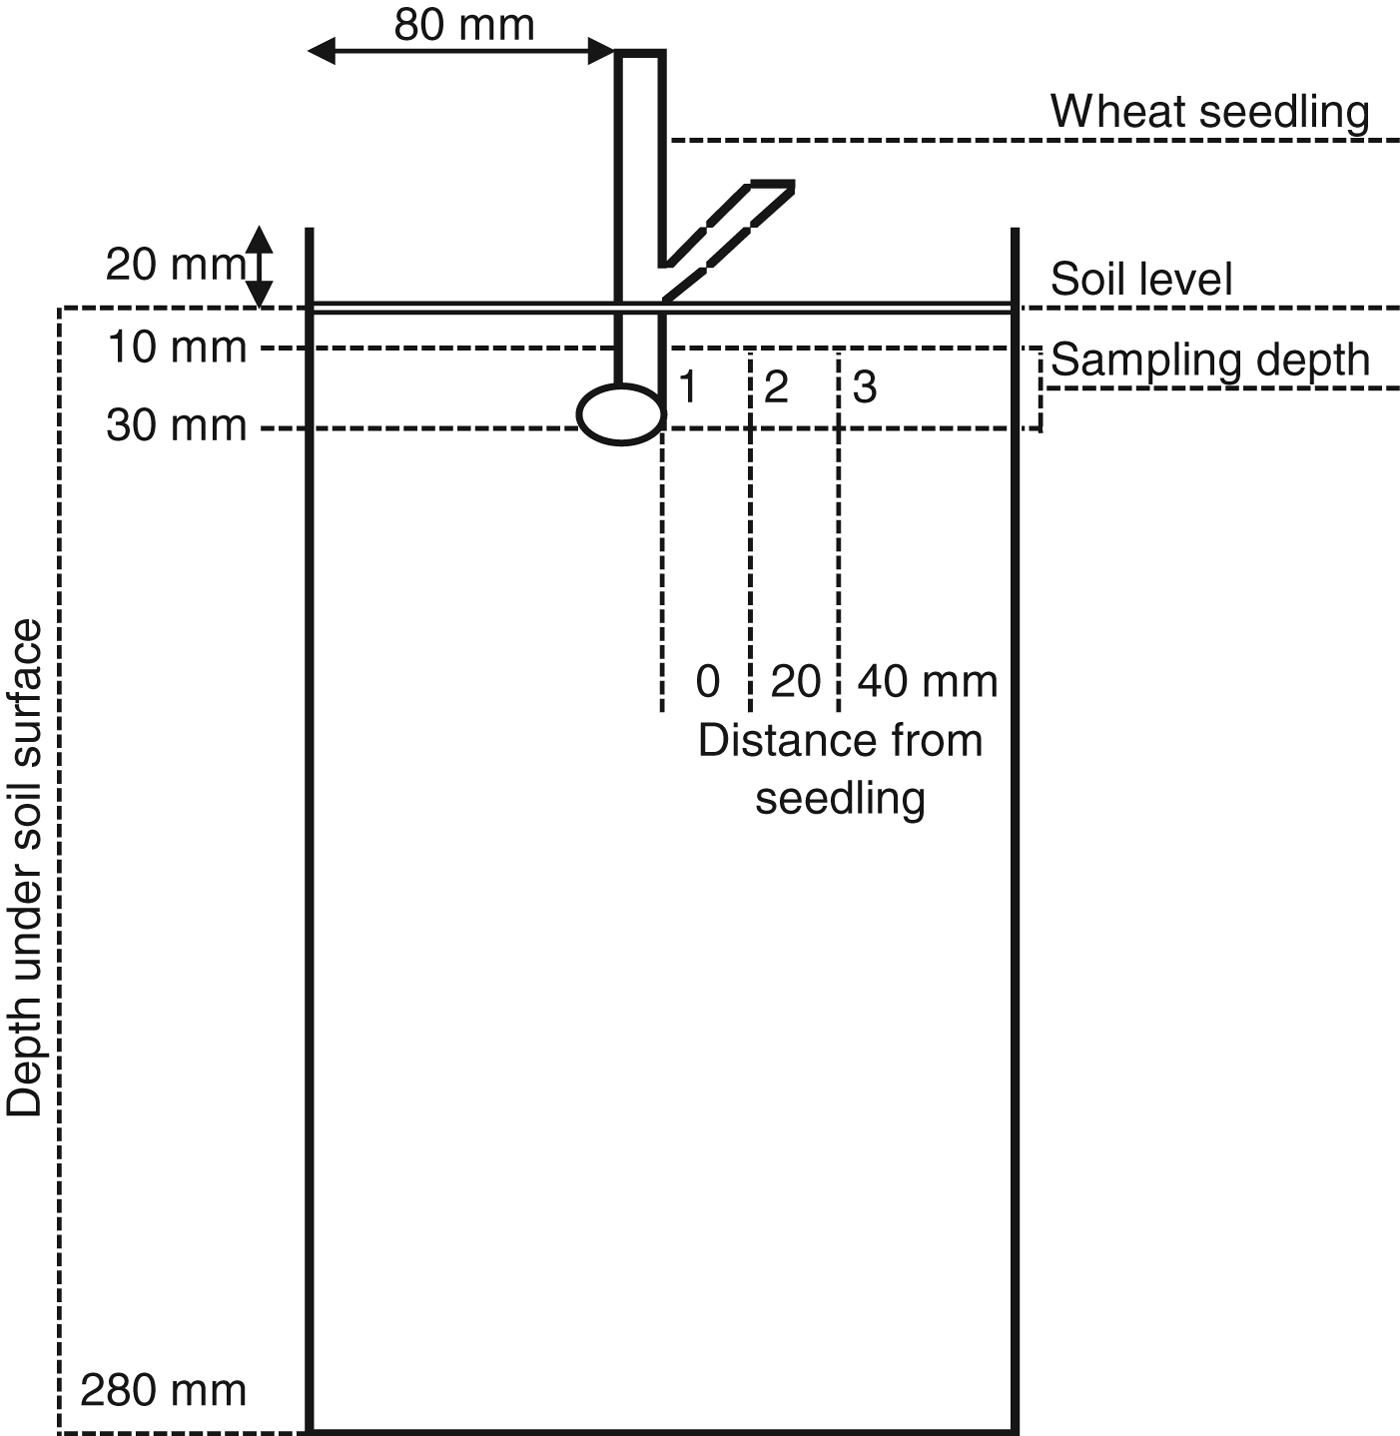
Germinated wheat seedlings (cv. Aristos) were planted at the depth of 30 mm in top soil (packed to a bulk density of 1.2 g cm−3) in the centre of cylindrical containers measuring 160 mm in diameter and 130 cm in height (fig. 2). The seedlings were grown in these microcosms, housed in Snijdes Scientific (Microclima 1000E) growth cabinets under the following conditions: a constant light and dark period temperature of 12:7 °C, respectively; a photoperiod of 12:12 (light:dark); light intensity of 12,000 Lux; relative humidity of ≥50%. The wheat seedlings were grown for 11 days, individual microcosms were weighed at regular intervals and watered gravimetrically to maintain soil moisture at 45%. After 11 days microcosms were sealed using parafilm and left to stand for 1 h. Gas samples, 11 ml in volume, were taken from sampling ports using a sterile syringe to analyse the CO2 concentration. A sampling port was situated at either: 0, 20 or 40 mm distance from the seedling at a depth of between 10 and 30 mm (fig. 2). A single distance was sampled from each microcosm, with each distance replicated eight times.
Diagram of the setup and sampling positions for CO2 analysis of wheat seedlings grown within microcosms.
Analysis through gas chromatography
CO2 samples were analysed using a Hewlett Packard Series II 5890 gas chromatograph (GC), utilizing a thermal conductivity detector (TCD). Column temperature was held at 45 °C throughout the analysis (total run time approximately 3 min, per sample). The injector temperature was 35 °C, with an injection volume of 1 ml. The carrier gas was hydrogen (BOC, UK), the calibration standards (390; 1093; 5262; 10,100 ppm CO2 were supplied by BOC, UK) were run in triplicate. The mean of the two most similar results were taken and plotted to produce a linear standard curve so as to estimate the unknown samples.
Results
CO2 as an attractant
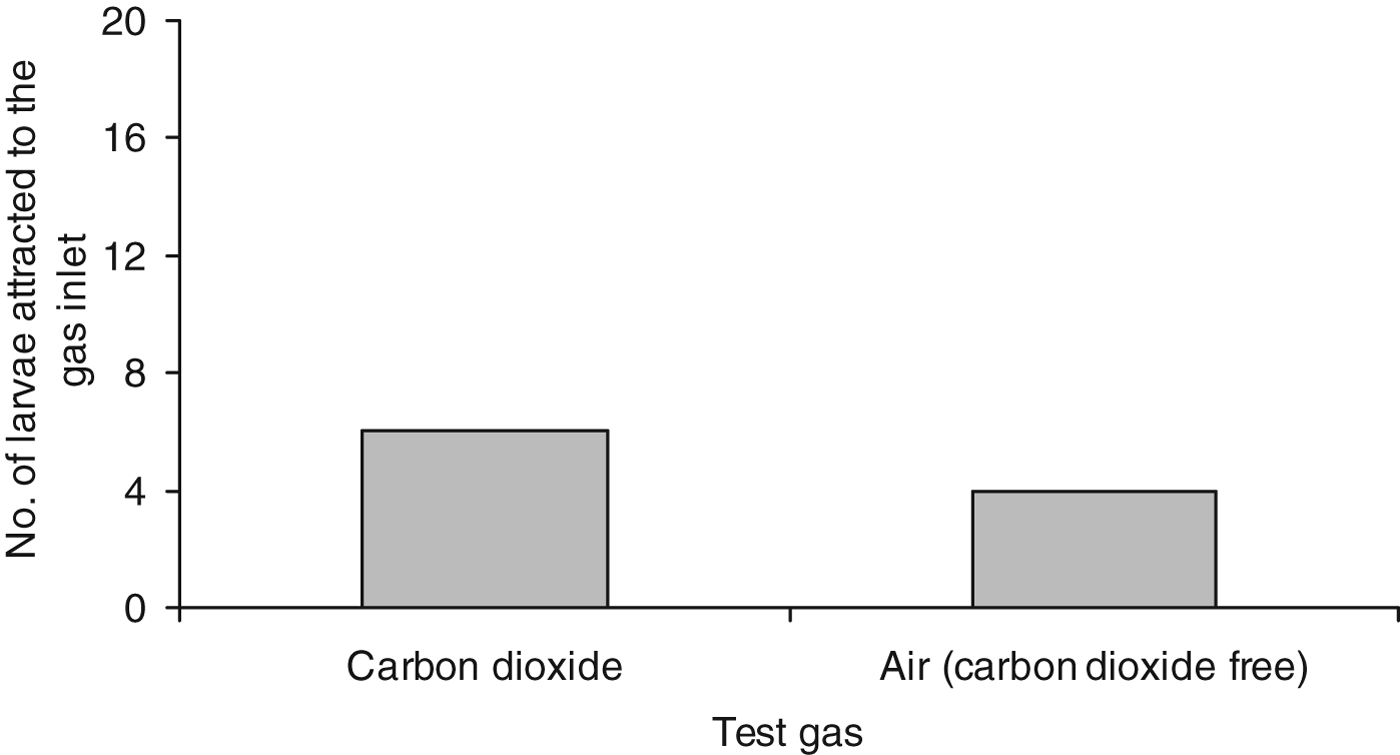
Analysis of arena bioassays offering a constant stream of CO2 or CO2-free air at 8 ml h−1 showed no significant difference in larval numbers entering a 20 mm radius of the inlet (fig. 3) when analysed using Fisher's exact test (P=0.716).
Number of WBF larvae that moved to within 20 mm of the gas inlet in arenas, introducing either CO2 or CO2-free air (the control), at a rate of 8 ml h−1, N=20.
CO2 as a behavioural modifier
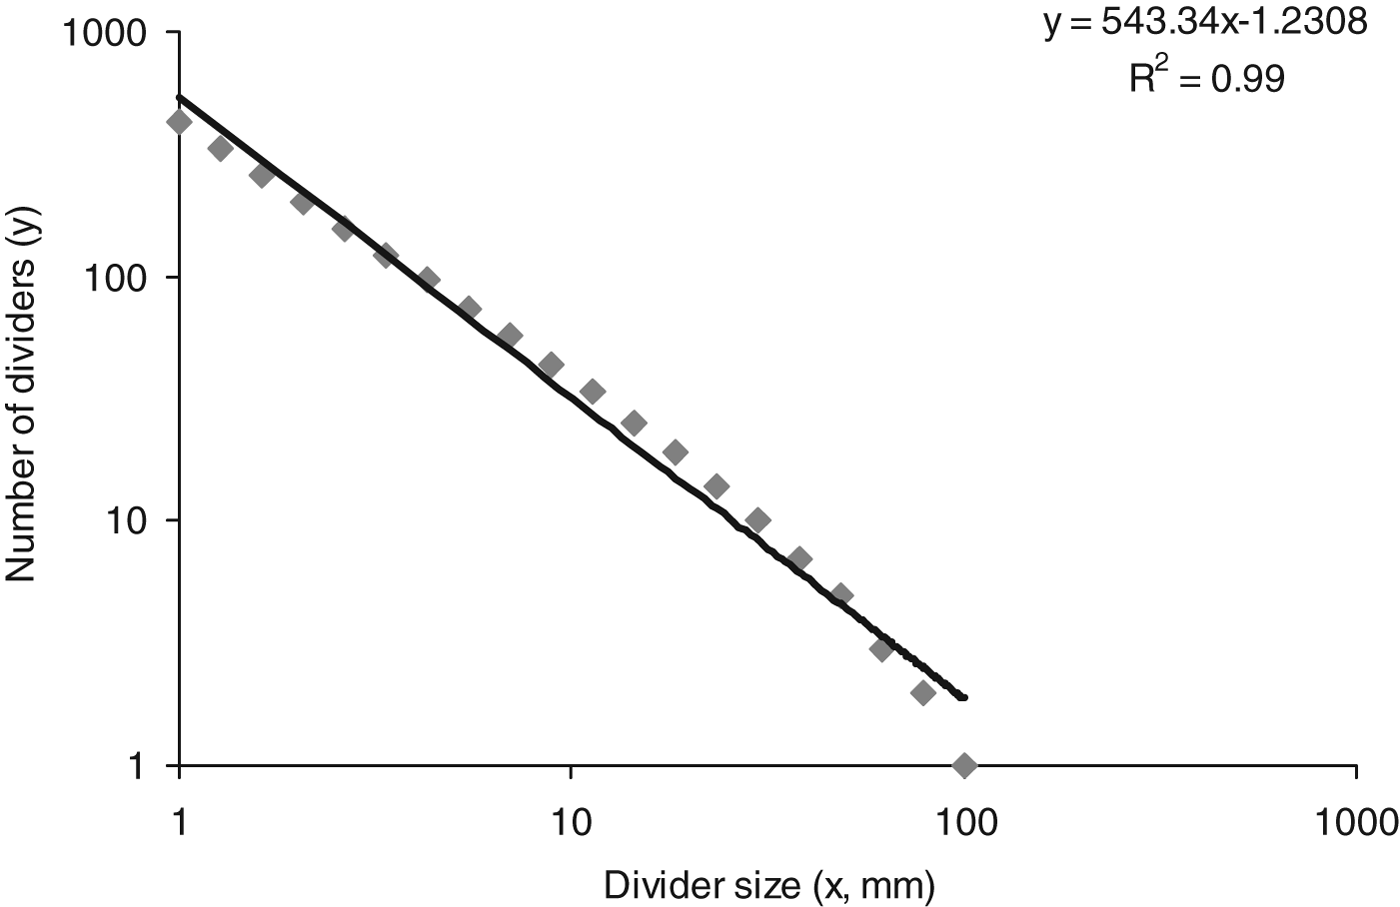
When assessing the larval behavioural response to constant CO2 concentrations through analysis of track fractal dimensions, the assumption was made that the habitat (arena) encountered by the larvae was homogeneous in nature. If this was the case then the relationship between the ‘number of dividers’ (track length) and ‘divider size’ would be scale invariant (scaling divider size by a constant causes a proportionate scaling of the track length). This was demonstrated by plotting track length and the divider size, proportionate scaling was observed as track length and the divider size conformed to a power-law relationship (R 2=0.99) (fig. 4). This scale-invariant relationship meant that larvae did not encounter a heterogeneous environment in the arenas, i.e., the atmosphere in arena was homogeneous.
Power-law relationship between number of dividers (track length) and divider size (mm). R 2=coefficient of determination.
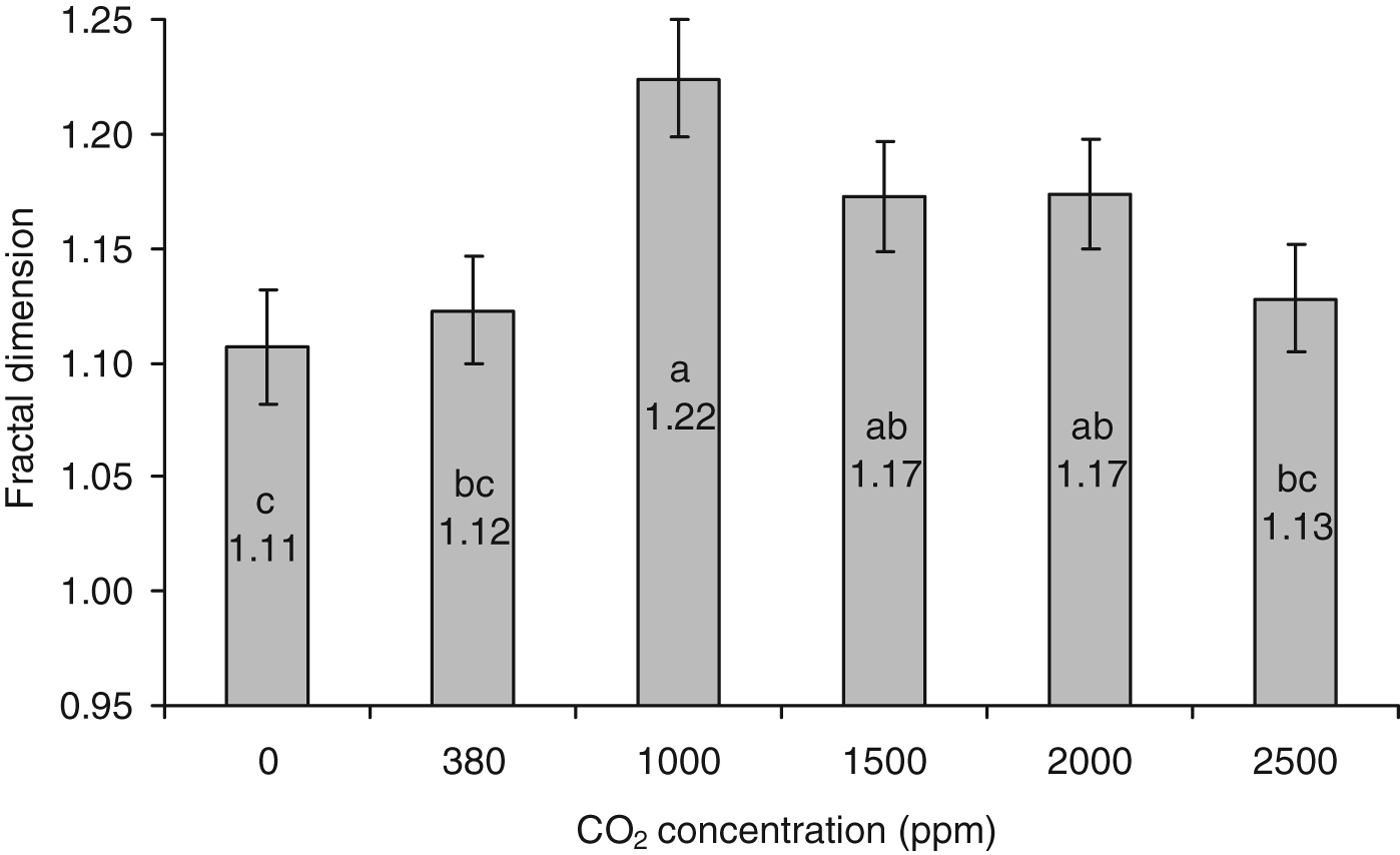
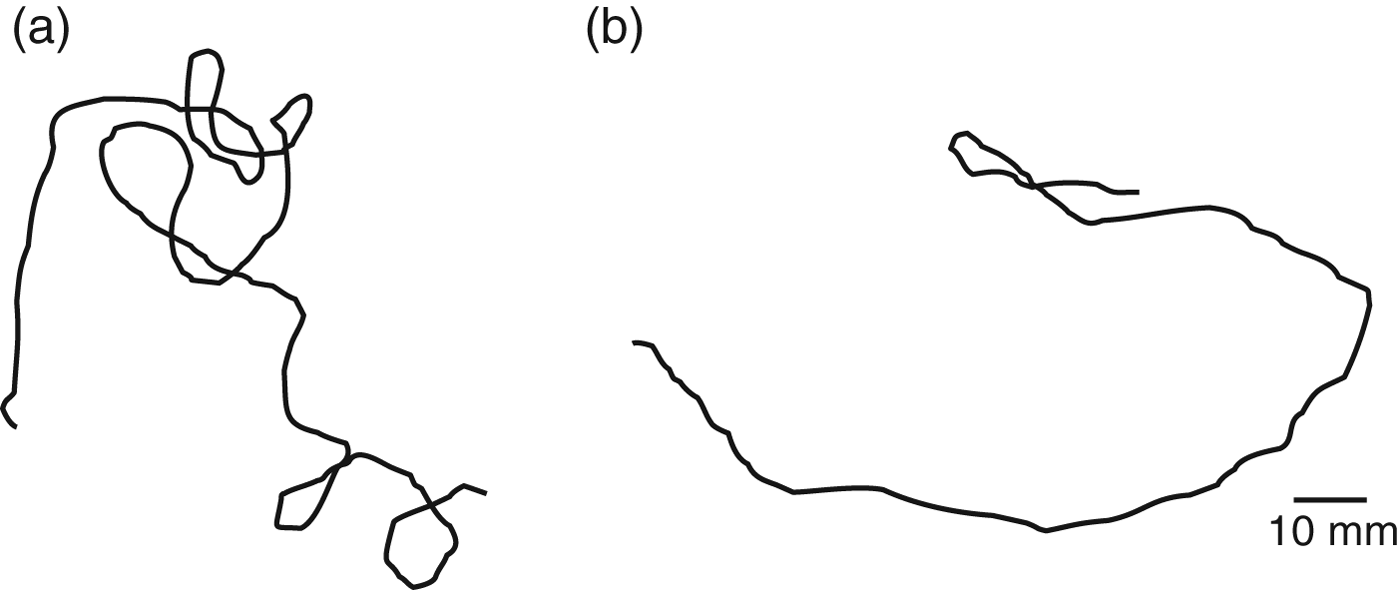
Fractal dimension and distance of track data were normally distributed when transformed by log10 and square root, respectively. ANOVA conducted on the fractal dimension data showed that there were significant differences within the group of CO2 concentrations: F 5, 114=8.38; P<0.001. Tukey's post-hoc test provided information on which groups were significantly different from each other (fig. 5). Larval tracks produced in the elevated CO2 concentration level of 1000 ppm (fig. 6a) were shown to be significantly more tortuous than those produced under 0 (fig. 6b) or 380 ppm CO2 concentrations (P<0.001 and <0.001, respectively), and also more so than the highest concentration tested, 2500 ppm (P<0.001). Although not as pronounced, the higher concentrations of CO2; 1500 ppm (P=0.024) and 2000 ppm (P=0.021), were significantly more tortuous than those produced under a 0 ppm CO2 environment.
Mean fractal dimensions (back-transformed) (±95% CI) of tracks laid by WBF larvae exposed to different concentrations of CO2: 0, 380 (atmospheric), 1000, 1500, 2000, 2500 ppm. The greater the fractal dimension value, the more tortuous the path taken, N=20. Statistical differences between groups are indicated by differing lower case letters (one-way ANOVA post-hoc comparisons by Tukey's test).
Track of WBF larva made in an arena with a homogeneous atmosphere containing (a) 1000 ppm CO2. The track displays higher tortuosity (higher fractal dimension, FD=1.3), indicating the animal was travelling within a resource; (b) 0 ppm CO2. The track displays low tortuosity (low fractal dimension, FD=1.1), indicating the animal was travelling between resources.
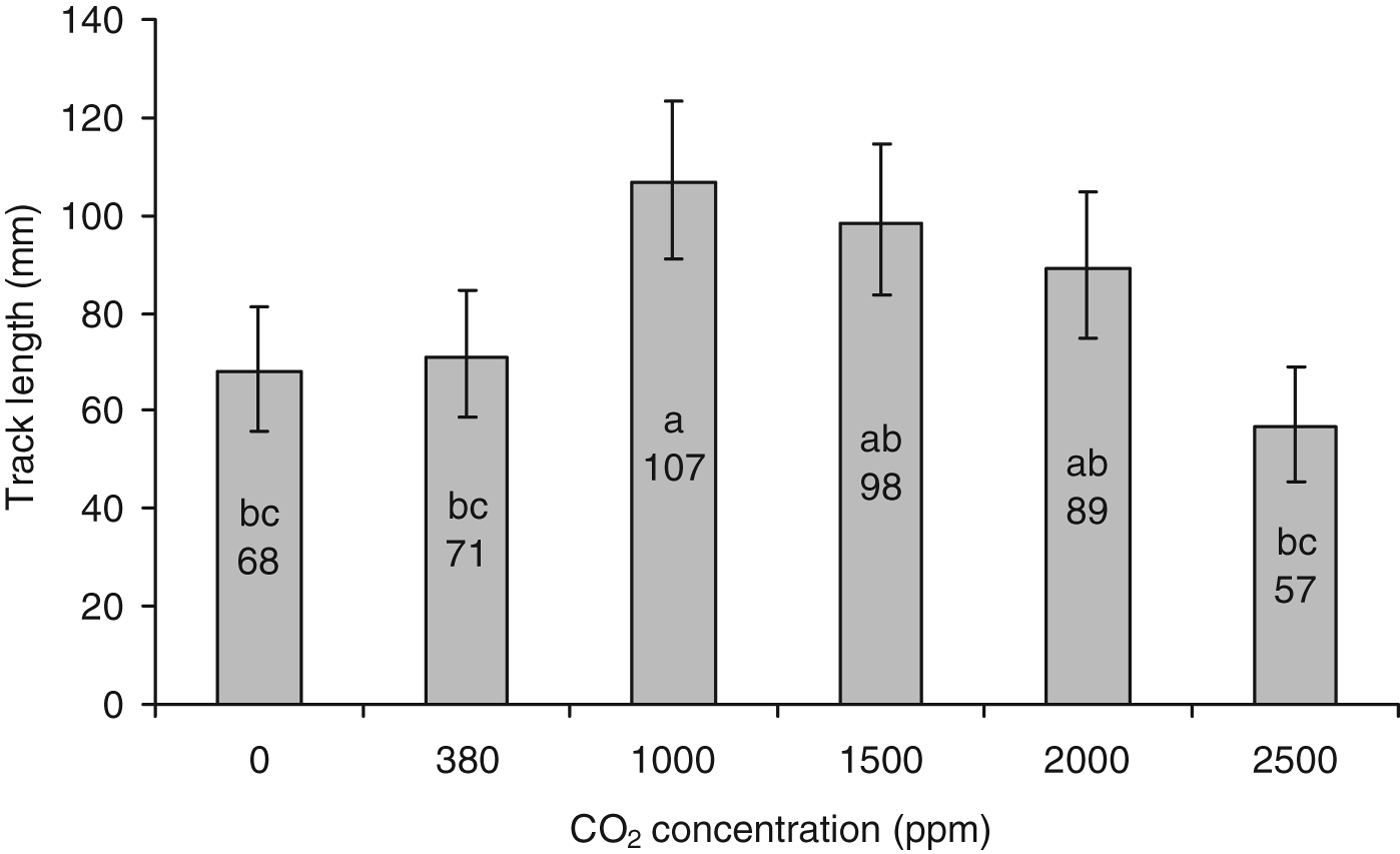
ANOVA of track distance data collected under different constant CO2 concentrations also showed significant differences between treatments; F 5, 114=5.70, P<0.001. The post-hoc Tukey's test highlighted significant differences between track lengths (fig. 7); tracks formed under the 1000 ppm CO2 environment were significantly longer than those formed under the 0 (P=0.018), 380 (P=0.042) and 2500 ppm (P≤0.001) environments. The length of tracks produced under a CO2 concentration of 1500 ppm were significantly longer than those produced under 0 ppm conditions (P=0.021), whereas tracks formed under 1500 and 2000 ppm conditions were significantly longer than those created under 2500 ppm CO2 (P=0.004 and 0.04, respectively).
Mean length (back-transformed) (mm±95% CI) of tracks laid by WBF larvae exposed to different constant concentrations of CO2: 0, 380 (atmospheric), 1000, 1500, 2000, 2500 ppm, N=20. Statistical differences between groups are indicated by differing lower case letters (one-way ANOVA, post-hoc comparisons by Tukey's test).
Seedling derived CO2 concentration in soil
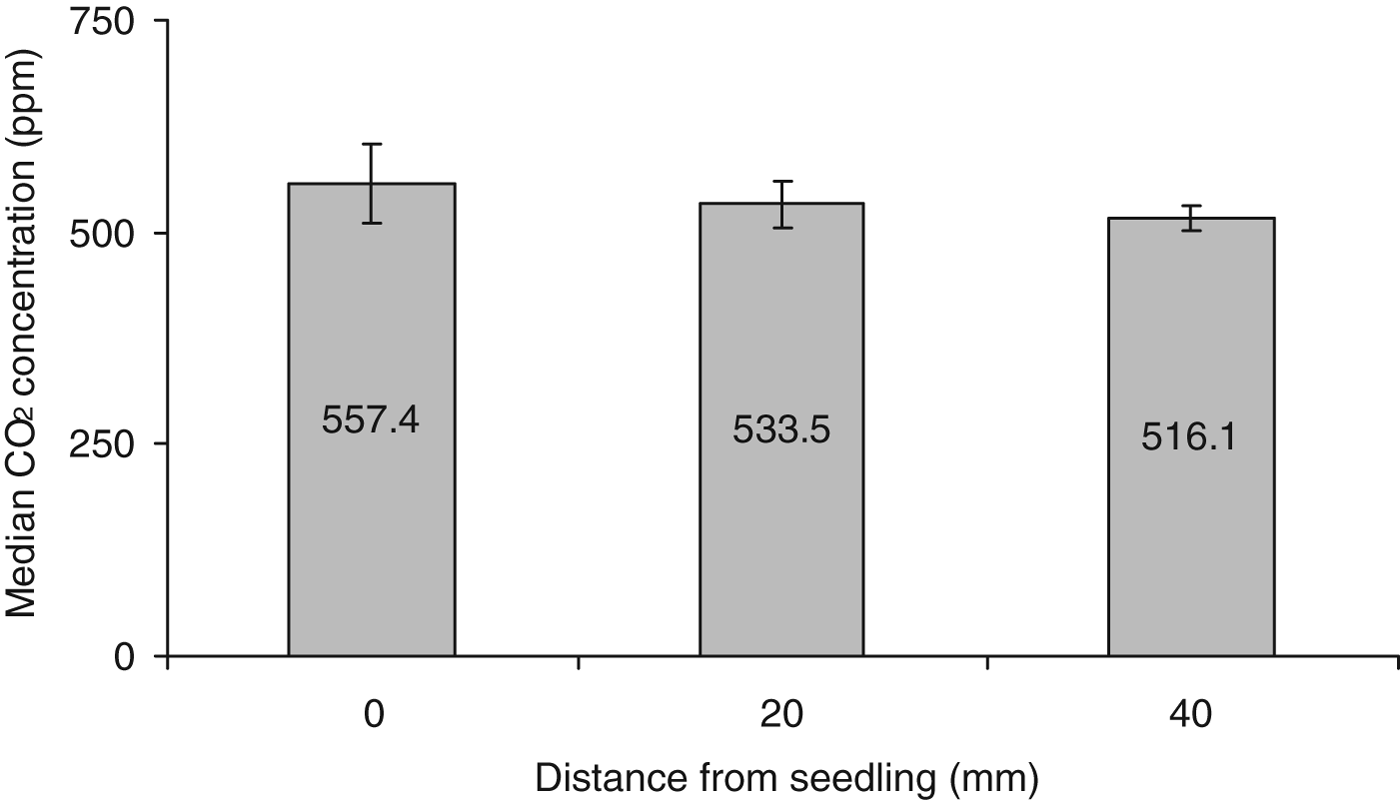
Soil CO2 gradients were assed using GC analysis of gas samples removed at set distances from wheat seedlings, with the hypothesis that CO2 concentration in the soil would increase with proximity to the seedling. The data collected were not normally distributed; therefore a non-parametric Kruskal–Wallis test was used to compare the median CO2 concentrations from the three distance categories sampled (0, 20 and 40 mm) (fig. 8). A trend was noted for a decrease in the concentration of CO2 as the sampling distance increased. However, analysis through the Kruskal–Wallis test reported no significant change in the CO2 concentrations in relation to distance from the seedling: H=2.94, 2 d.f., P=0.229.
Median concentration of CO2 (ppm±95% CI) detected from sampling ports situated at: 0, 20 and 40 mm distances from wheat seedlings, N=8.
Discussion
It was observed that WBF larvae produced more tortuous and longer tracks when exposed to CO2 concentrations of 1000 ppm than when exposed to concentrations of 0 and 380 ppm (atmospheric). A trend was observed for tracks to be longer and more tortuous at CO2 levels above 380 ppm, but these were not always significant at the 1500 and 2000 ppm levels, up until 2500 ppm where track tortuosity and length returned to a similar level to that found under 0 and 380 ppm conditions. When presented with a point source of CO2 WBF larvae did not orientate within 20 mm of the source significantly more frequently than when presented with air containing 0 ppm CO2, indicating that larvae are not attracted to a point source of CO2.
These results suggest that WBF, like many other phytophagous larvae, utilize CO2 to aid in the location of host-plants. As a primary metabolite, CO2 is produced by all plants (Taiz & Zeiger, Reference Taiz and Zeiger2010) and is the most abundant gas released from plant roots (Payne & Gregory, Reference Payne, Gregory and Wild1988). For many less specific polyphagous species locating the nearest host-plant could be a relatively simple undertaking through following CO2 emissions alone. However, monophagous and oligophagous larvae need to be more selective when it comes to locating food sources. Oligophagous larvae such as WBF would be less likely to locate a host-plant by merely following CO2 gradients in the soil, due to there being more CO2 sources in the soil than their host-plant alone; therefore it is unsurprising that attraction to this compound was not observed in this study. Johnson et al. (Reference Johnson, Zhang, Crawford, Gregory, Hix, Jarvis, Murray and Young2006) found that the monophagous weevil S. lepidus also did not show a directional response to CO2, but did observe increased movement tortuosity similar to that which was observed in WBF during this study. This increase in searching behaviour by S. lepidus was noted at a concentration of 1000 ppm CO2, the same concentration as was found to induce the greatest tortuosity and track length in WBF larvae. It was also demonstrated that 1000 ppm was similar to the CO2 concentration found surrounding the roots of the clover host-plant (Johnson et al., Reference Johnson, Zhang, Crawford, Gregory, Hix, Jarvis, Murray and Young2006). When sampling CO2 levels in soil around wheat seedlings in this study, it was noted that there was a trend for higher concentrations of CO2 close to the seedling, which reduced with distance. However, statistical analysis did not show this as significant. The relatively low level of observed CO2 at close proximity to the plant, compared with the Johnson et al. study, could be put down to the lack of a mesh screen in the microcosms, as these limit the spread of the roots, and were used in that and other similar studies (Johnson et al., Reference Johnson, Zhang, Crawford, Gregory, Hix, Jarvis, Murray and Young2006). By limiting the spread of the root system, such screens keep the roots closer to the sampling sites and potentially result in a higher and more consistent soil concentration of CO2. The level of CO2 found near the seedling was less than the lowest concentration found to stimulate the larvae (1000 ppm) and was greater than the highest concentration that did not stimulate the larvae (380 ppm).
Host-plant locations in Diabrotica spp. have been extensively studied, and both hydroxamic acids (Bjostad & Hibbard, Reference Bjostad and Hibbard1992) and CO2 (Jewett & Bjostad, Reference Jewett and Bjostad1996) have been identified as attractive, with CO2 being the primary chemical attractant involved in host-plant location (Bernklau & Bjostad, Reference Bernklau and Bjostad1998). The hypothesis of CO2 being the primary attractant utilized by host-finding larvae is plausible for Diabrotica spp. as adult females oviposit in fields of corn, the larval host-plant (Levine & Oloumi-Sadeghi, Reference Levine and Oloumi-Sadeghi1991). The larvae are more likely to hatch in close proximity to their host-plant, therefore simply orientating along CO2 gradients is more likely to locate them a host-plant. This scenario appears to be too simplistic a method of host-plant location in WBF, given the complex ecology associated with oviposition in this species, resulting from the lack of association between oviposition sites and larval host-plants (Petherbridge, Reference Petherbridge1921).
These results suggest that WBF larvae do not use CO2 gradients to locate host-plants. However, CO2 does induce a behavioural response from the larvae. As CO2 gradients in soil are unstable due to microbial interactions, pore structures and interaction with the atmosphere (Gollany et al., Reference Gollany, Schumacher, Rue and Liu1993; Hanson et al., Reference Hanson, Edwards, Garten and Andrews2000; Sheppard & Lloyd, Reference Sheppard and Lloyd2002), combined with the ubiquitous nature of CO2 emission by plants (Taiz & Zeiger, Reference Taiz and Zeiger2010), it makes host-plant location by this method unlikely for an oligophagous larvae such as WBF. WBF larvae are stimulated by increased CO2 levels in the soil; however, instead of being induced to orientate with respect to the gradient, they are induced to perform searching behaviour, such as an increase in turning as indicated by the increased tortuosity of the track or increased track length. Once induced to search, the larvae would then rely more on family or genus-specific chemicals to locate and identify their host-plant such as the hydroxamic acids DIMBOA (2,4-dihydroxy-7-methoxy-1,4-benzoxazin-3-one) and MBOA (6-methoxybenzoxazolinone), which have been found to be attractive (Rogers, Reference Rogers2011; Rogers & Evans, Reference Rogers and Evans2013).
CO2 has been identified as a target compound for controlling a number of insect species deleterious to human health, mainly to control parasitic dipterans (DeFoliart & Morris, Reference DeFoliart and Morris1967) including Tabanidae (horse flies, Hayakawa, Reference Hayakawa1988), Culicoides impunctatus (Highland midge, Bhasin et al., Reference Bhasin, Mordue and Mordue2001) and Triatoma infestans (kissing bug, Barrozo & Lazzari, Reference Barrozo and Lazzari2004). CO2 baited traps have been proposed to lure and kill mosquitoes (Williams et al., Reference Williams, Long, Russell and Ritchie2006) and Culicoides midges (Nelson, Reference Nelson1965), while the targeting of CO2 receptors with chemical inhibitors and activators to disrupt host-finding behaviour of mosquitoes has also been proposed (Turner et al., Reference Turner, Li, Guda, Githure, Cardé and Ray2011). Attracting larvae or disrupting searching behaviour underground through the creation of CO2 lures and false CO2 gradients has been discussed (Bernklau et al., Reference Bernklau, Fromm and Bjostad2004), although it is both impractical and counter to the current move to curb agricultural output of greenhouse gasses such as CO2. However, the use of chemicals that over stimulate or block the CO2 receptors of larvae could be developed. Work with lepidopteran pests has shown that exposing adult males to high levels of sex pheromone can render the moth incapable of locating female conspecifics (Nansen et al., Reference Nansen, MacDonald, Rogers, Thomas, Poppy and Baxter2007); this can be due to over excitation of the sensory receptors causing sensory fatigue or by competing with natural pheromone plumes (Cardé & Minks, Reference Cardé and Minks1995). The principles behind this ‘mating disruption’ method of control could also be adapted for use to control host-finding phytophagous larvae, by using the chemical inhibitors and activators of CO2 receptors reported by Turner et al. (Reference Turner, Li, Guda, Githure, Cardé and Ray2011) or similar. Through this method, larval host finding could be disrupted, inducing larvae to waste valuable resources by increasing their activity unnecessarily or by preventing them locating host-plants by blocking their perception of CO2 gradients. Larval host finding in WBF is a critical period given the lack of associated host-plant when adults select oviposition sites. Larvae must locate a host-plant rapidly to avoid predation and to avoid death through starvation. If CO2 gradients could be disrupted through the addition of compounds that sequester CO2 or if the perception of these gradients were removed through disruption of larval CO2 receptors, then there would be a greater chance of larval mortality during their vulnerable host finding stage. The study of insect chemical ecology has been investigated for a number of subterranean phytophagous larvae. However, unlike above ground herbivorous insect pests, little has been done to utilize these results within pest management systems.
Acknowledgement
C.D. Rogers was financially supported by a Home Grown Cereals Authority (HGCA) studentship.