Introduction
Farm households in developing countries strive to achieve food security by consuming and then selling surplus household produce (Govereh and Jayne, Reference Govereh and Jayne2003). This is typical of farm households in Ghana who experience issues of food insecurity especially during the dry season. Integrated crop–livestock farming has been identified as an important mechanism to address rural household food insecurity and poverty in developing economies (Herrero et al., Reference Herrero, González-Estrada, Thornton, Quiros, Waithaka, Ruiz and Hoogenboom2007; Food and Agriculture Organization (FAO), 2010). Globally, this type of integrated farming system produces about half the world's food (Herrero et al., Reference Herrero, Thornton, Notenbaert, Wood, Msangi, Freeman, Bossio, Dixon, Peters and Van De Steeg2010). In addition, it reduces the cost of total farm production by exploiting economies of scope (Chavas and Di Falco, Reference Chavas and Di Falco2012). For instance, cost savings of 14% have been identified from joint crop and livestock production rather than producing crops and livestock separately (Wu and Prato, Reference Wu and Prato2006).
In Ghana, crop and livestock production systems are practiced by 90% of smallholders. However, the choices available to farmers are limited by the availability of resources such as land, labor and capital. In recent years, the options for farmers have also been limited by climatic conditions, especially erratic rainfall, drought, high temperatures and floods (Agyemang-Bonsu et al., Reference Agyemang-Bonsu, Kojo, Minia, Dontwi, Dontwi, Buabeng, Baffoe-Bonnie, Agyemang-Yeboah, Buabeng, Ofori, Gyasi, Karikari, Dugan, Nelson, Naa Debei Agbey, Sagoe, Damptey, Tutuah Mensah, Anim-Kwapong and Frimpong2008; Griebenow and Kishore, Reference Griebenow and Kishore2009; Ellis-Jones et al., Reference Ellis-Jones, Larbi, Hoeschle-Zeledon, Dugje, Teli, Buah, Kanton, Kombiok, Kamara and Gyamfi2012). These result in low crop yields and, in extreme cases, crop failure. This has a cascading debilitating effect on livestock production (Ellis-Jones et al., Reference Ellis-Jones, Larbi, Hoeschle-Zeledon, Dugje, Teli, Buah, Kanton, Kombiok, Kamara and Gyamfi2012; Ndamani and Watanabe, Reference Ndamani and Watanabe2015), because pasture and crop residue, which play important roles as livestock feed in most rural settings, become limited. This leaves resource-poor farm households in Ghana suffering from income instability, inadequate food availability and increased poverty.
The relevance of agricultural diversification in reducing production and marketing risks, as well as household income instability and its implications for food security and poverty has long been acknowledged (Ellis, Reference Ellis1998; Little et al., Reference Little, Smith, Cellarius, Coppock and Barrett2001; Joshi et al., Reference Joshi, Gulati, Birthal and Tewari2004; Mainik and Rüschendorf, Reference Mainik and Rüschendorf2010; Yan et al., Reference Yan, Wu, Zhang and Zhou2010; Chavas and Di Falco, Reference Chavas and Di Falco2012; Kim et al., Reference Kim, Chavas, Barham and Foltz2012; Tasie et al., Reference Tasie, Offor and Wilcox2012; Ogundari, Reference Ogundari2013). The key benefits of agricultural diversification can then be classified into three categories: economic, social and agronomic (Johnston et al., Reference Johnston, Vaupel, Kegel and Cadet1995).
Economic benefits include seasonal stabilization of farm income to meet other basic needs such as education, household food security and mitigating risk. Indeed most farms are involved in multi-output diversified enterprises due to the presence of the significant uncertainty that is inherent in agriculture (Lin et al., Reference Lin, Dean and Moore1974; Chavas and Di Falco, Reference Chavas and Di Falco2012). In such cases, agricultural diversification can reduce the risk exposure of farm households by optimizing income from a range of activities that are subject in different ways to varying weather and market conditions. The social benefits include more stable employment for farm workers and resources throughout the year. This can result in sustainable incomes through efficient use of resources and exploitation of comparative advantage, for example, in India (Joshi et al., Reference Joshi, Gulati, Birthal and Tewari2004). Conservation of soil and water resources, reduced disease, weed and insect infestation, reduced erosion, increased soil fertility and increased yields are key determinants among the agronomic benefits of diversification (Caviglia-Harris and Sills, Reference Caviglia-Harris and Sills2005; Iiyama et al., Reference Iiyama, Maitima and Kariuki2007; Mainik and Rüschendorf, Reference Mainik and Rüschendorf2010).
In spite of the significant contribution of agricultural diversification in developing countries in Asia and some parts of Africa in managing production risks, studies on agricultural diversification in Ghana are minimal and have largely focused on incomes and livelihoods (Knudsen, Reference Knudsen2007; Lay and Schüler, Reference Lay and Schüler2008; Aneani et al., Reference Aneani, Anchirinah, Owusu-Ansah and Asamoah2011; Fausat, Reference Fausat2012; Senadza, Reference Senadza2012). With the exception of Aneani et al. (Reference Aneani, Anchirinah, Owusu-Ansah and Asamoah2011) who examined diversification of cocoa production, to our knowledge; there has been no study on diversification in crop production. Diversification studies on livestock are also minimal, particularly in sub-Saharan Africa (Devendra and Ibrahim, Reference Devendra and Ibrahim2004; Ibrahim et al., Reference Ibrahim, Rahman, Envulus and Oyewole2009) and non-existent in Ghana. However, given that crop production is highly correlated with livestock production in sub-Saharan Africa, with nearly 60% of crops produced with livestock, this paper extends the literature on diversification by examining the factors influencing diversification in livestock and integrated crop–livestock production systems among smallholders in Ghana.
Most diversification studies have estimated and examined diversification as a joint decision-making process employing limited dependent variable models such as the logit and probit models and their extensions, as well as the Tobit models (Knudsen, Reference Knudsen2007; Lay and Schüler, Reference Lay and Schüler2008; Aneani et al., Reference Aneani, Anchirinah, Owusu-Ansah and Asamoah2011; Fausat, Reference Fausat2012; Senadza, Reference Senadza2012; Tasie et al., Reference Tasie, Offor and Wilcox2012). The use of such models in examining the determinants of diversification without carrying out the appropriate tests of separability to ascertain whether diversification is indeed a joint decision or separate decisions can lead to conflicting policy recommendations. This is because examining a joint decision instead of distinct diversification decisions does not allow for a full understanding of the factors affecting the entire diversification decision-making process. By exploring the appropriate tests of separability, this paper contributes to the diversification literature by examining both the discrete decision to diversify as well as the continuous decisions concerning the intensity of diversification of crop, livestock and integrated crop–livestock systems among smallholders in Ghana. This will ensure targeted food production policies are made to correspond with the instantaneous decision to diversify as well as the extent of diversification.
The remaining sections of the paper are presented as follows. Section ‘The concept and determinants of agricultural diversification’ presents the definition of the concept of diversification and its determinants. An overview of crop–livestock production systems is presented in the section ‘Overview of crop–livestock systems in Ghana’. The research methodology is presented in the section ‘Methodology’, which includes a description of the study area, the sampling approach, the data obtained, the theoretical framework and the empirical models involved. Section ‘Empirical results’ presents the empirical results and discussion, followed by concluding comments in section ‘Conclusions and policy implications’.
The concept and determinants of agricultural diversification
Agricultural diversification refers to the shift from the dominance of one crop to production of a number of crops on a farm or in a region, to meet the ever increasing demand for food (Petit and Barghouti, Reference Petit and Barghouti1992). In other words, agricultural diversification has meant that the farmers now concentrate on new areas of agriculture, growing alternative crops, rearing new breeds of livestock and adopting a new farming system (Joshi et al., Reference Joshi, Joshi and Birthal2006).
Chaplin (Reference Chaplin2000) and Vyas (Reference Vyas, Mujumdar and Kapila2006) perceived diversification as consisting of three stages. The first stage reflects a cropping system that shifts away from monoculture. The second stage involves the cultivation of more than one enterprise producing a variety of crops to meet the market at different times of the year. The third stage is mixed farming involving a shift of resources from one crop (or livestock) to a larger mix of crops (or livestock) or a mix of crops and livestock. For this reason, Joshi et al. (Reference Joshi, Joshi and Birthal2006) described agricultural diversification as connoting crop mix, enterprise mix and activity mix at the household level aimed at increasing household income and profit. This paper focuses on the second and third stages in diversification, as defined here. Thus, crop diversification refers to the cultivation of two or more crops with the available productive resources. Similarly, livestock diversification is the rearing of two or more livestock types by the farmers given their available resources. Crop–livestock diversification is defined as the production of one or more crops and livestock with the available resources.
The determinants of diversification can largely be classified into demand- and supply-side categories. Specifically, such a classification includes per capita income, urbanization and population growth (Chand, Reference Chand1996; Ryan and Spencer, Reference Ryan and Spencer2001; Smith et al., Reference Smith, Gordon, Meadows and Zwick2001; Joshi et al., Reference Joshi, Gulati and Cummings2007), on the demand-side, whereas, on the supply-side, there are farm-level factors, household-level factors, biophysical factors, risk factors, infrastructure or institutions, technology and resource endowments. The characteristics of the decision-making households are largely determined by household-level factors such as age, gender, education, household dependency ratio, capital and off-farm income activities (Guvele, Reference Guvele2001; Shezongo, Reference Shezongo2005; Birthal et al., Reference Birthal, Joshi, Roy and Thorat2007; Van den Berg et al., Reference Van den Berg, Hengsdijk, Wolf, Van Ittersum, Guanghuo and Roetter2007; Ashfaq et al., Reference Ashfaq, Hassan, Naseer, Baig and Asma2008; Rahman, Reference Rahman2008; Ibrahim et al., Reference Ibrahim, Rahman, Envulus and Oyewole2009; Abro, Reference Abro2012; Tasie et al., Reference Tasie, Offor and Wilcox2012; Sichoongwe et al., Reference Sichoongwe, Mapemba, Ng'ong'ola and Tembo2014).
Relevant farm-level factors include the number of crops cultivated and the livestock managed by farm households, the total land area cultivated, total value of outputs, types of crops cultivated, hired and family labor, use of complementary technologies and quantity of fertilizer used (Weiss and Briglauer, Reference Weiss and Briglauer2000; Benin et al., Reference Benin, Smale, Pender, Gebremedhin and Ehui2004; Rahman, Reference Rahman2008; De and Chattopadhyay, Reference De and Chattopadhyay2010; Dzanku and Sarpong, Reference Dzanku, Sarpong, Djurfeldt, Aryeetey and Isinika2010; Mesfin et al., Reference Mesfin, Fufa and Haji2011; Senadza, Reference Senadza2012; Sichoongwe et al., Reference Sichoongwe, Mapemba, Ng'ong'ola and Tembo2014). Diversification is also influenced by farmers’ access to markets, distance to markets, access to extension, access to credit, membership of associations and proximity to research and extension institutions and availability of advice (Chand, Reference Chand1996; Smith et al., Reference Smith, Gordon, Meadows and Zwick2001; Estache, Reference Estache2003; Joshi et al., Reference Joshi, Gulati and Cummings2007; Kankwamba et al., Reference Kankwamba, Mapila and Pauw2012).
Several techniques have been employed to explain specialization or diversification of commodities or activities in a given time and space by a single indicator with unique strengths and weaknesses. Common among these are: the index of maximum proportion, the Herfindahl index (HI) and its related transformations, Simpson's index, the Ogive index and the Entropy index and its associated modifications (Kelley et al., Reference Kelley, Ryan and Patel1995; Chand, Reference Chand1996; Pandey and Sharma, Reference Pandey and Sharma1996; Joshi et al., Reference Joshi, Joshi and Birthal2006). However, among these techniques, the Simpson index of diversity, the HI and the Ogive index have been widely employed in estimating agricultural diversification (Mekhora and Fleming, Reference Mekhora and Fleming2004; Joshi et al., Reference Joshi, Joshi and Birthal2006; Ashfaq et al., Reference Ashfaq, Hassan, Naseer, Baig and Asma2008; Ibrahim et al., Reference Ibrahim, Rahman, Envulus and Oyewole2009; Fausat, Reference Fausat2012; Ogundari, Reference Ogundari2013). Simpson's index of diversity is an area-based index and measures horizontal diversification in terms of the proportionate areas allocated to different enterprises. This is appropriate and works well when estimating crop diversification. Both the HI and the Ogive index measure diversification in terms of revenue; hence, they are suitable for estimating diversification among livestock and integrated crop–livestock systems. However, for purposes of comparison and standardization, this study employs the HI to estimate all three variants, namely, diversification among crop, livestock and crop–livestock diversification systems. Unlike the Ogive index, the HI is straightforward to interpret and lies between one (for complete specialization) and zero (for complete diversification). In addition, this index has been widely applied in measuring agricultural diversification or specialization in the economic literature, thus, enabling us to relate our results with the findings of other studies. To estimate the determinants of diversification for cross-sectional data, a number of techniques have been applied. Least-squares multiple regression models are appropriate for estimating the determinants of diversification in situations where diversification is complete within the population (Joshi et al., Reference Joshi, Joshi and Birthal2006), and has been extensively employed (Ergano et al., Reference Ergano, Mehta and Dixit2000; Ashfaq et al., Reference Ashfaq, Hassan, Naseer, Baig and Asma2008; Fausat, Reference Fausat2012; Senadza, Reference Senadza2012). However, in situations where diversification is not universal, ordinary least-squares estimates are inconsistent; hence, inferences from such results may be misleading (Wan and Hu, Reference Wan and Hu2012).
The use of the Tobit model provides estimates of joint determinants of both discrete and continuous diversification decisions (Waithaka et al., Reference Waithaka, Thornton, Shepherd and Ndiwa2007; Keelan et al., Reference Keelan, Henchion and Newman2009; Wan and Hu, Reference Wan and Hu2012). Hence, using both the probit and Tobit regression models to estimate the determinants of the probability and the extent of diversification separately, may lead to confounding policy implications. This is because, the Tobit model jointly estimates the determinants of the probability and the intensity of diversification, thus resulting in double counting the probability of diversification (Waithaka et al., Reference Waithaka, Thornton, Shepherd and Ndiwa2007). Furthermore, the Tobit model assumes that the two decisions are made jointly. However, this assumption has been criticized that it may not always be reasonable because the discrete and continuous diversification decisions could be made at different stages and are likely to be influenced by different factors (Lin and Schmidt, Reference Lin and Schmidt1984). Consequently, two-step models, the Heckman selectivity model and the Cragg model have been proposed to account for this potential problem (Mal et al., Reference Mal, Anik, Bauer and Schmitz2012; Yirga and Hassan, Reference Yirga and Hassan2013). The Heckman model addresses selectivity bias and also requires the use of different sets of variables in each specification (Heckman, Reference Heckman1979). In contrast, with the Cragg model, the same set of variables can be used in both stages and assumes their effects on the two decisions are different (Cragg, Reference Cragg1971). Given that this is so, the decision to diversify may be preliminary to the decision on the extent to which farmers diversify. There is the need to examine whether the two decisions are joint or separate. Where the decision is jointly made the Tobit model can be used to estimate the determinants of diversification. However, where the decisions are made separately, then, the extent of diversification may be characterized by selectivity bias. This paper conducts the separability and selectivity tests in diversification decisions. Where seperability is confirmed, an additional test is conducted to examine whether the two decisions are independent of each other.
This paper assumes that the same sets of variables can affect the discrete decision to diversify and the continuous diversification decisions but affect them differently. In addition, preliminary analyses with the Heckman models revealed insignificant Mill's ratios. This has two implications: first, it indicates that selection bias is not significant in the sample; secondly, it suggests that different factors can influence the discrete decision to diversify and the continuous diversification decisions (Waithaka et al., Reference Waithaka, Thornton, Shepherd and Ndiwa2007). For instance, crop–livestock farmers will decide to diversify without considering how much additional crop or livestock they intend to cultivate. Consequently, the two models can be estimated separately, thus, the use of the Cragg two-step model is appropriate for estimating the determinants of crop–livestock diversification.
Overview of crop–livestock systems in Ghana
Integrated crop–livestock systems include the production of various crops and livestock types in a mixed farming system (FAO, 2010). In Ghana, there are some complementarities in this system. For instance, crop residues are mainly used as livestock feed, especially during the dry season. Predominantly, in areas where dryness is characterized by patches of intermittent bushfires, the use of crop residues plays a critical role in livestock production. Likewise, manure is used as fertilizer on most arable land in Ghana. Manure is collected and plowed into the soil during land preparation.
In Ghana, the major crops integrated with livestock are cowpea, groundnut, soybean, rice, millet, sorghum and maize. Major livestock types in this system are cattle, sheep, goats, pigs and poultry (Karbo and Agyare, Reference Karbo and Agyare2002). These livestock types are commonly managed in this system for various purposes. For instance, beef is a very common household meat, while goats, sheep and poultry are highly marketable and can readily be converted into cash to support household needs; hence, they are in relatively high demand. This demand is compounded during festive occasions because these animals are used for sociocultural purposes during festivals and other traditional events. However, the proportions of different livestock kept depend on the priorities of the farm households and their ability to manage them given their available resources.
A typical crop–livestock farmer in Ghana will keep at least sheep, goats or cattle, or some combination of these, in addition to the cultivation of crops such as cowpea, groundnut, maize, millet and sorghum. The prime purpose of cultivating these crops is not to be used as feed for the animals, but, after harvesting, the crop residues are fed to the livestock. In this paper, an integrated crop–livestock system refers to a combination of any of the crops and livestock described in the previous paragraph on the same land in a given farming season.
Methodology
To examine the determinants of diversification in crop, livestock and crop–livestock systems, first indicators of diversification were computed by the Herfindah index following Pal and Kar (Reference Pal and Kar2012). Next the determinants of diversification were examined using the Cragg two-step model (Cragg, Reference Cragg1971). In the first step, the discrete decision to diversify was analyzed using the probit model. This was followed by an analysis of the extent of diversification among the diversified subsample using a truncated regression model.
Data and sampling technique
The data for this paper were collected from smallholder crop–livestock producing households in the Atebubu-Amantin (A-A) and Ejura-Sekyedumase (E-S) districts of the forest–savannah transition agroecological zone of Ghana. Multi-stage sampling was adopted to select respondents for the study. In the first stage, the forest–savannah transition agroecological zone was purposively selected for the study. The A-A and E-S districts were also selected purposively. These districts were selected on the basis of their high livestock density, the potential for integration of crop–livestock systems, market access, high poverty index and their proximity to existing good livestock-practice centers. In addition, a significant proportion of crops and livestock are produced in these districts (Ministry of Food and Agriculture, 2010). From each district, 12 communities were randomly selected. For each community, a minimum of 25 households were randomly selected from a list of crop–livestock producing households in the communities, a total of 608 farm households were interviewed.
The data were collected using structured questionnaires. The data collected included information on the crops and livestock managed, socio-economic factors, farm-level factors, institutional factors, and crop–livestock integration-related activities carried out by the farmers. Crop–livestock farmers were considered because, naturally, farmers in this system tend to diversify by producing two or more crops and/or livestock in a given cropping season. Subsequently, examining the determinants of their decision to diversify as well as the extent is essential.
Theoretical framework
The decision to diversify is centered on the theory of diversification, the basic assumption of which is rooted in the utility maximization theory (Rahm and Huffman, Reference Rahm and Huffman1984). Thus, the latent utility of the ith farmer for the jth diversification process is denoted by U ji , where j = 0 or 1 if the ith farmer is ‘not diversified’ or ‘diversified’, respectively. We assume that the utility obtained from diversification depends on a vector of farm- and farmer-specific attributes, G i , and a vector of the attributes associated with diversification, K i , for the ith farmer.
Although the utility is a latent variable, we assume that it is a linear function of the vector of observed farm-level, farmer-related, diversification-related characteristics, institutional factors, and a random error with zero mean, as follows:
 $$U_{\,ji} = X_i {\rm \alpha} _j + e_{\,ji}, \,\,j = 0,\,1;\,\,{\rm and}\,\,\,i = 1,\,2,\,...,\,n$$
where X i is a (1 × k) vector of values of relevant variables to describe the utility for the ith farmer.
Given that the utilities, U
ji
, are random, the alternative j = 1 will only be selected by the ith farmer if U
1i
> U
0i
or if the unobservable (latent) random variable,
 $d_i^{\ast} = U_{1i} - U_{0i} $
, is positive. The probability that the ith farmer practices diversification, denoted by d
i
= 1, is a function of the explanatory variables and is expressed as:
 $$ \eqalign{P_i &= P(d_i = 1) = P(U_{1i} \gt U_{0i} ) \cr &= P(X_i {\rm \alpha} _1 + e_{1i} \gt X_i {\rm \alpha} _0 + e_{0i} ) = P(\mu _i \lt X_i {\rm \beta} ) \cr &= F(X_i {\rm \beta} )} $$
where μ i = e 0i − e 1i ; β = (α 1 − α 0); and F(.) denotes the distribution function for μ i .
Specification of the empirical model
The HI is employed to compute the crop diversification index (CDI), the livestock diversification index (LDI) and the crop–livestock diversification index (CLDI). These indices are obtained by subtracting the estimated HI from one. Accordingly, the indices have direct relationships with diversification and make the interpretation of the empirical results straightforward, such that a zero value indicates specialization and a value greater than zero signifies some measure of diversification. For standardization, the revenues (which are influenced by quantities produced, quantities sold, prices, the weather and transaction costs) from each crop or livestock enterprise were used to compute the HI.
To compute the HI, we first calculate the revenue shares of the crops and/or livestock involved in the total crop and/or livestock revenue for each sample farmer. The revenue share is expressed as:
 $$S_k = {\textstyle{{R_k} \over {\sum\nolimits_{k = 1}^n {R_k}}}} $$
where S
k
denotes the revenue share occupied by the kth crop or livestock in the total revenue for a farm's crops, the livestock and/or the crop–livestock enterprises, respectively; R
k
denotes the revenue from the kth crop or livestock enterprise for a sample farmer;
 $\sum\nolimits_{i = 1}^n {R_k} $
denotes the total farm revenue for the crops, the livestock and/or the crop–livestock enterprises, respectively; k = 1, 2,…, n (number of enterprises involved in all farmers’ farming operations)
The Herfindahl index is specified as:
 $$HI = \sum\limits_{k = 1}^n {S_k^2} $$
which ranges from zero to one. The value of one indicates complete specialization (i.e., just one enterprise). For a high level of diversification, the value of the HI is likely to be small. For the special case of equal revenue shares among a total of n enterprises for a sample farmer, the values of the revenue shares would be equal to 1/n and the value of the HI would also be 1/n.
The HI is computed for crops (HI C ), livestock (HI L ) and crop–livestock (HI CL ) farming systems. It follows that CDI, LDI and CLDI are then obtained as:
 $$\eqalign{{\rm CDI} &= 1 - HI_C ;\,{\rm LDI} = 1 - HI_L ;\,{\rm and}\,{\rm CLDI} \cr &= 1 - HI_{CL}}$$
The sample farmers in this study consisted of those who diversified (Farmers are said to be diversified in crops, livestock and integrated crop–livestock farming systems when they obtain a CDI, LDI and CLDI >0.5, respectively) and those who did not. Let d i denote the discrete decision to diversify such that d i = 1 for farmers who diversified and d i = 0 for non-diversified farmers. Subsequently, the extent of diversification in each category is therefore denoted by the respective indices calculated by equation (5). We assume in this paper that the two decisions were made in different stages and that the same factors had different effects on the two decisions. Consequently, the latter assumption is supported by the Cragg two-step regression model (Cragg, Reference Cragg1971) and has been used to explain why some crop–livestock farmers diversified and others did not as well as the observed differences in the extent of diversification in crop, livestock and crop–livestock enterprises.
Following Belotti et al. (Reference Belotti, Deb, Manning and Norton2012), the first step of the Cragg model involves the estimation of a probit regression model for the discrete diversification decisions. Following equation (2) above, the probability that a farmer is diversified is represented by the cumulative distribution function of F for μ i evaluated at X i β. Assuming that the μ i s are independently and identically distributed as standard normal random variables, we estimate the probability of diversifying using the probit model.
The second stage of the model involves the specification and estimation of the extent of diversification once the decision to diversify is made by the ith farmer. This model is defined by equation (6), which is a truncated regression model where the ε i s are assumed to be independent and identically distributed normal random errors with mean zero and variance, σ2, as follows:
 $$D_i \vert d_i^{^\ast} \gt X_{2i} {\rm \beta} + {\rm \varepsilon} _i \gt L$$
where D
i
is the random variable that defines diversifying (estimated by the diversification indices);
 $d_i^* $
is an unobservable latent variable; L is an unobservable threshold value (For this study, L represents diversification status, i.e. diversified or not); and X
2i
is the vector of values of independent variables that is used to explain the extent of diversification. These independent variables are denoted with the subscript 2 to differentiate them from the independent variables used to determine the first stage of the estimation (the discrete diversification decision). Although some sets of explanatory variables can be common in the two models they are expected to have separate and different effects on the discrete and continuous diversification decisions. Equation (6) is solved by maximizing the log-likelihood function using the maximum-likelihood estimator.
To substantiate the use of the two-step model, a joint decision test was conducted using the likelihood ratio test. This test involves the estimation of diversification with the probit model, the truncated model, and the Tobit model separately (Mal et al., Reference Mal, Anik, Bauer and Schmitz2012). Following Katchova and Miranda (Reference Katchova and Miranda2004), the log-likelihood values of the models were then used to compute the likelihood ratio test statistic, λ, as follows:
 $${\rm \lambda} = - 2(LL_{{\rm Probit}} + LL_{{\rm Truncated}} - LL_{{\rm Tobit}} )$$
where
 $LL_{\Pr {\rm obit}} $
, LL
Truncated and LL
Tobit denote the log-likelihood functions of the probit, truncated, and Tobit regression models, respectively, for each diversification category. The estimated λ should be greater than the χ2 critical value to justify the use of the Cragg two-step model (Katchova and Miranda, Reference Katchova and Miranda2004; Mal et al., Reference Mal, Anik, Bauer and Schmitz2012).
Description of variables
To estimate the parameters of the models of equations (2) and (6) for the two decisions above, a set of explanatory variables is considered. These variables were selected based on empirical studies and the available database and are expected to influence the two decisions. The proceeding paragraphs discuss the nature of these variables and our expectations on their effects. Age of household heads is a proxy for experience in agriculture and is a major determinant in household production decisions. Given that older farmers are more likely to have access to production resources and information, they are more likely to diversify. On the other hand, younger farmers are more inclined to perceive and carry out farming as a business and a source of livelihood (FAO, 2010); thus, they are more likely to diversify to reap the benefits that come with it than older farmers who, in most instances, perceive farming as a hobby or way of life. Thus, the age variable may have either a negative or positive influence on diversification because it has had non-harmonious effects in the literature (Ashfaq et al., Reference Ashfaq, Hassan, Naseer, Baig and Asma2008; Sichoongwe et al., Reference Sichoongwe, Mapemba, Ng'ong'ola and Tembo2014).
Minimal variations have existed in the effect of gender on diversification. It depends largely on the gender dominance of the household heads in the respective society and the influence of household heads in production decision-making. Subsequently, the decision to diversify is a matter of both choice and access to available resources (Sichoongwe et al., Reference Sichoongwe, Mapemba, Ng'ong'ola and Tembo2014). Like the northern part of the country, the forest–savannah transition agroecological zone is dominated by male household heads (Etwire et al., Reference Etwire, Dogbe and Nutsugah2013) who are expected to have a positive influence on the decision to diversify.
The dependency ratio, which is the ratio of the number of active persons in the household to the number of dependants in the household, is used to represent household size and may have a mixed effect on the extent of diversification. Households with larger proportions of dependants are likely to diversify to be able to ensure stable provision of household needs, especially in terms of increasing production and diet (Benin et al., Reference Benin, Smale, Pender, Gebremedhin and Ehui2004). On the other hand, households with higher dependency ratio may not diversify due to inadequate household labor and other inputs needed to implement diversified farming options.
Education, introduced as a dummy variable indicating farmers who had formal education, has been found to have positive effects between education and diversification (Rahman, Reference Rahman2008; Ibrahim et al., Reference Ibrahim, Rahman, Envulus and Oyewole2009). Educated people are likely to be better informed about alternative crops and/or livestock adaptable to existing production conditions. In addition, educated farmers are more able to identify and explore the potentials for different sources of incomes (Ghafoor et al., Reference Ghafoor, Hussain, Naseer, Ishaque and Baloch2010) from diversifying, thus are likely to have a positive influence on diversification decisions.
Off-farm income could provide farmers with additional funds for supporting production activities, but higher incomes from off-farm activities could affect the interest of the farmer and lead to diversion of resources away from farming (Rahman, Reference Rahman2008); hence, access to off-farm income may influence diversification either positively or negatively.
Institutional variables included in the model include distance to markets, access to credit, and access to market information, access to extension and good road network. Except for distance to markets, all the other variables are expected to have a positive influence on diversification. For instance, with access to timely credit, farmers are able to produce additional crops and/or livestock because they are able to purchase inputs and other resources needed for production. Also, a more accessible road network is likely to have positive effects on diversification. Better market and road networks reduce the transaction or marketing costs, enhancing easy and rapid disposal of produce. Subsequently, the risks of possible post-harvest losses are reduced, particularly for perishables (Joshi et al., Reference Joshi, Gulati, Birthal and Tewari2004).
Distance to market is a proxy for physical access to markets and proximity to economic resources. Farmers closer to markets tend to diversify to meet the changing market demand for various produce/products at different times of the year. Proximity to main roads and markets has also been found to increase the development of other farm enterprises (Benin et al., Reference Benin, Smale, Pender, Gebremedhin and Ehui2004). In addition, these variables technically affect the efficiency of the supply chain and, thus, may encourage farmers to diversify. On the other hand, it is possible that farmers at greater distances from markets or main roads diversify to meet their broad subsistence and nutritional needs (Kankwamba et al., Reference Kankwamba, Mapila and Pauw2012). Thus, distance to market is likely to have mixed effects on diversification.
The effects of dummy variables that represent access to extension services and access to market information were also examined in the models. These variables typically represent sources of information as well as allied improved technologies for producing additional crops and/or livestock, and could lead to increase the probability and extent of diversification (Ibrahim et al., Reference Ibrahim, Rahman, Envulus and Oyewole2009).
To explore the effect of farm-level factors on diversification, additional variables such as the use of plows, and quantity of fertilizer used as well as access to the fertilizer subsidy were included in the models. The use of plows for cultivation and the quantity of fertilizer used are expected to enhance diversification (De and Chattopadhyay, Reference De and Chattopadhyay2010; Mesfin et al., Reference Mesfin, Fufa and Haji2011). Also included in the models is a dummy variable to indicate the ownership of land, which is likely to have a positive influence on diversification. Farmers with limited access to land have less flexibility to allocate portions to various production activities including pasture and other livestock management practices.
To examine the role of crop–livestock integration in diversification, dummy variables to indicate the storage and feeding of crop residue are also included in the model. These variables are likely to have positive influences on both decisions. The total value of farm assets is used as a proxy for productive capital. This variable represents the value of all tools and implements used directly for the agricultural production processes, including the value of owned livestock resources. Access to farm assets is expected to empower farmers to produce different crops and/or livestock which may require specialized tools and inputs (Rahman, Reference Rahman2008); thus, they are likely to positively influence diversification decisions.
Empirical results
Summary statistics of variables
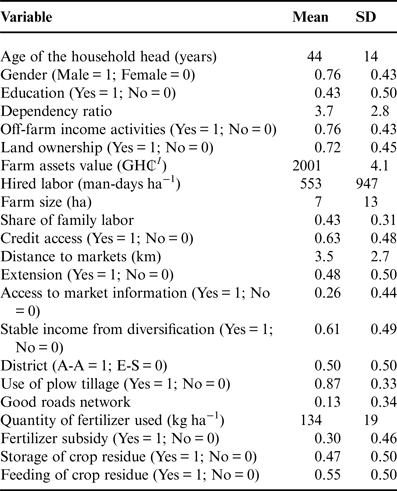
Table 1 presents the basic summary statistics of the variables for the sample households involved in the study. The age of household heads averaged about 44 years. Typically, the dependency ratio of farm households had an average of about 3.7 with higher percentage of male heads (76%) and 43% of heads having access to formal education. Almost 80% of the farmers were engaged in off-farm income-generating activities. Incomes from such activities are expected to be plowed back into farm production activities. Farm assets were valued on average at GH₵2,001.
Summary statistics for the explanatory variables.

1 US$1 = GH₵3.924 (Ghanaian currency) or GH₵1 = US$0.255. (13/03/2016).
The average hired labor was about 553 man-days ha−1, whereas family labor constituted about 43%, on average, of the total labor used in production. The average total land holding was 6.8 ha, in which 72% of households owned the land used in cultivation. The use of tillage equipment (87%) was predominant among the sample farmers. Credit and extension services were accessed by 63 and 48% of the sampled households, respectively.
On average, farmers travel about 3.5 km to the nearest input and output markets. Crop–livestock integration-related variables such as the storage and feeding of crop residue were practiced by about 47 and 55% of the farmers, respectively. However, only 26% of households had access to market information. Household income stability was the major motivation for diversification among sample farmers (61%). The average quantity of fertilizer used by the sample farmers was slightly <134 kg ha−1, with nearly 30% of households having access to subsidized fertilizer. About 13% of the farmers had access to good road networks.
Distributions of diversification indices
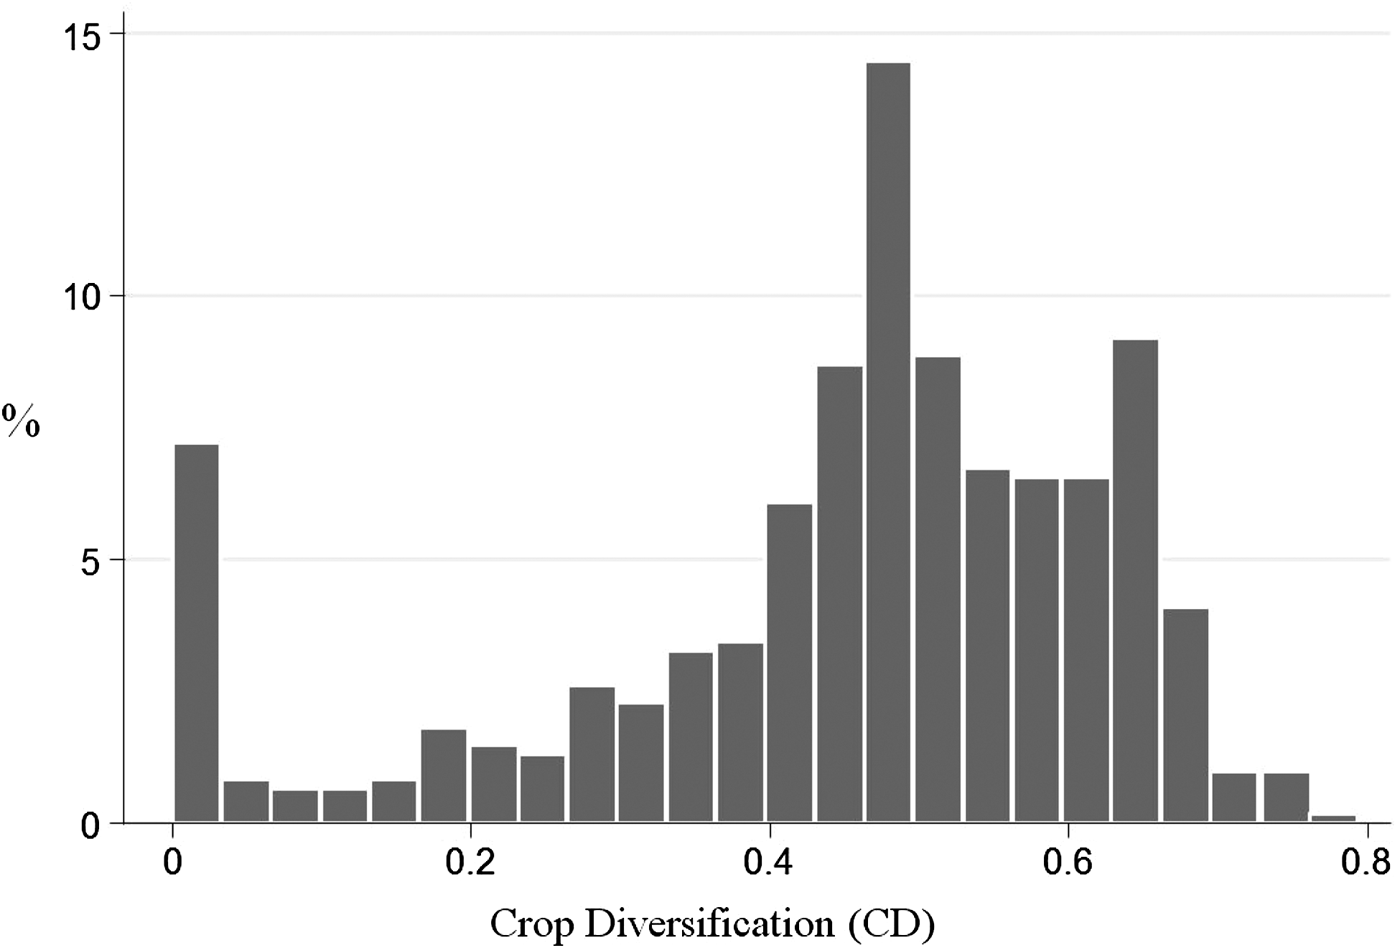
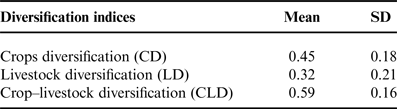
The average of the crop diversification index was 0.45, as shown in Table 2. Figure 1 shows that the crop diversification index is reasonably symmetrically distributed. The majority of the farmers had values above 0.5, indicating that most of the farmers were diversified in their cropping activities. About 7% of the farmers were specialized producers growing a single crop only. The suitability of the land and other available resources to the production of specific crops or the high returns from such crops could possibly account for this finding. This result is consistent with the findings of Ogundari (Reference Ogundari2013) in a study of crop diversification of peasant farmers in Nigeria.
Distribution of the crop diversification (CD) index.

Summary statistics for the crops, livestock and integrated crop–livestock diversification indices.

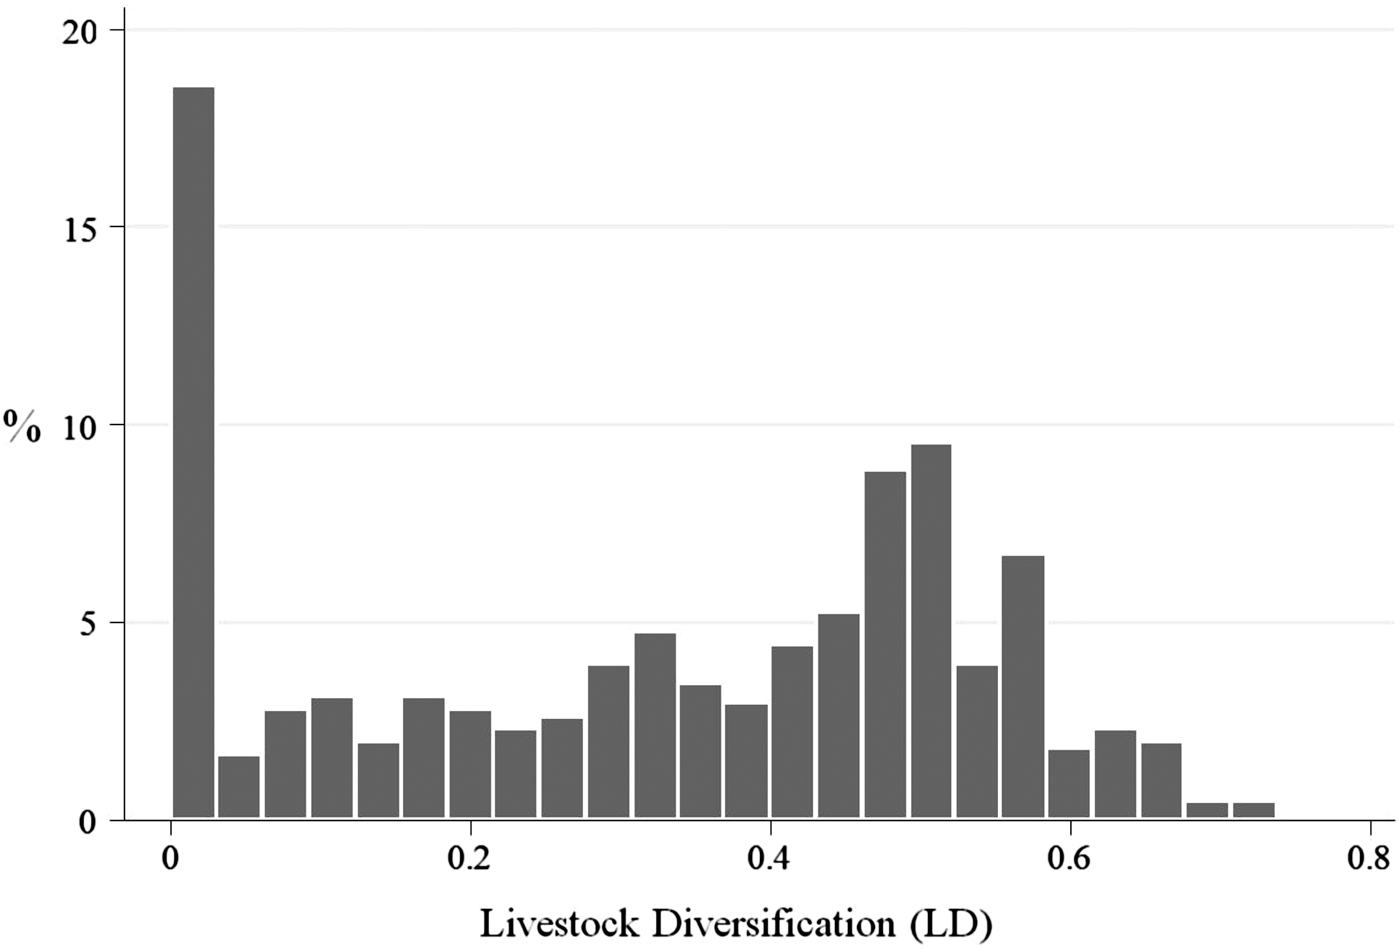
Similar distributions were obtained for the livestock diversification indices (Fig. 2) with an average of 0.32, as presented in Table 2. This shows that livestock diversification is relatively low and more widely dispersed. Generally, there was minimal variation in the number of livestock managed by farm households in the forest–savannah transition agroecological zone, and this could account for this distribution. Almost 18% of the farmers did not diversify their livestock production (Fig. 2).
Distribution of the livestock diversification (LD) index.

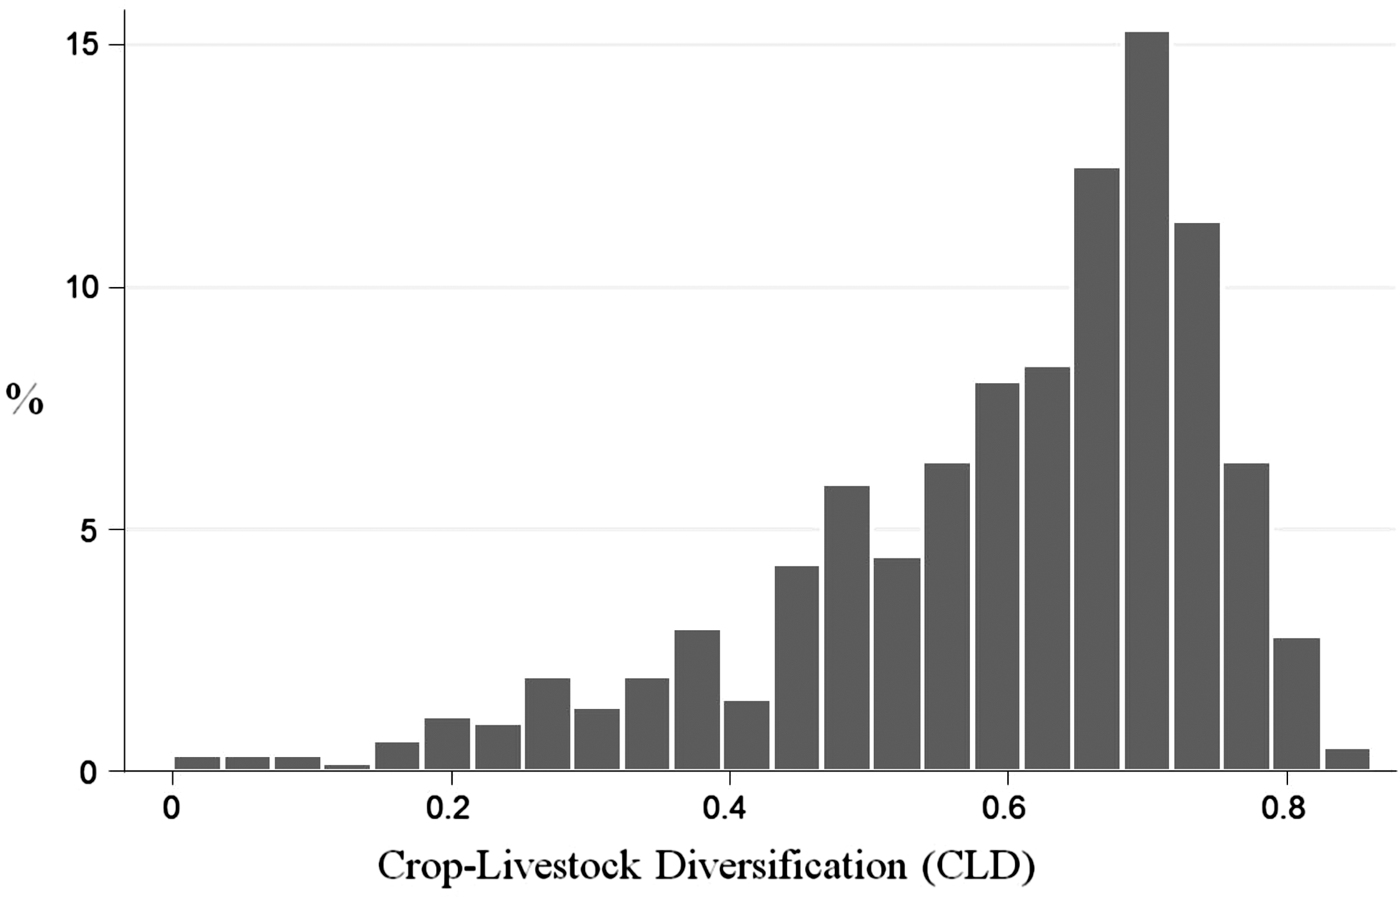
The distribution of values of the crop–livestock diversification index for the sample farmers is shown in Fig. 3. The average crop–livestock diversification index was 0.59 with standard deviation of 0.16 (Table 2). The figure depicts a negatively skewed distribution of the index. However, with about 76% of the households having indices above 0.5, the distribution suggests a high level of crop–livestock diversification among the farm households. The distributions furthermore show that the crop–livestock diversification index is greater than the indices for crop diversification and livestock diversification. Subsequently, this highlights the significance of intensification of integrated crop–livestock systems among these farm households in rural Ghana. Given the diverse nature of the distributions of the diversification indices for crop, livestock and crop–livestock, it is worth investigating the factors influencing these distributions. The following section presents a discussion on the determinants of diversification in terms of crop, livestock and crop–livestock systems.
Distribution of the crop–livestock diversification (CLD) index.

Determinants of diversification
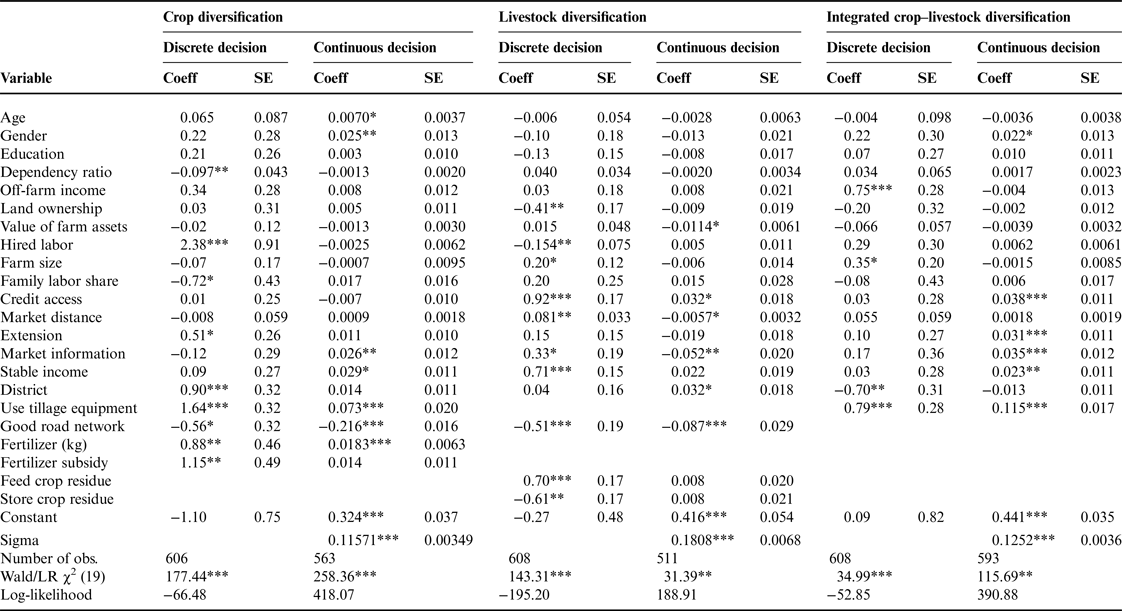
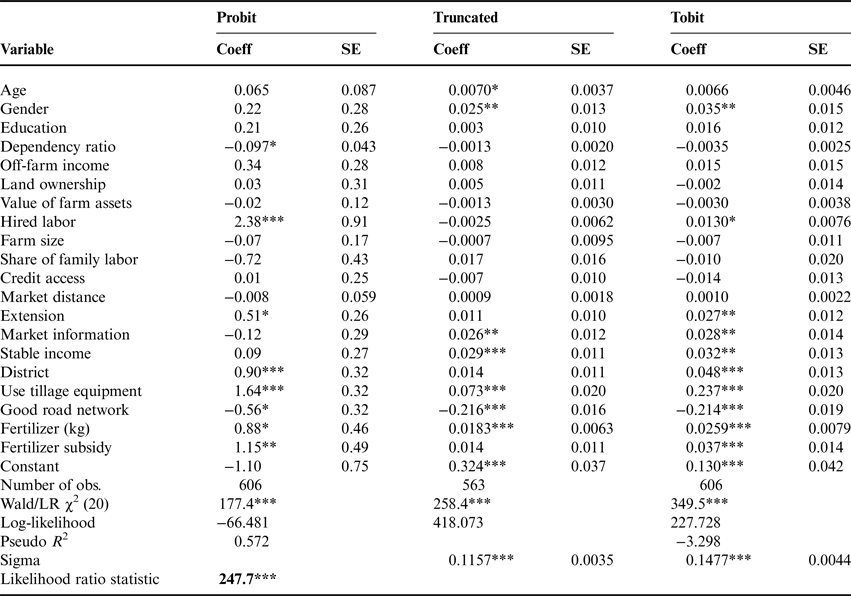
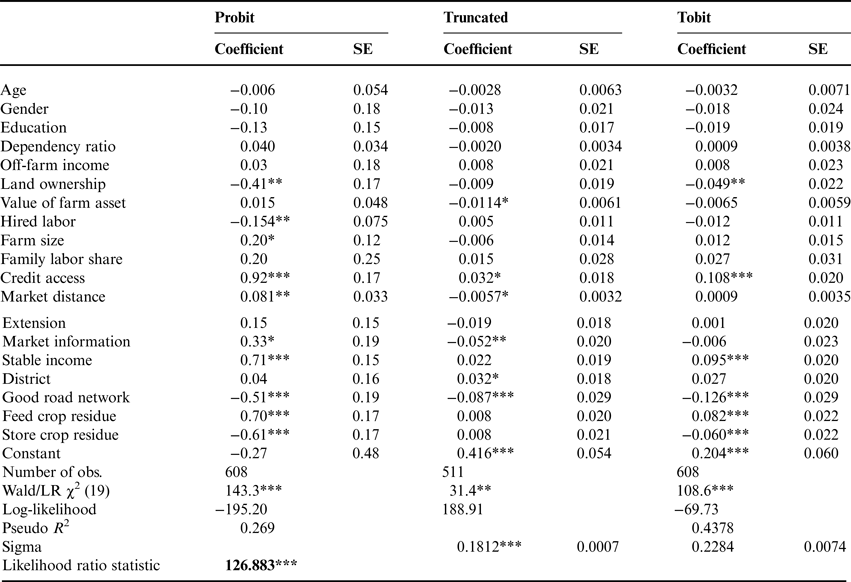
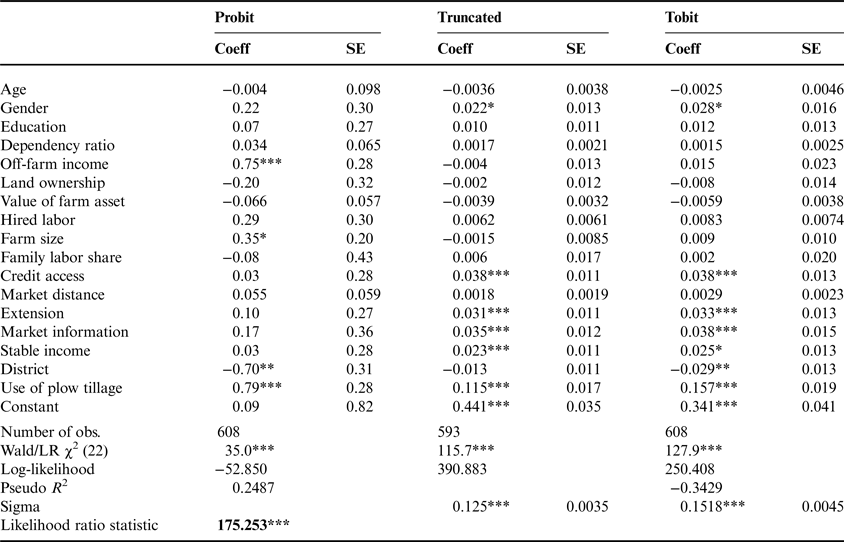
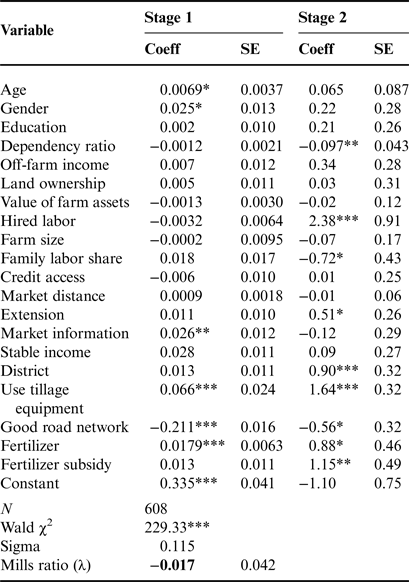
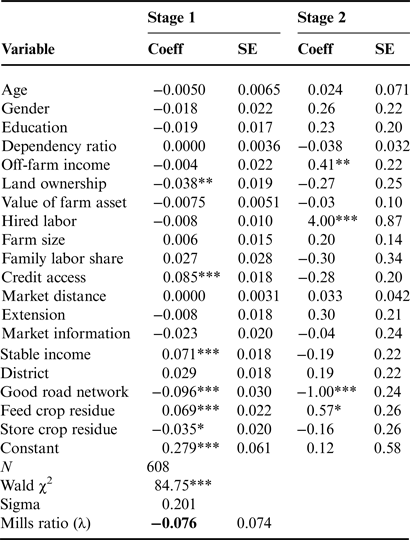
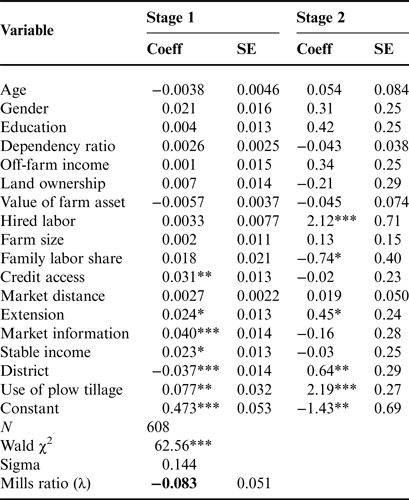
The likelihood ratio tests indicate that the decision to diversify and the extent of diversification occurred in two stages (see Tables 1a, 1b and 1c in Appendix 1), hence, we use of the two-step model. Although the probit and truncated models contain the same parameters, the insignificant Mill's ratios from the Heckman models (Appendix 2), suggests that the independence assumption is satisfied, subsequently, the two decisions are independent. It implies that the continuous decision of how many crop and livestock enterprises farmers decide to adopt, does not depend on the discrete decision to diversify. The two models can be estimated separately and independently. This was evident in the results; for instance, the factors that influenced the two decisions were found not the same. Also, a given factor may be significant in the discrete decision and not significant in the continuous decision or the reverse. The estimates of the parameters of the Cragg two-step model for discrete and continuous decisions of the determinants of diversification for the three types of agricultural enterprises are presented in Table 3. The numbers of observations in Table 3 are less for the crop and livestock systems because some of the farmers were either specialized in crops or livestock production, hence, data for their activities in the other groups were not available. The results show that the discrete and continuous decisions were affected by different factors.
Determinants of diversification in the crop, livestock and crop–livestock systems.

The asterisks, *, ** and ***, denote significance at the 10, 5 and 1% levels, respectively.
For crop diversification, both types of decisions were influenced by the use of tillage equipment, the quantity of fertilizer used and access to good road networks. Unlike access to good road networks, the two other variables stated above had positive effects on crop diversification. Other factors such as the fertilizer subsidy, extension and hired labor positively influenced the discrete decision, whereas negative effects were found with share of family labor and dependency ratio. Also, the continuous crop diversification decision was positively influenced by age, gender and access to market information (Table 3).
Likewise, for livestock diversification, both decisions were influenced by access to credit, market distance, market information and access to good road networks. However, differences existed in the way they influenced the two decisions. A typical example is access to market information and market distance; these both had positive effects on the discrete decisions but negative effects on the continuous decision on livestock diversification. While access to credit had positive effects on both decisions, negative effects were found with access to good road networks.
Also, the discrete decision was negatively influenced by land ownership, hired labor, and the storage of crop residue, but positively influenced by feeding of crop residue, stable income and farm size. The value of farm assets had negative effects on the continuous livestock-diversification decision.
For crop–livestock diversification, both decisions were positively influenced by the use of tillage equipment. However, other factors did influence the two decisions differently. For instance, off-farm income and farm size influenced only the discrete decision to diversify positively. The continuous decision was positively influenced by gender, access to credit, extension, access to market information and the perception of obtaining stable incomes from diversifying.
Discussion and implications
Diversification and household decision-making processes
The estimated diversification indices of 0.45, 0.32 and 0.59 for crop, livestock and integrated crop–livestock enterprises, respectively, suggest that farm diversification is significant among smallholders in Ghana. However, these indices are low compared with that obtained in a recent study by Aneani et al. (Reference Aneani, Anchirinah, Owusu-Ansah and Asamoah2011) which studied the extent and determinants of crop diversification among cocoa farmers in Ghana. The differences in farmers, crops and locations could have accounted for this variation. The results of this study showed that diversification decisions may be accounted for by different sets of factors.
Within the farm-household, decision-making process, the decision to diversify (yes or no) may be preliminary to the decision on the extent to which they diversify (the numbers of crops, livestock and crop–livestock to produce). The two-step approach to examine the determinants of diversification is applied in this paper as applied in Sichoongwe et al. (Reference Sichoongwe, Mapemba, Ng'ong'ola and Tembo2014) and Wiredu et al. (Reference Wiredu, Zeller and Diagne2015).
Factors affecting crop diversification
Considering crop diversification, the positive effect of extension on the discrete decision to diversify signifies the relevance of extension services and other complementary institutions in encouraging farmers to diversify. Farmers acquire relevant information on the availability of necessary resources, market prices and profitability of new crops as well as necessary complementary technologies through these institutions (Ibrahim et al., Reference Ibrahim, Rahman, Envulus and Oyewole2009; Aneani et al., Reference Aneani, Anchirinah, Owusu-Ansah and Asamoah2011). Such information clears possible uncertainties about the crops and increases both the probability and the extent of crop diversification (Rahman, Reference Rahman2008). Other studies have found that increasing access to extension has increased the probability and the extent of crop diversification (Ibrahim et al., Reference Ibrahim, Rahman, Envulus and Oyewole2009; Mesfin et al., Reference Mesfin, Fufa and Haji2011).
In addition, farm-level factors such as the quantity of fertilizer, and the use of tillage equipment increased the probability and the extent of crop diversification. Because plowing reduces the drudgery of land preparation in terms of labor requirements and allows a greater area of land to be cultivated within a shorter period than using manual methods, crop diversification has been found to increase with access to farm implements and machinery (Mrema et al., Reference Mrema, Baker and Kahan2008; Ibrahim et al., Reference Ibrahim, Rahman, Envulus and Oyewole2009; Mesfin et al., Reference Mesfin, Fufa and Haji2011; Sichoongwe et al., Reference Sichoongwe, Mapemba, Ng'ong'ola and Tembo2014). Given the available land, the ability to cultivate larger areas allows farmers to cultivate a greater range of crops.
The quantity of fertilizer used also increased both the probability and the extent of crop diversification. Farmers who apply the recommended amount of fertilizer at the right time are more likely to increase their cropping returns. This is more prominent, especially in Ghana and other sub-Saharan Africa countries, where soil infertility is a major issue. Fertilizer availability enables farmers to improve the fertility of their land, thus making it suitable for them to increase the variety of crops they cultivate. Similar results have been obtained in India (De and Chattopadhyay, Reference De and Chattopadhyay2010); Malawi (Ndhlovu, Reference Ndhlovu2011) and Zambia (Sichoongwe et al., Reference Sichoongwe, Mapemba, Ng'ong'ola and Tembo2014), where quantities of fertilizer use was found as a significant determinant of crop diversification.
The positive effect of the fertilizer subsidy implies that farmers with access to the fertilizer subsidy are able to obtain the recommended amounts of fertilizer at the right time for their cropping activities and, therefore, are more likely to diversify their crop production. The fertilizer subsidy ultimately results in increased fertilizer usage, which increases crop yields (Mason and Jayne, Reference Mason and Jayne2013) and, hence, potentially increases crop–livestock diversification.
The negative effect of access to good road networks indicates that farmers who have access to good roads tended to specialize in their crop-production activities This is because good roads reduce the transaction costs associated with sending produce to the markets and, as a result, farmers are able to identify specific high-value crops of which they tend to increase production without necessarily diversifying. While these results contradict those of Joshi et al. (Reference Joshi, Gulati, Birthal and Tewari2004), this study focuses on all crops in general, whereas their study was specifically on horticultural crops. Hence, while perishability, which is highly influenced by good road networks, is a key constraint in horticulture, it may not necessarily be a major issue among crop–livestock farmers who produce largely cereals and legumes where perishability has minimal effects.
Besides these factors, other determinants such as share of family labor and dependency ratio had negative effects on the discrete decision only, suggesting that the probability of crop diversification is smaller for households with more family labor and higher numbers of dependents. The diversion of family labor into other farming activities rather than crops, as well as into off-farm income-generating activities, could possibly explain this finding. This result, however, differs from that of Culas (Reference Culas2006), who found that increased use of both family and hired labor positively influenced crop diversification.
The continuous decision was also influenced by gender, indicating that male farmers are more inclined to increase the extent of diversifying than female farmers. In most areas of Ghana, households with male heads have increased access to production resources, hence, influence most household production decision-making (Etwire et al., Reference Etwire, Dogbe and Nutsugah2013) and increase the extent of crop diversification. Also, the positive effect of age on the continuous decision implies that the extent of diversification is higher among older farmers. This may be the case because older farmers become more risk averse by diversifying and this decision may also be influenced by their past production experiences.
As expected, the perception of farmers about obtaining stable income through diversification was found to be highly significant in determining the continuous crops diversification decision. The inherent risks in agriculture, including climatic, biophysical and market-related risks, have resulted in crop diversification being used as a strategy to manage these risks (Mukherjee, Reference Mukherjee2010; Chavas and Di Falco, Reference Chavas and Di Falco2012). The risks are also reduced when farmers have access to market information which is also found to be an important positive determinant of crop diversification.
Factors affecting livestock diversification
The negative effects of land ownership on the discrete decision to diversify indicates that farmers who own their land tend not to diversify their livestock portfolios because they might have already identified crops that they grow and livestock may not be so favored because they require little land to raise. However, the probability of diversifying in livestock production tended to increase for larger amounts of land operated.
As expected, access to credit increased the probability and extent of diversifying in livestock production. This may be associated with credit relieving the financial pressure associated with acquiring necessary inputs for livestock production, such as obtaining new breeds and veterinary services, hence farmers are able to increase the numbers of livestock they keep.
Among the integrated crop–livestock practices that were included in the models, storage and feeding of crop residues had negative and positive effects, respectively, on the discrete decision of diversifying in livestock production but not on its extent. This indicates that, generally, storage of crop residues is not a common practice among smallholder farmers in Ghana. For instance, the regional baseline report of the sustainable intensification of integrated-crop small-ruminant project in West Africa (SIIC-SR, 2013) revealed that 36% of sample farmers stored their crop residues after harvest. The usual practice is to allow the crop residue to decompose after harvest which is later plowed back into the soil at the beginning of the next cropping season. Evidence indicates that the difficulty in transporting the crop residue from the farm to the house for storage is a major issue that prevents farmers from storing crop residue.
The greater the distance to markets, the more likely farmers were to diversify their livestock production but the extent of diversification decreased. The farther the farmers are from markets, the greater their transport costs both in terms of accessing inputs and also sending their produce to the market (Ibrahim et al., Reference Ibrahim, Rahman, Envulus and Oyewole2009). Farmers tend to diversify to limit the risks associated with losses from this situation. In a related result, farmers located farther away from markets or main roads were found to diversify to meet their broad subsistence and nutritional needs (Kankwamba et al., Reference Kankwamba, Mapila and Pauw2012). Poor road conditions were found to decrease the probability and extent of diversification in livestock production. This corroborates with the finding that poor road conditions have been found to account for up to about 70% of total food prices in a district of Ghana (Taiwo and Kumi, Reference Taiwo and Kumi2013). This suggests that, in addition to the distances, the conditions of the roads are also crucial for enhancing livestock diversification among smallholders in Ghana.
Only the probability of livestock diversification decreased with increases in hired labor on the farms. Generally, hired labor has not been used much in livestock production in Ghana because livestock numbers were generally small among smallholders and such labor tends to be used mostly in crop activities.
Furthermore, farmers with access to market information tended to have higher probability of diversifying but less extent of diversification in livestock production. Farmers tended to concentrate their efforts and resources on the given set of livestock when they are were better informed about the market situation, thereby decreasing the extent to which they diversify their livestock.
Factors affecting integrated crop–livestock diversification
The use of tillage equipment on the farms was the only variable that had significant (positive) effects on the probability and extent of diversification in crop–livestock farming systems in our study. This is probably because the use of more modern tillage equipment in land preparation for cropping enables farmers to have adequate time for greater involvement in the various livestock enterprises.
Farm size and off-farm income were the only other variables that had significant (positive) effects on the probability of diversifying in crop–livestock diversified systems. However, there were a larger number of factors that contributed significantly to increasing the extent of diversification in the crop–livestock enterprises, namely, gender, credit access, extension, market information, stable income, in addition to usage of tillage equipment, already noted.
The essential role of credit in ensuring timely acquisition of inputs and other resources necessary for production accounts for its importance in determining the extent of crop–livestock diversification. Access to credit allows farmers the flexibility to select between commodities and increase the numbers of crops and/or livestock produced. As pointed out by Aneani et al. (Reference Aneani, Anchirinah, Owusu-Ansah and Asamoah2011), the availability of credit in the form of loans or in-kind was found to stimulate crop diversification among cocoa farmers in Ghana.
Access to extension and market information positively influenced crop–livestock diversification. The rationale is that farmers who diversify into crop–livestock production tended to modify their production decisions to resonate with extension advice and market information even when production is ongoing. Thus, they are able to add additional crops and/or livestock to the initial commodity set to meet market demand and maximize their profits (Rahman, Reference Rahman2008; Mesfin et al., Reference Mesfin, Fufa and Haji2011). In addition, enhanced access to information through extension and market information equips farmers to dispel their possible doubts associated with different crops and livestock enterprises.
An additional factor that influenced the continuous decision on extent of diversification, but not the choice decision for crop–livestock diversification was gender. This implies that households with male heads are more inclined to increase their extent of crop–livestock diversification. In Ghana, in general, and in the study area, in particular, male members of households are generally the decision-makers on crop and livestock production activities. Accordingly, they have access to productive resources including land and community pasture and, therefore, are involved in major farm decision-making activities. Even in households with female heads, male members are mostly delegated to represent the households in most farm-related decision-making.
As in the case of crop diversification, income stability also contributed to increased crop–livestock diversification. Diversifying allows farmers to obtain incomes for household purposes throughout the year and this desirable situation ultimately enhances the extent to which they diversify their crop–livestock production. This has been an evident rationale in different diversification studies (Abdulai and CroleRees, Reference Abdulai and Crolerees2001; Barrett et al., Reference Barrett, Reardon and Webb2001; Block and Webb, Reference Block and Webb2001; Smith et al., Reference Smith, Gordon, Meadows and Zwick2001; Niehof, Reference Niehof2004; Seo, Reference Seo2010). Income stability implies diversifying income sources, which have been found to reduce production and marketing risks (Illukpitiya and Yanagida, Reference Illukpitiya and Yanagida2008). This result provides evidence that income stability is a significant determinant of crop–livestock diversification, in addition to crop diversification, as noted above. It furthermore implies that crop–livestock diversification in Ghana is indeed income-driven, thus identification of high-value crop–livestock combinations is essential.
Crop–livestock diversification is less prominent among farmers in the A-A district than those in the E-S district, as indicated by the negative coefficient of the district dummy variable, which had value one for the A-A district and zero for farmers in the E-S district. Largely, the E-S district is closer to research and extension services, with a range of possible agricultural development interventions. This, coupled with the existence of a large number of agricultural NGOs, gives farmers in this district enhanced access to information on the relevance of integrated crop–livestock diversification which tends to increase the probability of diversifying.
Conclusions and policy implications
In this paper, we have examined the determinants of diversification focusing on crop, livestock and integrated crop–livestock production systems among smallholders in Ghana. To the best of our knowledge, this is the first study that provides empirical evidence of the determinants of livestock diversification and integrated crop–livestock diversification. In addition, this paper is among the few to disaggregate the diversification decision-making process and apply the Cragg two-step approach to examine both the discrete and continuous diversification decisions, previously commonly analyzed as a joint decision process without conducting the necessary tests.
The results show that both discrete and continuous crop-diversification decisions were influenced by factors such as use of plow tillage, the quantity of fertilizer used and good road networks. For livestock diversification, the significant factors included access to credit, market distance, access to market information, and access to good road networks. For crop–livestock diversification, the only factor that influenced both the discrete and continuous decisions on crop–livestock diversification was the use of plow tillage.
Other factors investigated influenced one or other of the two decisions, such as age of farmers, gender, dependency ratio in the households, off-farm income, land ownership, value of farm assets, hired labor, farm size, share of family labor, access to credit, market distance, access to extension, market information, income stability, access to the fertilizer subsidy, and storing and feeding crop residues. The results obtained present important empirical outcomes with vital contributions to food production policy, research and extension, development agencies and farmers at large.
The results highlight the importance of access to information, which is largely extended to farmers through institutions such as research, extension and other agricultural projects in enhancing diversification among smallholders. Indeed, the agricultural extension services have been instrumental in promoting and disseminating production and marketing information to farmers. To boost this effort, there is the need to include diversification-related extension and information services to farmers. This could include organizing trainings on the relevant combinations of diversified systems that result in optimum synergies for farmers and, more importantly, remove possible doubts associated with the production of important crops and/or livestock. This could be accompanied by training that enhances the capacities of these institutions in terms of personnel, logistics and operating resources.
As shown by the empirical results, farmers’ access to tillage equipment and fertilizer are important determinants and, hence, such access needs to be facilitated among smallholders in Ghana for them to reap the full benefits from diversification. There has been some effort by the Ministry of Food and Agriculture through the establishment of mechanization centers where farmers can access tillage equipment. However, inadequate maintenance of the equipment leaves most of these farmers disappointed, especially at the planting season when it is most needed. Privatizing this system by partnering with interested private investors may be helpful in improving farmers’ access to tillage equipment. This has the potential of improving crop–livestock diversification and, ultimately, enhancing food security and reducing poverty both at the farm household and national levels. As regards access to fertilizer, effective implementation of the existing fertilizer subsidy program to ensure timely availability at affordable prices, and within reasonable proximities, would also improve crop–livestock diversification.
The results of this study show that the discrete decision to diversify and the decision with regards to the extent of diversification are independent decisions and are not the same and, therefore, are influenced by different sets of factors. Estimation of the probability of diversifying alone does not provide sufficient understanding of the factors affecting the full decision-making process. Furthermore, it could also be misleading to assume that the two decisions are jointly made. As a result, it is imperative for future studies, particularly on agricultural diversification, to consider including appropriate tests of separability in the two decisions to determine which estimation procedure is appropriate for the data. This will obviate the trap of not sufficiently capturing the relevant sets of factors that influence the two decisions. This will allow informed recommendations that are suitable for the two decisions to be made appropriately.
Another important outcome of this paper relates to the determinants of diversification of crop, livestock and integrated crop–livestock production. This presents distinct recommendations for researchers and extension, policy and development agencies to appropriately enhance these three production systems to address issues of food security and poverty alleviation.
The empirical results highlight the importance of diversification in crop, livestock and integrated crop–livestock production systems among smallholders in Ghana. Careful consideration needs to be given by researchers, extension services, development partners and policymakers to the factors that have been highlighted in this paper to devise better strategies for the improvement of farm production in Ghana.
Acknowledgements
We are grateful to the farmers in the Atebubu-Amantin and Ejura-Sekyedumase districts for their time and patience in contributing to the data collection. We are also thankful for the financial support of the Australian Government through the Department of Foreign Affairs and Trade, towards the data collection. The logistical support of the CSIR-Crops Research Institute of Ghana during the field work is also duly acknowledged anonymous referees and editorial team for their comments and suggestions. We are not aware of any conflict of interest.
Appendix 1.
Probit, Truncated and Tobit regression estimates for crop diversification.

Probit, Truncated and Tobit regression estimates for livestock diversification.

Probit, Truncated and Tobit regression estimates for integrated crop–livestock diversification.

Appendix 2
Heckman's model of crop diversification.

Heckman's model of livestock diversification.

Heckman's model of integrated crop–livestock diversification.