

Introduction
Population ageing is a general trend in many regions of the world. Increases in life expectancy coupled with decreases in fertility rates have led to an increase in the older population. The median age of the world population is forecast to rise from 26.7 to 38.1 years between 2000 and 2050 (Goldstein Reference Goldstein and Uhlenberg2009); population projections indicate that by 2050 one-third of the population will be 60 years old or over (Lutz, Sanderson and Scherbov Reference Lutz, Sanderson and Scherbov2008).
Policy makers are concerned about the socio-economic consequences of population ageing in terms of the costs of supporting older generations, considering a shrinking workforce. Concerns about ‘population bonus’ have been increasing (Bloom, Canning and Sevilla Reference Bloom, Canning and Sevilla2003). Some industrialised countries have developed pronatal policies to balance the population's age structure and increase its support ratio (Kalwij Reference Kalwij2010; McDonald Reference McDonald2002), yet the efficacy of these policy interventions is unclear (Gauthier Reference Gauthier2007). Some countries are debating whether it would be appropriate to increase the age of retirement assuming that increases in life expectancy are a consequence of improvements in health (Lutz, Sanderson and Scherbov Reference Lutz, Sanderson and Scherbov2008; Martin, Schoeni and Adnreski Reference Martin, Schoeni and Adnreski2010). These policies often rely on estimations of support ratios that are based solely on the population's age structure (e.g. Lee and Tuljapurkar Reference Lee and Tuljapurkar1997), or on projections of the older population that consider their educational attainment (Batljan and Thorslund Reference Batljan and Thorslund2009; Batljan, Lagergren and Thorslund Reference Batljan, Lagergren and Thorslund2009; Joung et al. Reference Joung, Kunst, van Imhoff and Mackenbach2000). New research based on population renewal models shows that improvements in education may mitigate the negative consequences of population ageing directly and through demographic processes. This research suggests that projections of support ratios should be estimated, considering the characteristics of the older population (e.g. education and health), characteristics of the offspring that will provide for them, and changes in marriage behaviour, fertility behaviour and offspring's education that may be triggered by changes in the educational distribution (Kye et al. Reference Kye, Arenas, Teruel and Rubalcava2014).
The current study contributes to recent developments on population ageing research that accounts for improvements in human capital (e.g. Lutz, Butz and KC Reference Lutz, Butz and KC2014; Lutz, Cuaresma and Sanderson Reference Lutz, Cuaresma and Sanderson2008; Lutz, Goujon and Wils Reference Lutz, Goujon and Wils2008). A key idea in this literature is that population ageing proceeds in tandem with socio-economic development; hence ignoring this fact will yield a too pessimistic view of the future as the population ages, hindering sound discussion on the impact of population ageing.
In this paper, following the methods proposed by Kye et al. (Reference Kye, Arenas, Teruel and Rubalcava2014), we estimate Generational Support Ratios (GSRs) for the case of Mexico, a country that has experienced an accelerated rate in its population ageing (i.e. by 2010, 10 per cent of the Mexican population was 60 years old or more, and projections for 2030 show this share will be 15 per cent; González Reference González2015). We examine how changes in educational attainment affect GSRs, taking into account assortative mating, differential fertility and the intergenerational transmission of education. We conduct a series of simulations to show the contribution of each demographic process on changes in GSRs and on the health distribution of older adults. Kye et al. (Reference Kye, Arenas, Teruel and Rubalcava2014) examine the impact of demographic processes on GSRs in the Korean context. By applying the same method, with slight revisions to the Mexican context, we aim to see how demographic processes matter in a different social context.
We also make a cross-national comparison between the Korean and Mexican results. Comparison with the Korean results is interesting given the similarities and dissimilarities between these two countries. Both countries have experienced rapid population ageing over the past decades and have not yet developed solid public pension systems. Kapteyn (Reference Kapteyn2010) showed that Mexico and Korea spent the least on the old-age pension system among the Organisation for Economic Co-operation and Development (OECD) countries. The lack of old-age support pension systems in both countries implies that adults age 60+ are likely to live in poverty, a situation with detrimental effects on their health. Consequently, we would expect that health disparities among older adults by socio-economic status would be large in both countries. This should lead to a large impact of education on the health of older adults. Both countries, however, differ in terms of access to health-care systems. Whereas Korea has developed a universal health-care system since the late 1980s, universal health care was adopted in Mexico in 2002 and full coverage was attained in 2012 (i.e. in the late 1990s, six out of ten Mexicans had access to health insurance). Given these institutional differences, we may expect that health disparities by socio-economic status among adults age 60+ would be larger in Mexico than Korea, leading to a larger impact of education on health among older adults in Mexico. Furthermore, assortative mating and differential fertility also differ in these countries, which may imply more differences in the impact of upgrading education on health. In sum, Korea and Mexico are two countries that spend much lower resources on support for older adults than other OECD countries, whereas Korea has developed a more universal health-care system than Mexico. These institutional settings make the comparison of these two countries interesting. The current study will contribute to the literature by investigating how this demographic model helps to explain differences across societal contexts on the impact of public policies aimed at reducing the burden of older to younger generations, and how institutional settings interact with these differences.
Literature review
GSRs
Conventional measures to estimate the burden of older generations on new generations are based on chronological age. The most popular measure is the old-age dependency ratio defined as the number of adults over 65 divided by the number of individuals between the ages of 15 and 64 (the population economically active) (Goldstein Reference Goldstein and Uhlenberg2009). Some researchers redefine the number of older adults in the numerator as the population in age groups with a remaining life expectancy of 15 years (Lutz, Sanderson and Scherbov Reference Lutz, Sanderson and Scherbov2008) to adjust for improvements in life expectancy. Since these improvements occurred in tandem with educational expansion, re-adjusting the definition of the economically active population in terms of age and education seems appropriate given that better-educated offspring may provide better support to their parents.
However, dependency ratios based on chronological age are not sufficient to capture the burden of the population age 65+ to the overall population (i.e. a 65-year-old in 2014 differs from a 65-year-old in the 1960s, given that the former is likely to be healthier and more independent than the latter, considering secular improvements on health). Built on this assumption, some studies propose alternative measures of population ageing by accounting for changes in the characteristics of the older adult population (e.g. improvements on education and health) (Batljan, Lagergren and Thorslund Reference Batljan, Lagergren and Thorslund2009; Batljan and Thorslund Reference Batljan and Thorslund2009; Joung et al. Reference Joung, Kunst, van Imhoff and Mackenbach2000). These studies, however, solely considered the changing configuration of the older population.
Other studies highlight the importance of taking into account educational attainment in population projections. A series of papers by Lutz and colleagues use multi-state methods to estimate projections of the population by age, sex and education for several regions of the world (Lutz and KC Reference Lutz and KC2011; Lutz, Butz and KC Reference Lutz, Butz and KC2014; Lutz, Cuaresma and Sanderson Reference Lutz, Cuaresma and Sanderson2008; Lutz, Goujon and Wils Reference Lutz, Goujon and Wils2008; Lutz, Sanderson and Scherbov Reference Lutz, Sanderson and Scherbov2004). Given that educational attainment has implications for fertility, mortality and migration, they argue it is crucial to consider explicitly educational attainment in population projections. Assessing population composition quality will allow societies to cope better with the challenges of population ageing, given that human capital is closely linked to productivity and economic growth. For example, these authors suggest that in the long run, below-replacement total fertility rates may be optimal for countries with high levels of educational attainment (Lutz, Sanderson and Scherbov Reference Lutz, Sanderson and Scherbov2004).
Kye et al. (Reference Kye, Arenas, Teruel and Rubalcava2014) followed this approach with a different analytic framework. In this paper, we estimate GSRs using the definition proposed by Kye et al. (Reference Kye, Arenas, Teruel and Rubalcava2014) to capture simultaneously the changing configuration of the offspring and the older population. The GSRs are defined as follows:
 $${\rm GSR_1} = \displaystyle{{{\rm N\; offspring\;}} \over {{\rm N\; adults\;} 60 +}}$$
 $${\rm GSR_2} = \displaystyle{{{\rm N\; offspring\;}} \over {{\rm N\; unhealthy\; adults\;} 60\! + {\rm \;}}} $$
 $${\rm GSR_3} = \displaystyle{{{\rm N\; offspring\; education\;} j} \over {{\rm N\; adults\;} 60\! + {\rm \;}}} $$
 $${\rm GSR_4} = \displaystyle{{{\rm N\; offspring\; education\;} j{\rm \;}} \over {{\rm N\; unhealthy\; adults\;} 60\! + {\rm \;}}} $$
The offspring in the numerator refers to adult offspring born to the adult population age 60+ in the denominator. Educational heterogeneity of the offspring generation is incorporated by defining the numerator as the number of offspring within a certain educational category. The GSR of all offspring per adults age 60+ captures how many people in the offspring's generation are available to support an adult age 60+ in the parental generation (GSR1); the ratio of offspring with 13+ years of education per unhealthy adult age 60+ captures how many college-educated people in the offspring's generation are available to support an unhealthy adult age 60+ in the parental generation (GSR2, GSR4). By defining GSRs in this way, the ‘characteristics approach’ (Sanderson and Scherbov Reference Sanderson and Scherbov2013) is enriched by considering characteristics of older adults and characteristics of their offspring when examining population ageing.
Based on this definition of GSRs, our demographic model explores how GSRs may change as a consequence of (hypothetical) public policies focused on changing the education of a targeted sub-group of women when they are young. This model accounts for the subsequent changes in marriage, fertility and offspring's education in assessing the relationship between improving education and the joint distribution of health among the old-age population and education of their offspring generation. By estimating changes in GSRs, we aim to understand the implications of improvements in health and education at the societal level, not at the family/individual level. Improvements in health and education are used as indicators of societal development. Our goal is to examine the implications of this development for population ageing. Changes in GSRs capture how educational expansion, which proceeds in tandem with population ageing, affects the configuration of the older population and their offspring. We are not examining changes in the generational support system at the family level, such as arrangements of care-giving available to older parents, although this is also an important topic in the study of population ageing. Our focus is on the societal-level implications of an educational expansion on population ageing.
Education and GSRs: demographic pathways
Our model considers the health of older adults and offspring's education as key dimensions of the population capacity to cope with population ageing, arguing that related changes in population quality will offset the negative consequences of population ageing to some extent. Yet, more direct measures for economic resources would be better to capture this change. Studies in national transfer accounts directly examine the life profiles of production and consumption to understand the relationship between the changing age structure of the population and the support system available for older adults, showing that improvements in human capital accumulation can mitigate the negative consequences of population ageing (Lee and Mason Reference Lee and Mason2010). The current study complements this line of research using different measures of social and economic resources.
Previous research shows improving women's education can lead to changes in health in old age in multiple ways. The literature shows a positive association between health and education. Evidence from developed countries shows the more educated enjoy better health and survival chances later in life (e.g. Adler and Ostrove Reference Adler and Ostrove1999; Cutler and Lleras-Muney Reference Cutler, Llera-Muney, Schoeni, House, Kaplan and Pollack2008). Recent studies have found significant causal effects of education on health and mortality in the United States of America (USA) and in Scandinavian countries (e.g. Oreopoulos Reference Oreopoulos2007; Spasojevic Reference Spasojevic, Slottje and Tchernis2011). Another line of research shows that better-educated people enjoy better health and survival chances because they are less likely to engage in risky behaviours and they possess more socio-economic resources (e.g. Chandola et al. Reference Chandola, Clarke, Morris and Blane2006; Ross and Wu Reference Ross and Wu1995). Evidence from Mexico also shows the existence of an educational gradient on health (Smith and Goldman Reference Smith and Goldman2007).
There are also demographic pathways through which changes in women's education may lead to changes in health in old age. Changes in women's education may lead to changes in family configuration that may affect health in old age. These changes may include (a) the choice of not forming a union (due to a reduction in the incentives to marry), or, in the case of marrying, the choice of a better-educated partner, (b) a reduction in the number of offspring, and (c) improvements in offspring's education.
By improving women's education, women's gains from marriage may be reduced by improvements in their labour market position; hence their incentives to marry may be lessened (Becker Reference Becker1973); alternatively, highly educated women may have more incentives to marry because by attaining a higher education level they may become more attractive in the marriage market (Oppenheimer Reference Oppenheimer1988). If incentives to get married are diminished, the increased proportion of never-married women may deteriorate the health distribution at the population level, because on average never-married show higher mortality risks and worst health outcomes than married persons (Hu and Goldman Reference Hu and Goldman1990; Ikeda et al. Reference Ikeda, Iso, Toyoshima, Fujino, Mizoue, Yoshimura, Inaba and Tamakoshi2007). Reductions in incentives to marry may lower women's fertility, having an additional impact on their health when they become old. In a context of increasing patterns of co-habitation, like the USA, changes in gains from marriage (induced by improving women's education) and subsequent changes in fertility and health may differ between married and co-habiting couples. Yet, in the Mexican context given that (a) about 70 per cent of co-habiting couples last more than 20 years (Ojeda and González Reference Ojeda and González2008), (b) there are no differences in fertility behaviour between co-habiting and married couples (Rodríguez-Vignoli Reference Rodríguez-Vignoli2005), and (c) about 40 per cent of unions who start co-habiting legalise their unions (Ojeda and González Reference Ojeda and González2008), we argue that improving women's education will affect women's gains from forming a union and fertility behaviour similarly for both union types (i.e. marriage and co-habitation).
The strong educational assortative mating found in comparative research implies that improvements in women's education will lead to the choice of a better-educated partner (e.g. Esteve and McCaa Reference Esteve and McCaa2007; Mare Reference Mare1991; Smits, Ultee and Lammers Reference Smits, Ultee and Lammers1998), which in turn may lead to better health outcomes in later life, given that spouse's education is positively associated with individual's health (Huijts, Monden and Kraaykamp Reference Huijts, Monden and Kraaykamp2010; Monden et al. Reference Monden, Van Lenthe, De Graaf and Kraaykamp2003; Tafani, Gaspio and Maldonado Reference Tafani, Gaspio and Maldonado2005) and survival chances (Bosma et al. Reference Bosma, Appels, Sturmans, Grabauskas and Gostauta1995).
Improvements in women's and husband's education will reduce the number of children they will bear (Bongaarts Reference Bongaarts2003; Jejeebhoy Reference Jejeebhoy1995; Skirbekk Reference Skirbekk2008), and will lead to improvements of offspring's education, given the strong intergenerational association (Mare Reference Mare1981; Shavit and Blossfeld Reference Shavit and Blossfeld1993; Oreopoulos, Page and Stevens Reference Oreopoulos, Page and Stevens2006) and the negative association between sibship size and education (Guo and VanWey Reference Guo and VanWey1999). Better-educated offspring will be more able to provide their parents with financial support and health information, which ultimately may enhance their health (Friedman and Mare Reference Friedman and Mare2014; Zimmer, Hermalin and Lin Reference Zimmer, Hermalin and Lin2002). This is likely to be the case in Mexico where intergenerational financial transfers are dominated by flows from offspring to old parents (Wong and Palloni Reference Wong, Palloni. and Uhlenberg2009). At the population level, improvements in offspring's education should increase societal capacity to provide old-age support.
The relationship between fertility and health in old age, however, is not conclusive. On the one hand, the reduction in family size may have positive consequences on health because high-parity women are more likely to present worse health outcomes (e.g. Engelman et al. Reference Engelman, Agree, Yount and Bishai2010; Grundy and Holt Reference Grundy and Holt2000; Grundy and Tomassini Reference Grundy and Tomassini2005; Kington, Lillard and Rogoswsk Reference Kington, Lillard and Rogoswsk1997); moreover, having and raising many children may lead to economic strain, role overload and stress, leading to worse health (Hank Reference Hank2010). On the other hand, the reduction in the number of children may have no impact on health (Spence Reference Spence2008), or it may even have negative effects on health in some social contexts (Hank Reference Hank2010).
In sum, changes in women's education, when they are young, influence their health when they are old in multiple ways: directly, through the impact of education on health, and indirectly through the impact of education on marriage, fertility and offspring's education. The demographic model in this paper considers how improvements in women's education will change the configuration of the next generation (smaller but better educated), who will provide support for the older adults. Changes in the educational composition of the next generation can modify the societal capacity to cope with the changing age structure of the population. Because burdens of population ageing should be determined by socio-economic capacity and age structure, this consideration is important when studying population ageing. This model provides a framework that allows for the analysis of how upgrading the educational attainment of a targeted sub-group in the population may affect GSRs, through changes in spouses’ educational distribution, in fertility behaviour, in the offspring's educational distribution and in the health distribution of older adults.
Study site
We examine the effects of education on the health distribution of women age 60+ in Mexico, one of the most rapidly ageing countries in the world (OECD 2011). Between 1950 and 1970 Mexico experienced a decrease from 9.5 to 8.5 working-age people per older adult; this ratio grew to 9 by 1990, and decreased dramatically to 6.7 in 2010, which is slightly above the OECD average of 4.2 (OECD 2011). By 2005, 24.6 per cent of the households in Mexico included at least one adult age 60+. Rapid increases in life expectancy and decreases in fertility rates are responsible for this rapid population ageing. Life expectancy at birth increased from 34.7 in 1930 to 75 in 2010, while total fertility rate decreased from 5.7 in 1976 to 2.1 children per woman in 2010 (Instituto Nacional de Estadística y Geografía (INEGI) 2010).
Even though Mexico's age structure is changing very rapidly, the country is not well prepared for population ageing in terms of old-age pension programmes. Less than 2 per cent of Gross Domestic Product (GDP) was spent in 1990 and 2012 on publicly funded old-age survivor benefits (Kapteyn Reference Kapteyn2010; OECD 2014). Compared to other OECD countries, Mexico showed the lowest expenditures on these benefits as a percentage of GDP. Even though Mexico reformed its pension system in 1997, the new system only covers a minority of the population given that the reform mainly targets people employed in the formal economy, while a large fraction (57 per cent) of the working population is employed in the informal sector (INEGI 2015). Pension benefits are even more limited to Mexican older women given that they were less likely to participate in the labour force. Consequently, Mexicans still rely on the family to provide care for the older population (De Vos, Solís and Montes de Oca Reference De Vos, Solís and Montes de Oca2004). In Mexico, social norms enforce an obligation of the family to provide care for their older adults, in the form of personal services and/or financial resources (Jáuregui, Poblete and Salgado-Snyder Reference Jáuregui, Poblete, Salgado-Snyder, Salgado de Snyder and Wong2006; Wong and Palloni Reference Wong, Palloni. and Uhlenberg2009).
Demographic ageing represents an important challenge in terms of health provision. To deal with this problem, the Mexican government implemented a new policy in 2002, Seguro Popular (SP), aimed at providing health insurance to the uninsured population. The main purpose of the programme is to reduce out-of-pocket health expenditure and to improve population health outcomes. Universal health coverage was attained in 2012. After six years of implementation the evidence regarding the impact of SP on health expenditure was mixed. Some studies showed that in poor rural areas, SP reduced out-of-pocket health expenditure among beneficiaries (Barofsky Reference Barofsky2011; Grogger et al. Reference Grogger, Arnold, Leon, Ome and Triyana2010; Sosa-Rubí, Galárraga and López-Ridaura Reference Sosa-Rubí, Galárraga and López-Ridaura2011). Yet, this result disappears when other identification strategies of statistical models are employed (Barofsky Reference Barofsky2011; Sosa-Rubí, Galárraga and López-Ridaura Reference Sosa-Rubí, Galárraga and López-Ridaura2011). Regarding health-care utilisation and health outcomes, other studies showed SP induced higher rates of health-care utilisation among beneficiaries (Arenas et al. Reference Arenas, Parker, Rubalcava and Teruel2015; Knaul et al. Reference Knaul, González-Pier, Gómez-Dantés, García-Junco, Arreola-Ornelas, Barraza-Lloréns, Sandoval, Caballero, Hernández-Avila, Juan, Kershenobich, Nigenda, Ruelas, Sepúlveda, Tapia, Soberón, Chertorivski and Frenk2012); yet, no impact on health conditions was found in rural areas (Barofsky Reference Barofsky2011), and only impacts on maternal mortality and mortality of children younger than five years were found at the national level (Knaul et al. Reference Knaul, González-Pier, Gómez-Dantés, García-Junco, Arreola-Ornelas, Barraza-Lloréns, Sandoval, Caballero, Hernández-Avila, Juan, Kershenobich, Nigenda, Ruelas, Sepúlveda, Tapia, Soberón, Chertorivski and Frenk2012). These results have cast some doubt on the quality of the services provided by the programme. The lack of impact of SP on health conditions can be explained by the fact that the time frame since the implementation of the policy is not long enough to observe changes.
Mexico also experienced rapid educational expansion in tandem with demographic changes. Between 1970 and 2010, average years of schooling increased from 3.4 (3.7 for males and 3.2 for females) to 8.6 (8.7 for males and 8.3 for females) (Consejo Nacional de Población 2000; INEGI 2010), the percentage of women that completed secondary education increased from 2.6 to 41.2 per cent (Esteve, Garcia-Roman and Lesthaeghe Reference Esteve, Garcia-Roman and Lesthaeghe2012), and women's participation in the labour market increased from 6.5 in 1940 to 33.9 in 2005 (INEGI 2010). Such a dramatic increase in educational attainment needs to be accounted for in any discussion of dependency.
Research design
Baseline model
Based on Kye et al. (Reference Kye, Arenas, Teruel and Rubalcava2014), we model the effect of education on health using a recursive model (see Equation 5) in which the distribution of older women's health is jointly determined by educational attainment, marital status and partner's education, differential fertility, and children's education.
 $$h_{krjl \vert i} = p_{k \vert i}^S \; r_{ik}p_{\,j \vert ik\left( {r - 1} \right)}^O p_{l \vert ikrj}^H, $$
where i is woman's education, r is the number of children; (r − 1) is the number of siblings; k is marital status–husband's education, j is children's education, l is health outcomes; h
krjl|i
represents the joint distribution of marital status–husband's education, number of children, offspring's education and health outcomes conditional on woman's education;
 $p_{k\vert i}^s $
represents the probability distribution of marital status–husband's education conditional on woman's education; r
ik
is the expected number of children born to couples with woman's education i and husband's education k;
 $p_{j\vert ik\left( {r - 1} \right)}^O $
is the probability distribution of offspring's education conditional on woman's education i, marital status–husband's education k, and the number of siblings r – 1 for children of these couples;
 $p_{i\vert krj}^H $
is the health distribution conditional on woman's education i, marital status–husband's education k, the number of children r and offspring's education j.
We estimate four equations separately. First, we estimate marriage behaviour through a multinomial logistic regression to calculate the probability distribution of marital status–husband's education conditional on woman's education (
 $p_{k\vert i}^s $
). This specification differs from Kye et al. (Reference Kye, Arenas, Teruel and Rubalcava2014) which used an ordinal logistic model to predict husband's education. Whereas the Korean data included husband's education for the separated/divorced and widowed, our data (the Mexican Health and Aging Study) do not have this information. In addition, whereas non-marital fertility is extremely rare in Korea, this is not negligible in Mexico. Hence, we classified marital status–husband's education into seven categories: married with husband of 0, 1–6, 7–12, 12+ years of schooling, never-married, widowed and separated/divorced. Because there is no clear ordering in these categories, we use multinomial logistic regression. Second, we estimate fertility through a Poisson regression to calculate expected number of children conditional on marital status–husband's education and woman's education (r
ik
). In this estimation, we treat the combination of marital status and husband's education as a set of categorical variables because we do not know the education of husbands who were deceased or divorced. Third, we model the intergenerational transmission of education through an ordinal logistic regression to estimate the probability distribution of offspring's education conditional on number of siblings, marital status–husband's education and mother's education (
 $p_{j\vert ikr}^O $
). Finally, through a binary logistic regression we calculate the probability distribution of health status conditional on woman's education, marital status–husband's education, offspring's education and number of children (
 $p_{l\vert ikrj}^H $
).
The estimated parameters are used to calculate each conditional probability in Equation (5). Using the estimated h kljr|i and observed marginal distribution of women's education, the expected marginal distribution of women's health outcomes in old age is estimated in the following way:
 $$\widehat{{H_l}} = \mathop \sum \limits_{i = 1}^i \mathop \sum \limits_{k = 1}^k h_{kljr \vert i}W_i$$
where
 $\hat H_l$
is the distribution of expected older adult health and W
i
are marginal distributions of own education.
The predicted probability distributions of offspring's education and health status of older adults, as well as the expected number of children, are used to compute the GSRs for a baseline scenario.
Simulations
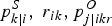
We compute
 $\hat h_{krjl\vert i}$
for different scenarios that vary by changes in the education distribution of women, and the presence or absence of changes in the distributions associated with demographic processes (i.e.
 $p_{k\vert i}^S, \; r_{ik},p_{j\vert ikr}^O $
). By conducting simulations, in which each or some of the demographic processes are held constant, we are able to show how these processes improve or worsen older adults’ health, and what is the contribution of each demographic process on changes in GSRs.
After simulating the health distribution, we compute two different ratios. First, we compute the ratios of simulated proportion healthy to the baseline (observed) proportion healthy. Ratios greater than 1 indicate that improvements in educational attainment lead to improvements in the health of older adults. These ratios, computed in various conditions in which intervening demographic mechanisms are present or absent, show the proportional changes in the health distribution and the contribution of each demographic element to such changes. We also compute the ratios of simulated GSRs to baseline GSRs to assess how changes in educational attainment in one generation lead to changes in the generational support structure of the population.
The simulation analysis basically summarises the results found in the regression analysis. For example, if there is a strong association between education and health of older adults, improvement in education will lead to a sizeable increase in the proportion healthy. Should our goal be estimating the contribution of each demographic element to the health of older adults, it would be sufficient to examine indirect effects in the path analysis or structural equation modelling framework. However, we focus on the jointly changing configuration of the older adults and their offspring. Analytically, we are simultaneously handling two generations, or two units of analysis at the same time. In this situation, regression coefficients per se are not sufficient to present estimates of interest. Hence, we conduct simulations to see how changes in women's education lead to changes in the offspring's educational distribution and on the health distribution of these women in old age, using the GSRs as key measures.
Because key measures in simulation analyses are based on parameter estimates from four different regressions, we use a bootstrapping method to compute standard errors (Efron and Tibshirani Reference Efron and Tibshirani1993). First, we resample 1,000 bootstrap samples with replacement from the original data-set. Second, we compute for each bootstrap sample the four sets of regressions and compute predicted probability distributions and the expected number of children by their education needed to estimate GSRs. Third, based on this information, we compute for each sample ratios of simulated proportion healthy to baseline proportion healthy, and simulated GSRs to baseline GSRs. Finally, we estimate standard errors of estimates by computing the standard deviations of these ratios.
Even though improvements in educational attainment may lead to increases in the number of survivors in old age and the number of surviving offspring, our model does not account for the effect of differential mortality by education due to the lack of suitable data (see Discussion section).
Data
We use the Mexican Health and Aging Study (MHAS), a longitudinal study of health and ageing in Mexico, with national and urban–rural representations. The baseline survey was conducted in 2001 and is representative of the Mexican population of the year 2000, aged 50 and over. The sample size is 9,862 households with around 15,000 individuals and covers all 32 states in Mexico (ENASEM 2004). The MHAS includes socio-demographic characteristics, family composition, fertility and health outcomes. To account for survey design, we used sampling weights in the descriptive analysis and in all regression models. We add to the regressions controls for age, rural residence and living in a high migration state. We considered using more recent data from the Mexican Family Life Survey (MXFLS) instead of MHAS, and conducted a parallel analysis with them. Although more recent, the MxFLS includes a smaller number of respondents age 60+, lowering statistical power. Hence, we use MHAS in the final analysis.
Analytical sample
Our sample includes women age 60+ at baseline: a total of 3,829 eligible respondents. Of the 3,829 original respondents, 10 per cent were dropped due to missing data on health outcomes, number of children or on offspring's education, resulting in an analytical sample of 3,427 women. We explore mis-representativeness due to missing data and find that education, marital status, rural residence and living in a high migration state are not associated with non-response. However, we find that women aged 80+ are 2.8 times more likely to be missing in the sample compared to youngest group of women.
We constructed two analytical samples. The first sample is used for the health, marriage and fertility models, and consists of women age 60+. The second sample is used for the intergenerational transmission of education model and consists of the offspring of the women in the first sample. Childless women do not contribute any observations in this sample. The second sample has 18,374 observations. Offspring younger than 18 years old were excluded in the analysis (N = 77) given that these children are likely to continue in school, and we are interested in estimating an intergenerational transmission of education model with measures of final educational attainment for both parents and their offspring.
We use three measures of health: self-reported health (SRH), difficulty in performing activities of daily living (ADLs) and difficulty in performing instrumental activities of daily living (IADLs). We dichotomise SRH into good health (‘excellent’, ‘very good’ and ‘good’) and other (‘fair’ and ‘poor’). We use two measures of functional limitations: difficulty in performing ADLs and difficulty in performing IADLs. The ADL items include walking within a room, bathing, eating, getting out of bed and lying down, and using the toilet. We classify respondents as functionally limited in ADLs if they report at least one limitation in any of these items. The IADLs items include preparing a hot meal, shopping, managing money and taking medications. We classify respondents as functionally limited in IADLs if they report at least one limitation in any of these items. These two measures of functional limitations capture more objective health conditions and measure different aspects of independent living among older adults (Wiener et al. Reference Wiener, Hanley, Clark and Van Nostrand1990).
We classify women's education into four categories: no instruction, 1–6 years, 7–11 years and 12+ years of schooling. Marital status–husband's education is classified into seven categories. For our model, the relevant categories are: never married, married to a husband with no instruction, with 1–6 years, with 7–11 years and with 12+ years of schooling. The sixth and seventh categories classify widows (38 per cent), and separated or divorced (9 per cent). Adding these categories into the models does not provide an estimation of the association between husband's education and women's characteristics, because husband's education is missing for the widowed and separated/divorced women. Instead, this estimation allows us to estimate the relationship between women's characteristics and husband's characteristics that are measured by husband's education – if available – and marital status. This is equivalent to using a dummy indicator for the missing information, and keeps the observations with missing information on husband's education (Allison Reference Allison2001).
To capture the education of younger cohorts, we classify offspring's education into four categories: less than 6, 7–9, 10–12 and 13+ years of schooling. In the health model, we use the percentage of children in each educational category as a measure of offspring's education. For childless women (who represent 7 per cent of the sample) we set the four categories equal to zero. This specification is equivalent to a ‘dummy variable adjustment’ method in handling missing data (see Allison Reference Allison2001: 9–11).
Results
Descriptive results
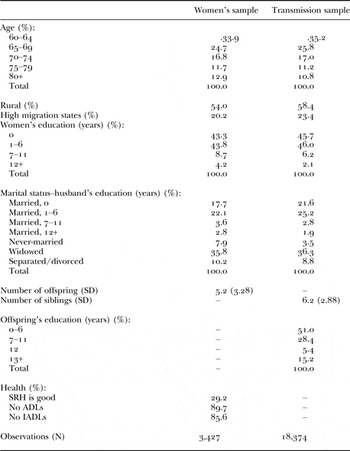
Table 1 shows descriptive statistics of the two samples. Means, standard deviations and percentages shown in this table are weighted to represent estimates at the population level; the number of observations is unweighted.
Descriptive statistics

Notes: Percentages, means and standard deviations (SD) are weighted; the number of observations is unweighted. SRH: self-reported health. ADLs: activities of daily living. IADLs: instrumental activities of daily living.
Source: Mexican Health and Aging Study, 2001.
The first column of Table 1 shows summary statistics for Mexican women age 60+. Most of these women show low educational attainment; about 8 per cent of them never married, 46 per cent are married, 10 per cent are separated/divorced and 36 per cent are widowed; their husbands’ educational attainment is fairly low; and, on average, they have 5.2 surviving children. In terms of health, 29 per cent reported having good health, while 89 and 85 per cent reported not having difficulties performing ADLs nor IADLs, respectively. Differences between SRH and ADLs/IADLs are expected given that SRH is shaped not only by physical health (i.e. current illnesses, diseases, physical functioning), but also by mental health, health behaviours and health comparisons to other people, while functional limitations are mainly determined by disabilities (Johnson and Wolinsky Reference Johnson and Wolinsky1993; Krause and Jay Reference Krause and Jay1994).
The second column of Table 1 shows statistics of offspring's mothers in the transmission model. In this sample, women with more surviving children are represented more. Mothers in this sample are slightly younger, less educated, more likely be currently married, more likely to have less-educated husbands and more likely to be widowed compared to the women in the first sample. Consistent with previous research on social mobility showing that the offspring generation is likely to surpass the educational attainment of their parents (Bherman, Gavira and Székely Reference Bherman, Gavira and Székely2001; Torche Reference Torche2010), our data show offspring's education is higher than mother's education. On average, offspring have 6.2 siblings, which is higher than the average number of children in the women's sample, because offspring of more fertile women are more represented in the transmission sample.
Regression analyses
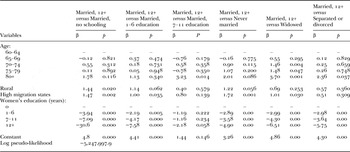
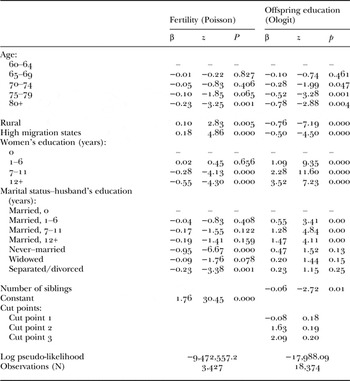
Tables A1, A2 and A3 in the Appendix show the results for the marriage, fertility and health models. In terms of marriage behaviour (see Table A1), we find a pattern of educational homogamy among married women, and a positive association between education and the probability of singlehood. This finding is consistent with the hypothesis that improvements in women's education may lessen the incentives to marry due to reductions in marriage returns. In terms of fertility (see Table A2), we find a negative relationship between women's education and fertility, and never married women show the lowest fertility. We do not find a significant relationship between husband's education and fertility.
The intergenerational transmission of education model (see Table A2) shows that offspring's education is strongly associated with parental education. Having one sibling more is associated with a 5 per cent [100 × (1 − e−0.06)] decrease in the odds of attaining a higher educational category, net of the other variables in the model.
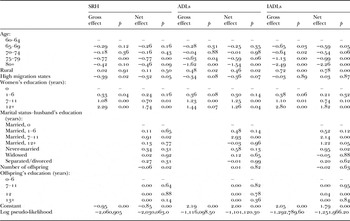
The health model (see Table A3) shows educational gradients in health in terms of all health measures. Marrying husbands with higher education, as well as not marrying anyone, is associated with better women's health only in terms of IADLs. We do not find any effects of offspring's education on SRH nor on ADLs; however, we find a positive effect in terms of IADLs. Having an additional child decreases the odds of reporting good health, in terms of SRH, by 6 per cent, holding the other variables in the model constant.
Scenarios
Our simulations consist of changing 5 per cent of women from lower to higher educational categories according to two different scenarios:
-
1. From 0 to 12+ years of education.
-
2. From 1–6 to 7–11 years of education.
We conjecture first that improvements in women's education will lower incentives to marry and lead to marriages with better-educated husbands due to educational homogamy. Second, this improvement will be associated with a reduction in fertility, which will be enhanced by the increase in the proportion of never-married women. Third, improvements in parental education and the reduction in the number of siblings may lead to improvements in offspring's education. The magnitude of changes in educational distribution, 5 per cent change from the lower to the higher category, is arbitrary. It would be possible to devise more realistic scenarios, but we made this decision for two reasons. First, this exercise will be sufficient to show the implications of educational upgrading for the jointly changing configuration of the older adult generation and their offspring generation. Second, to facilitate comparisons with the Korean results in Kye et al. (Reference Kye, Arenas, Teruel and Rubalcava2014).
Due to educational gradients on health, these changes may improve the health distribution of older adults, which will be enhanced by improvements in husband's and offspring's education in terms of SRH and IADLs. Subsequent fertility reductions may worsen the health distribution in terms of SRH.
Upgrading women's education will decrease the number of offspring per adult age 60+ (GSR1); however, the directions of the changes in the other GSRs will depend on the relative change in the number of unhealthy adults age 60+ (which is expected to decrease) and the number of offspring (which is also expected to decrease).
Simulations
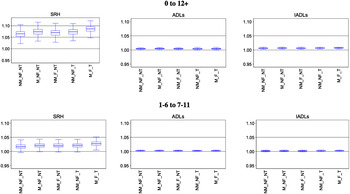
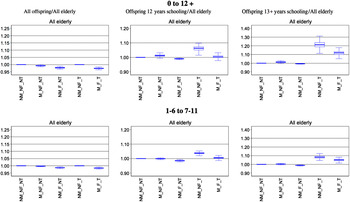
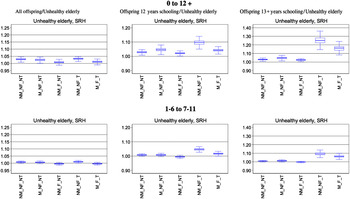
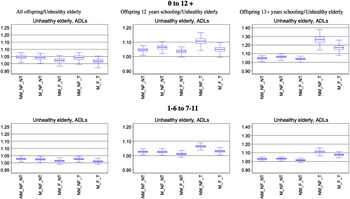
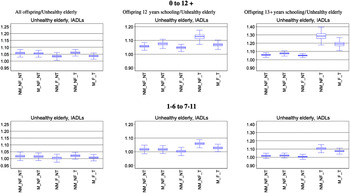
Figure 1 shows ratios of simulated proportion healthy to baseline proportion healthy for the two scenarios. Figures 2–5 show ratios of simulated GSRs to baseline GSRs. Ratios greater than 1 mean that simulated changes in education lead to an increase in the proportion healthy or in the GSRs. Box plots are presented to show point estimates of these ratios along with sampling variability. The box plots show the medians (middle lines), the 25 and 75 percentiles (boxes) and 1.5 time interquartile ranges (outer lines). We consider that a ratio is statistically significant if the 1.5 interquartile range does not include 1.
Ratios of simulated proportion healthy to baseline proportion healthy.

Simulated Generational Support Ratios (GSR)/baseline GSR.

Simulated Generational Support Ratios (GSR)/baseline GSR for self-reported health (SRH).

Simulated Generational Support Ratios (GSR)/baseline GSR for activities of daily living (ADLs).

Simulated Generational Support Ratios (GSR)/baseline GSR for instrumental activities of daily living (IADLs).

Within each scenario, we made several assumptions regarding the demographic processes involved. As indicated at the bottom of Figure 1, M represents marriage behaviour, F is differential fertility and T is intergenerational transmission of education. N indicates the absence of respective elements. For example, M_F_T simulation assumes changes in women's education lead to changes in husband's education, number of children and children's education. By contrast, for the NM_NF_NT simulation, none of these changes occur.
Changes in the health distribution of women age 60+
In terms of SRH, most of our conjectures are supported. First, an improvement in women's education has a direct positive effect on health. For example, in scenario 1 the NM_NF_NT simulation shows that by improving 5 per cent women's education from 0 to 12+ years, the proportion healthy increases by 6.0 per cent. We get similar results for scenario 2, but improvements are smaller because changes in women's education are not as dramatic as in scenario 1. Second, we find that demographic processes enhance health distributions. For example, we find that changes in fertility behaviour, due to upgrading women's education from 0 to 12+ years, increases the proportion healthy by 0.50 per cent (1.069 in NM_F_NT minus 1.064 in NM_NF_NT). This is the case because fertility is negatively associated with health status. In this scenario, considering only changes in offspring's education (see NM_NF_T), the proportion healthy increases by 0.8 per cent; and considering only changes in marriage behaviour (i.e. reduction in incentives for marriage and educational homogamy), this proportion increases by 1.0 percentage points in scenario 2. By taking into account all demographic processes (see M_F_T), the initial improvement in the proportion healthy is boosted by 2.2 percentage points in scenario 1 and by 1.0 per cent. This suggests that the change in marriage behaviour is the most important demographic factor that boosts the health distribution of older women. Third, by comparing the two scenarios we find that the magnitude of the contribution of these demographic processes on the health of women age 60+ is stronger if the improvement in women's education involves greater changes in their educational attainment.
In terms of ADLs, we find that improvements in women's education have a slight positive effect in the health distribution. For ADLs, the proportion healthy increases 0.4 and 0.3 per cent in scenarios 1 and 2, respectively (see NM_NF_NT). However, demographic processes do not have further effects on the health distribution in terms of ADLs, because number of offspring and offspring's education are not significantly associated with the ADLs. In terms of IADLs, we find that improvements in women's education improve the proportion healthy by 0.6 per cent, in scenario 1. Changes in marriage behaviour increase the proportion healthy by an additional 0.1 percentage points, which does not appear substantial.
The results are generally comparable with the Korean results. As expected, in both countries, improvements in educational attainment lead to improvements in the health distribution of older women. Nonetheless, the patterns are also distinctive. First, the magnitude of changes in each scenario is a bit larger in Mexico than in Korea. Whereas a 5 per cent change from 0 to 12 years of schooling leads to a 5.4 per cent increase in the percentage healthy in terms of SRH in Korea (M_F_T model), this amounts to 8.2 per cent in Mexico. A stronger educational gradient in health in Mexico yields this difference. Second, whereas offspring's education is the most important demographic factor in Korea, marriage is the most important in Mexico. Because the model specification is somewhat different, it may be difficult to reach a firm conclusion regarding this matter.
Changes to GSRs
Figure 2 shows that improvements in women's education reduce the number of total offspring per woman age 60+. However, the change is not substantial. By contrast, we can see substantial increases in the number of offspring with college or more per woman age 60+ (e.g. 11.6 per cent in scenario 1). These improvements result from the strong contribution of the intergenerational transmission of education (see NM_NF_T). These results suggest the older population can be supported by a better-educated offspring.
In terms of SRH, Figure 3 shows the number of total offspring per unhealthy woman age 60+ increases by 2.8 per cent in scenario 1 (see NM_NM_NT). This is the case because improvements in women's education reduce the proportion unhealthy. After taking into account demographic processes, the increase in the support ratio is no longer significant. A similar pattern is observed in terms of ADLs and IADLs (see Figures 4 and 5). The reduction in the size of the offspring's generation is responsible for the insignificant effect of the educational upgrading on the ratio of all offspring to unhealthy woman age 60+.
We find changes in fertility, marriage and offspring's education contribute significantly to the change of the number of offspring with college or more per unhealthy woman age 60+. Again, transmission is the main contributor in the change of this ratio; for example, in terms of SRH, upgrading women's education from 0 to 12+ years boosts this ratio from 2.8 per cent to 13.2 per cent. In terms of ADLs and IADLs, we also observe similar but somewhat stronger patterns. Even though ADLs are not significantly related to fertility and marriage at the micro-level, at the population level upgrading women's education leads to important changes in the offspring's configuration that affect significantly the number of college-educated offspring per unhealthy woman age 60+.
The patterns found here are generally comparable to the Korean results. However, the magnitudes of change differ. Whereas the ratio of college-educated offspring to unhealthy woman age 60+ increased by 8.0 per cent in Korea, in terms of SRH (in the M_F_T model), this amounts to a 15.0 per cent increase in Mexico. Similar patterns are observed for other health outcomes. The larger impact in Mexico may be the result of the existence of a stronger educational gradient in health in Mexico and differences in the offspring's educational distribution.
Discussion
Our study estimates GSRs to examine the dependency of older generations to new generations, taking into account health heterogeneity of the older population and education heterogeneity in the offspring generation. We apply the same method as Kye et al. (Reference Kye, Arenas, Teruel and Rubalcava2014) to examine what would be the effect of a public policy that changes the education of a targeted sub-group of women when they are young, on their own health when they become older, taking into account changes in marriage and fertility behaviours and changes in offspring's education.
Our results for Mexico show that upgrading women's education has a direct positive effect on their health distribution when educational upgrading involves greater changes in educational attainment. Effects on the health distribution of women age 60+ are larger in terms of SRH than in terms of ADLs and IADLs. Accounting for changes in marriage, fertility and offspring's education did not make a sizeable difference in the proportion healthy in Mexico. This suggests intervening demographic variables are not influential in determining the health distribution of older women. Changes in marriage behaviour are slightly more important than changes in fertility and offspring's education. This general pattern is similar to the Korean case. However, the impact of education on the health of older women is stronger in Mexico than in Korea. The stronger educational gradient in health in Mexico explains this difference, which may reflect institutional differences in access to health care in both countries. While in Korea health-care access has been universal since the 1980s, in Mexico, for the cohorts analysed, health-care access was selective. Hence, differences in individual resources should be more important in determining health in later life in Mexico than in Korea, leading to a stronger educational gradient in health of older women. Differences in educational gradients in health between Mexico and Korea are likely to diminish in the future, given that Mexico recently implemented SP, a policy intended to provide universal health coverage to the uninsured population. Yet, even with the implementation of SP, a stronger educational gradient in the health of older women may persist in Mexico compare to Korea if health services provided by SP in Mexico are of lower quality than in Korea.
Interestingly, in Mexico the change in marriage behaviour was the most important demographic intervening factor boosting the proportion healthy (see Figure 1), while in Korea changes in offspring's education were more salient. The comparison suggests that the way in which demographic factors matter in the final health distribution of older adults depends on societal context. Family ties in East Asian countries tend to be stronger than in Western countries although these countries experienced rapid modernisation (Lee et al. Reference Lee, Parish and Willis1994; Sung Reference Sung, Bengtson, Kim, Myers and Eun2000). This suggests that traditional norms are still working in these countries. Evidence from the USA shows stronger ties among Mexican immigrant families (compared to US families), given that Mexican families usually keep the primary care-giving responsibilities of their older family members (Clark and Huttlinger Reference Clark and Huttlinger1998; Dilworth-Anderson, Williams and Gibson Reference Dilworth-Anderson, Williams and Gibson2002). Hence, the weak association found in our study between offspring's education and parental health in old age may be surprising. Yet, this association may be explained by the fact that in Mexico, even though intergenerational financial transfers are dominated by flows from offspring to older parents (Wong and Palloni Reference Wong, Palloni. and Uhlenberg2009), better-educated parents (compared to parents with no education) are less likely to receive financial transfers from their offspring (Wong and Higgins Reference Wong, Higgins, Angel and Whitfield2007).
In terms of GSRs, results for the Mexican context show that although fertility reductions decrease the number offspring per woman age 60+, improvements in offspring's education boosts the number of offspring with college or more per woman age 60+. Of all the demographic processes considered, improvement in offspring's education is the main factor driving up these ratios. This implies that by upgrading women's education, the older population can rely on their better-educated offspring for their support.
Again, the patterns found here are consistent with the Korean results, which confirm the importance of taking into account intervening demographic processes in the calculation of GSRs. However, the larger impact in Mexico may be the result of the existence of a stronger educational gradient in health for older women in Mexico and differences in offspring's education. As mentioned before, the stronger educational gradient in health in Mexico may reflect institutional differences in health-care access. Differences in educational attainment across countries may also explain the greater impact that a policy like this may have on GSRs in Mexico than in Korea. Whereas 34.9 per cent of offspring received at least some college education in Korea, only 15.2 per cent of Mexican offspring attained the same amount of schooling. Hence, educational upgrading in the mother's generation leads to larger proportional change in Mexico than in Korea, yielding a larger change in this GSR. Finally, the roles of assortative mating and differential fertility are relatively smaller in Mexico than in Korea in terms of GSRs. In Korea, assortative mating and differential fertility are important in terms of the ratio of college-educated offspring to unhealthy women age 60+, although changes in offspring's education is the most important for changing GSRs. In Mexico, the change in offspring's education is also the most important factor for the changing GSRs among the demographic variables considered. Marriage and fertility are almost negligible compared with offspring's education. Interestingly, this is the case although offspring's education is not a strong predictor of women's health in old age. This illustrates the importance of accounting for intervening demographic mechanisms in describing the changing configurations of the population associated with the changes in education. Differences between Korea and Mexico should also reflect differences in offspring's educational attainment and distinctive family formation processes.
Our study has several limitations. First, our results cannot be generalised to the entire population because our sample includes only female respondents. We confined the analysis to the female population to avoid analytic complexities associated with two-sex models. Because it is unlikely that substantial gender differences in the relationships exist in the patterns examined in the analysis, this selection may not be a great concern. Nonetheless, we need to mention one caveat in this matter. Care-giving activities are gendered. Women are mostly primary care-givers in Mexico (Jáuregui, Poblete and Salgado-Snyder Reference Jáuregui, Poblete, Salgado-Snyder, Salgado de Snyder and Wong2006; Mendez-Luck Kennedy and Wallace Reference Mendez-Luck, Kennedy and Wallace2009). Higher labour market participation among better-educated women would change arrangements of gendered care-giving, probably reducing care-giving provision within the family or household. Our model does not consider this aspect. This is particularly problematic in assessing the role of offspring's education on changing GSRs. In this sense, our model is likely to overestimate the benefit of improvement in offspring's education to some extent. However, it is important to consider that changes in gender and intergenerational relations in Mexico have changed family obligations and expectations about the care of older adults. Even though women continue to be the most important providers of care for their older parents, recent cohorts perceived this type of care as collective and as the obligation of all siblings (men and women) (Robles and Pérez Reference Robles and Pérez2012). Second, at the individual level, the model assumes that education is exogenous and that husband's education, number of children, offspring's education and women's health status are endogenous. However, these assumptions may not reflect reality because the relationship between (a) women's and husbands’ education, (b) women's education and number of children, and (c) women's education and health may not be causal (Angrist and Pischke Reference Angrist and Pischke2009; Logan, Hoff and Newton Reference Logan, Hoff and Newton2008; Schmidt Reference Schmidt2008). Nonetheless, the model assumes that education is exogenous to illustrate the demographic pathways through which education may affect health. Third, at the population level, the model assumes that changes in the distribution of education affect the age structure of the population. However, changes in the age structure of the population may lead to changes in educational attainment (Lee and Mason Reference Lee and Mason2010). We do not intend to establish causality between education and age structure; nevertheless, by assuming that changes in the educational distribution are exogenous, we are able to show how differential fertility, educational assortative mating and the intergenerational transmission of education affect GSRs. In addition, the changing GSRs were estimated under the assumption that the relationships among the variables included in the models are not affected by changes in the educational distribution of women. However, improvements in women's education are likely to change these relationships. In this sense, our estimates of changing GSRs tell us the implications of demographic pathways for GSRs under the currently observed relationships rather than forecasting a future trend. Another implication of this assumption is that our model does not incorporate the possibility of changes in the health-care system, which is unrealistic given that the system is very likely to change as the educational distribution improves. To incorporate this possibility in our model it would be necessary to have access to data that allow the proposal of sensible scenarios about future changes in the health-care system. Unfortunately, we do not have appropriate data to do this task. Fourth, we did not consider the possibility of saturation of educational attainment, either. Although educational opportunity has expanded dramatically in both Mexico and Korea, there should be some limit. This suggests that the estimates presented in the current study may not accurately forecast the future, given that our study considers the currently observed relationships to estimate the effect of education on the changing generational support structure. Fifth, our model does not account for the effect of differential mortality by education. In particular, we know that improvements in educational attainment may lead to increases in the number of survivors in old age and the number of surviving offspring. However, this model does not account for the impact in support ratios and the proportion unhealthy that arise as a consequence of greater longevity or the reduction in infant mortality, due to the lack of suitable data for Mexico. Kye et al. (Reference Kye, Arenas, Teruel and Rubalcava2014) adjusted for differential mortality by education, but the adjustment made little difference. Conjecturing from the Korean results, we expect that distortion due to this omission would not be substantial. These limitations notwithstanding, the model used in this study provides a framework that allows integration of the impact of demographic processes in the complex relationship that exists between education, health and support ratios.
Conclusion
Population ageing is a phenomenon that proceeds in tandem with socio-economic development (Lee and Mason Reference Lee and Mason2010). Changes in age structure are linked to changes in the configuration of the offspring's generation as well as in the configuration of the older generation. Older people will enjoy better health than before and offspring will have better capacity to provide support than before. Research on population ageing should account for this jointly changing process. The current study does this job by applying a demographic model that accounts for marriage, fertility and the intergenerational transmission of education (Kye et al. Reference Kye, Arenas, Teruel and Rubalcava2014). The cross-national comparison with Korea confirms the importance of taking into account demographic processes when analysing possible impacts of public policies aimed at expanding education on GSRs. The comparison also highlights that implementing a public policy focused on expanding the educational attainment of a sub-group of women will have a greater effect in terms of improving the health distribution of older adults in countries with selective access to health care (as opposed to countries with universal access to health care). The cross-national comparison also suggests that the way in which demographic factors matter in the final health distribution of older adults depends on societal context.
In terms of policy, increasing health-care coverage may seem an easier and faster strategy to improve the health of older adults, rather than policies focused on improving educational attainment. However, increasing coverage does not fixed the problem of the quality of services available for this population. Policies focused on the improvement of educational distribution are more likely to promote healthy lifestyles, self-sufficiency and economic independence of the population once they become old. In addition, these policies are likely to enhance the socio-economic position of the offspring that will provide care for them. Altogether, improvements in education may help the older population avoid marginalisation and poverty, which is a key problem in less-developed countries (Gutiérrez-Robledo Reference Gutiérrez-Robledo2002), with important consequences in terms of health. Policy discussions about future requirements of the older population need to rely on support ratios that take into account characteristics of older adults and of the offspring that will provide for them.
Acknowledgements
The first author greatly appreciates Esther M. Friedman for providing inspiring ideas for the approach taken in this study. Robert D. Mare and the Mare-Seltzer Research Group provided valuable suggestions. The authors are also grateful for financial support from the Korea Foundation.
Appendix
Multinomial logistic regression of marital status on women's education

Fertility and transmission models

Logit regressions of the association between women's education and health