What empirical evidence supports weight loss or weight gain as a symptom of depression in adolescents? The Diagnostic and Statistical Manual of Mental Disorders—Fourth Edition (DSM–IV) includes weight change (or appetite disturbance) as a criterion for major depressive disorder, describing this symptom as “significant weight loss when not dieting (e.g., a change of more than 5% body weight in a month), or increase or decrease in appetite nearly every day” (American Psychiatric Association [APA], 1994, p. 327). The only developmental qualification of this symptom is that one should “consider failure to make expected weight gains” when making this diagnosis in children (p. 327). At least two other developmental qualifications may also be relevant. One is that problematic attitudes about eating (if not eating disorders per se), which increase during adolescence and are highly correlated with depression, may confound the relation between depression and weight change. The second is that the normative weight-related changes associated with puberty are not appreciated by all adolescents, giving rise to a degree of body dissatisfaction and dieting behavior that may complicate the relation between depression and weight change during adolescence. In this paper, we address a series of questions: (a) is actual weight change related to depression in adolescence; (b) is the strength of this relation moderated by age; (c) is the relation between depression and weight change explained by normative changes in adolescent weight gain and/or individual differences in eating related attitudes, eating behaviors, or body dissatisfaction?
Why Might the Relation Between Weight Change and Depression Diminish During Adolescence?
One possibility is that weight change during adolescence is so driven by other (nondepression-related) factors that the effects of depression on weight are eliminated, or at least greatly obscured. Indeed, 50% of adult body weight is gained during adolescence (Lerner & Steinberg, Reference Lerner and Steinberg2004). A large part of this is because of typical developmental changes in metabolism and physiology. The hypothalamus and various hypothalamic neuropeptides not only regulate appetite, food intake, and weight gain (Fehm et al., Reference Fehm, Smolnik, Kern, McGregor, Bickel and Born2001; Jequier & Tappy, Reference Jequier and Tappy1999; Rosenbaum & Leibel, Reference Rosenbaum and Leibel1998; Swaab, Reference Swaab1997), but are also linked to the onset of puberty (Adam et al., Reference Adam, Moar, Logie, Ross, Barrett and Morgan2000; Plant, Gay, Marshall, & Arslan, Reference Plant, Gay, Marshall and Arslan1989; Terasawa & Fernandez, Reference Terasawa and Fernandez2001). Various endogenous reward systems linked to puberty and weight/appetitive regulation, including the serotonergic system, the dopaminergic system, the noradrenergic system, and endogenous opioids such as the endorphins and enkephalins (Neary, Goldstone, & Bloom, Reference Neary, Goldstone and Bloom2004; Stanley, Wynne, McGowan, & Bloom, Reference Stanley, Wynne, McGowan and Bloom2005), have been linked to weight change and food consumption. Changes in all these systems have been associated with puberty (Terasawa & Fernandez, Reference Terasawa and Fernandez2001).
Changes accompanying pubertal development are also associated with fluctuating levels of specific hormones, many of which also drive physical growth and weight change (Maxwell & Cole, in press). Pubertal changes in pituitary growth hormone, the gonadal hormones, the stress response, and leptin directly affect weight gain, especially body fat gain in females and muscle mass gain in males (Ahmed et al., Reference Ahmed, Ong, Morrell, Cox, Drayer and Perry1999; Terasawa & Fernandez, Reference Terasawa and Fernandez2001; Veldhuis, Roemmich, & Rogol, Reference Veldhuis, Roemmich and Rogol2000; Wade and Gray, Reference Wade and Gray1979). The weight and height growth seen in puberty is largely because of the increased release of pituitary growth hormone (GH). Veldhuis et al. (Reference Veldhuis, Roemmich and Rogol2000) state that the rate of GH release during puberty is more than double the rate of prepubertal release. Gonadol hormones, especially progestin, are most commonly linked to the development of sex organs; however, they are also associated with weight gain and increases in body fat (Wade & Gray, Reference Wade and Gray1979). Corticotropin releasing hormone (CRH) has also been associated with weight gain in cases of over expression activated during stress response (Bornstein, Schuppenies, Wong, & Licinio, Reference Bornstein, Schuppenies, Wong and Licinio2006). Stroud, Papandonatos, Williamson, and Dahl (Reference Stroud, Papandonatos, Williamson and Dahl2004) found that, over the course of puberty, the cortisol response to CRH increases for girls but remains relatively constant for boys. This efflux of cortisol has been linked with those metabolic changes associated with weight gain (Bornstein et al., Reference Bornstein, Schuppenies, Wong and Licinio2006). Low prepubertal levels of leptin in females are also predictive of subsequent gains in percentage body fat, with lower levels of leptin associated with greater fat gains (Ahmed et al., Reference Ahmed, Ong, Morrell, Cox, Drayer and Perry1999). Taken together, this research suggests a variety of hormonal and physiological pathways by which hormones may affect weight gain and loss across development.
Behavioral changes during adolescence further complicate the picture. The steepest age-related decline in physical activity occurs between ages 13 and 18, largely because of decreases in nonorganized sports and vigorous activity (Sallis, Reference Sallis2000). Furthermore, people consume more calories relative to their body weight during adolescence compared to any other time during the life span (Nance, Reference Nance1983). If adolescent weight change is largely controlled by normative developmental processes, the effect of depression on weight during this developmental period may be greatly reduced.
Why Might the Relation Between Weight Change and Depression Remain Significant During Adolescence?
In at least three ways, psychological and behavioral changes during adolescence may also help maintain the relation between depression and weight change. First, pubertal weight-related changes are not appreciated by all adolescents. Puberty is not only related to significant changes in height and weight but also an increased interest in body image (O'Dea & Abraham, Reference O'Dea and Abraham1999). Poor body image is especially common among adolescent females (Krahnstoever-Davison, Markey & Birch, Reference Krahnstoever-Davison, Markey and Birch2003; Sinton & Birch, Reference Sinton and Birch2006; Vander-Wal & Thelen, Reference Vander-Wal and Thelen2000). Kostanski and Gullone (Reference Kostanski and Gullone1998) found that 80% of adolescent females and 29% of males rated themselves as being two or more sizes larger than their ideal figure. Such body dissatisfaction is substantially related to depression (Paxton, Eisenberg, & Neumark-Sztainer, Reference Paxton, Eisenberg and Neumark-Sztainer2006; Paxton, Neumark-Sztainer, Hannan & Eisenberg, Reference Paxton, Neumark-Sztainer, Hannan and Eisenberg2006; Stice & Bearman, Reference Stice and Bearman2001). Second, during adolescence, body dissatisfaction frequently results in dieting and other attempts at weight change, with as many as 60% of adolescent girls and over 10% of adolescent boys being “on a diet” at any given time (Patton et al., Reference Patton, Carlin, Shao, Hibbert, Rosier, Selzer and Bowes1997; Paxton et al., Reference Paxton, Wertheim, Gibbons, Szmukler, Hillier and Petrovich1991). Ironically, such efforts often predict weight gain, not weight loss, in adolescents (Stice, Cameron, Killen, Hayward, & Taylor, Reference Stice, Cameron, Killen, Hayward and Barr1999), potentially exacerbating depression. Third, problematic eating attitudes associated with various eating disorders generally emerge in adolescence and are correlated with intense body dissatisfaction, unusual patterns of food intake, weight loss, and depression (Herzog, Reference Herzog1984; Hudson, Pope, Jonas, & Yurgelun-Todd, Reference Hudson, Pope, Jonas and Yurgelun-Todd1983; Walsh, Roose, Glassman, Gladis, & Sadik, Reference Walsh, Roose, Glassman, Gladis and Sadik1985). Thus, age-related changes in the correlation between weight change and depression may continue to exist during adolescence, but they may be due to “third” variables such as body dissatisfaction, dieting, or changes in eating attitudes.
What Does Prior Research Tell Us About the Relation of Weight Change to Depression in Adolescence?
A variety of studies provide preliminary evidence of a relation between weight change and depression in this age group (Friedman, Hurt, Clarkin, Corn & Aranoff, Reference Friedman, Hurt, Clarkin, Corn and Aronoff1983; Lewinsohn, Rohde, & Seeley, Reference Lewinsohn, Rohde and Seeley1998; Mitchell, McCauley, Burke, & Moss, Reference Mitchell, McCauley, Burke and Moss1988; Patton, Coffey, Posterino, Carlin, & Wolfe, Reference Patton, Coffey, Posterino, Carlin and Wolfe2000; Roberts, Lewinsohn, & Seeley, Reference Roberts, Lewinsohn and Seeley1995; Ryan et al., Reference Ryan, Puig-Antich, Ambrosini, Rabinovich, Robinson and Nelson1987; Sihvola et al., Reference Sihvola, Keski-Rahkonen, Dick, Pulkkinen, Rose and Marttunen2007; Sørensen, Nissen, Mors, & Thomsen, Reference Sørensen, Nissen, Mors and Thomsen2005; Strober, Green, & Carlson, Reference Strober, Green and Carlson1981; Yorbik, Birmaher, Axelson, Williamson, & Ryan, Reference Yorbik, Birmaher, Axelson, Williamson and Ryan2004; see Weiss & Garber, Reference Weiss and Garber2003, for a review). Overall, 15–50% (median = 32%) of adolescents with major depression report having experienced recent weight loss and approximately 0–42% (median = 23%) report recent weight gains. Upon closer examination, however, four key limitations of this research become evident.
First, the majority of these studies are based exclusively upon self-report measures of weight change. Instead of obtaining physical measures of weight, body mass, or body fat, researchers have simply asked participants questions such as whether their weight has increased or decreased lately, how much weight they may have gained or lost, or whether their clothes fit looser or tighter than they used to. This is problematic in that a growing literature clearly documents that self-reports of weight are substantially biased. Vartanian, Herman, and Polivy (Reference Vartanian, Herman and Polivy2004) found that dieters' and nondieters' weight estimates deviated from their actual weight by an average of 9.9 and 8.3 lb, respectively. In general, weight and body mass index (BMI) estimates by heavier individuals are less accurate than are estimates by lighter participants (Abraham, Luscombe, Boyd & Olesen, Reference Abraham, Luscombe, Boyd and Olesen2004). Himes and Faricy (Reference Himes and Faricy2001) found that the validity of adolescent self-reported height and weight was so variable across age and weight groups that they declared such measures to be invalid proxies for objective body measures in adolescents under 14 (see also Goodman, Hinden, & Khandelwal, Reference Goodman, Hinden and Khandelwal2000; Wang, Patterson & Hills, Reference Wang, Patterson and Hills2002).
Second, most studies were based on retrospective measures of weight change. That is, instead of measuring weight at two points in time and computing the difference, researchers asked participants to reflect back upon the degree of weight they had gained or lost over a specified period of time. This may be problematic for a number of reasons. Many people do not weigh themselves regularly enough to be able to answer the question objectively. Furthermore, under such circumstances, recollection of weight is likely to be affected by mood-congruent memory, self-serving response bias, and even current levels of psychopathology (Conley & Boardman, Reference Conley and Boardman2007; Vartanian et al., Reference Vartanian, Herman and Polivy2004).
Third, many studies of depression lump weight and appetite together into a single variable, perhaps because the DSM-IV (APA, 1994) treats these as alternative expressions of the same symptom (e.g., Flament, Cohen, Choquet, Jeammet, & LeDoux, Reference Flament, Cohen, Choquet, Jeammet and LeDoux2001; Yorbik et al., Reference Yorbik, Birmaher, Axelson, Williamson and Ryan2004). Consequently, the differential effects of depression on weight versus appetite are difficult to disentangle. Fortunately, other studies have examined weight change and appetite disturbance separately (Borchardt & Meller, Reference Borchardt and Meller1996; Friedman et al., Reference Friedman, Hurt, Clarkin, Corn and Aronoff1983; Mitchell et al., Reference Mitchell, McCauley, Burke and Moss1988; Patton et al., Reference Patton, Coffey, Posterino, Carlin and Wolfe2000; Roberts et al., Reference Roberts, Lewinsohn and Seeley1995; Ryan et al., Reference Ryan, Puig-Antich, Ambrosini, Rabinovich, Robinson and Nelson1987; Sørensen et al., Reference Sørensen, Nissen, Mors and Thomsen2005; Strober et al., Reference Strober, Green and Carlson1981; Yorbik et al., Reference Yorbik, Birmaher, Axelson, Williamson and Ryan2004). Based on these, we see that appetite decrease is a more common symptom of major depression in adolescence (prevalence rates range from 16% to 78%; median = 58%) than is weight loss (15–50%; median = 32%), and that appetite increase is less common (0–38%; median = 28%) than is weight gain (0–42%; median = 23%). Clearly, the composite symptom is not a good proxy for questions specifically about weight gain or weight loss.
Fourth, the DSM-IV encourages diagnosticians to consider the failure to make developmentally appropriate weight gains as symptomatic of depression, but very few studies of adolescents formally controlled for age-appropriate, normative weight change. Using height and weight to compute a BMI is not sufficient. Physical growth data reveal that the average change in BMI varies considerably by age and by gender during adolescence (Daniels, Khoury, & Morrison, Reference Daniels, Khoury and Morrison1997). Failure to correct change in BMI (or weight) estimates for age and gender norms can yield highly misleading results.
The current, 4-month, longitudinal study had three goals. First, we examined the relation of weight change to depressive symptoms in adolescents. Toward this end, we used multiple physical measures of weight, body mass, and body fat, as well as various self-report measures of body size and shape. Second, we examined the degree to which these relations are moderated by age and gender. Third, we tested whether or not these relations persist after controlling for (a) age- and gender-specific normative weight changes that can be expected over a 4-month interval during adolescence, (b) problematic eating-related attitudes and behaviors, and (c) concomitant body image/body dissatisfaction.
Most empirical work in this area has focused on already-depressed adolescents, which means that measures of weight change have been based on retrospective self-reports. To obtain longitudinal measures of weight change that are not affected by biases associated with retrospective self-reports obtained from currently depressed individuals, we focused on a community sample of nonreferred adolescents.
Methods
Participants
Letters explaining the study were sent to parents of all 6th- through 12th-grade, regular-education students attending one middle and one high school in a small suburban southern town. Research assistants also went to each classroom to explain the study and answer students' questions. Of the 508 students invited to participate, we obtained written parent and adolescent permission for 215 (42%) to take part in the study. Participants did not differ from nonparticipants on age, gender, grade, or ethnicity (ps > .20). Of the participants, 112 students were in middle school with an average age of 11.8 (SD = 0.78, min = 10.6, max = 13.6), and 103 students were in high school with an average age of 16.1 (SD = 1.2, min = 13.6, max = 18.6). The sample was 89% Caucasian, 7% African American, and 4% Hispanic. The sample was gender balanced (50.1% female). Four months elapsed between the two waves of this longitudinal investigation. During this time, we lost only 2 participants (<1%). In both cases, attrition was because of absenteeism that rendered data collection impractical.
Measures
Depressive symptoms
The Children's Depression Inventory (CDI; Kovacs, Reference Kovacs1981) is a 27-item self-report questionnaire assessing number and severity of depressive symptoms. Item responses range from 0 (no experience of the symptom) to 2 (frequent or intense experience of the symptom) over the last 2 weeks. The CDI has strong psychometric properties in both clinic and nonclinic populations, including a high degree of internal consistency, test–retest reliability, and construct validity (Cole, Hoffman, Tram, & Maxwell, Reference Cole, Hoffman, Tram and Maxwell2000; Smucker, Craighead, Craighead, & Green, Reference Smucker, Craighead, Craighead and Green1986). In the current study, the Cronbach α values were 0.89 in Wave 1 and 0.88 in Wave 2.
The Center for Epidemiological Studies-Depression scale for Children (CES-DC) is a child version of Radloff's (Reference Radloff1977) measure. The CES-DC is a 20-item self-report questionnaire designed to assess recent depressive symptoms. Respondents rate items on a 0–3 Likert-type scale where 0 indicates that a symptom is present rarely or none of the time and 3 indicates that it is present most or all of the time. The measure has good convergent validity and internal consistency (Cronbach α > 0.85; Radloff, Reference Radloff1977). In the current study, the α values for both waves were 0.89.
Correlations between the CDI and the CES-DC were .78 and .75 at Waves 1 and 2, respectively. To increase reliability of the depression measure and to reduce the number of analyses, we formed composites of the CDI and CES-DC by standardizing and averaging these scores. (Neither instrument contains items assessing weight change.)
Objective measures of physical change
We measured height using a Seca portable stadiometer. Participants stood barefoot with their backs to the measuring rod while research assistants recorded their height. We obtained two independent measures of height, using two different research assistants and two identical stadiometers. Reliability was very high for both waves (rs > .99). These estimates were averaged within wave. We measured weight on a digital Tanita scale (Model BF-522), which provided a digital readout of weight. Weight measures were obtained twice by different research assistants, using separate but identical Tanita scales. Interrater reliability was very high for both waves (rs > .99). These estimates were also averaged within wave. From these height and weight estimates, we calculated BMI by dividing weight (kg) by height (m) squared (BMI = kg/m2) for both waves.
The Tanita scale also provided a measure of body fat, using a bioelectrical impedance (BEI) technique. A safe, low-level electrical current is run through the body. Electricity flows through fat and muscle at different speeds, so the device can calculate a ratio of fat to muscle and other body tissue. Although hydration level has some effect on this measurement, the psychometric properties of BEI are adequate (Pateyjohns, Brinkworth, Buckley, Noakes & Clifton, Reference Pateyjohns, Brinkworth, Buckley, Noakes and Clifton2006). We measured body fat on two identical Tanita machines operated by different research assistants. Reliability was very high (r = .94 at Wave 1 and r = .93 at Wave 2). These measures were averaged within wave.
Because of the effects of hydration on BEI measurement, we also measured body fat using the Futrex 6100, which uses a near infrared (NIR) method that does not depend on water level. The Futrex 6100 emits a NIR light onto the bicep of the dominant arm. Body fat estimates are based on the amount of light reflected by lean mass versus that absorbed by subcutaneous fat. The NIR and the BEI measurements of body fat correlated .90 with each other.
Subjective measures of physical change
The Current Weight Questionnaire (CWQ), which was developed for this study, asks for students' numeric estimates of their own weight and height. Students who did not know their weight or height were encouraged to give their best guess. We converted weight into kilograms and height into meters. From these we calculated self-reported body mass index (BMI-SR) at each wave.
The Silhouette Assessment of Body Shape (SABS) provides an alternative self-report of body shape using an array of figure drawings specifically designed for a child and adolescent populations as per Byrne and Hills' (Reference Byrne and Hills1996) recommendations, figure drawings of younger children were used with middle school students, whereas drawings of older children were used for high school students. In both instruments, a total of seven male or female figures are arranged in order of increasing size from very skinny to very overweight (adapted from Collins, Reference Collins1991; Stunkard, Sørensen, & Schulsinger, Reference Stunkard, Sørensen and Schulsinger1983; Tiggemann, Reference Tiggemann2005). Beneath the figures was a horizontal line with equally spaced numbers ranging from 0 (thinnest) to 18 (heaviest). At both waves, students made an “x” on the line to indicate which silhouette best represents their current body shape. Marks that fall between anchor numbers received fractional scores based upon the measured distance. The seven silhouette version of this measure has good psychometric properties in adults, adolescents, and children (Ambrosi-Randic, Pokrajac-Bulian & Taksic, Reference Ambrosi- Randic, Pokrajac-Bulian and Taksic2005; Collins, Reference Collins1991). At Wave 2 only, we also administered a retrospective version of the SABS, asking to estimate their body shape at Wave 1 (4 months earlier).
Body image
We obtained three measures of body image and perceived physical appearance. One involved a set of silhouettes on which participants selected the body shape that they would ideally like to have. The subtraction of real body shape (SABS) from ideal body shape generates a Silhouette Assessment of Body Dissatisfaction (SABD) in which positive scores indicate that participants perceive themselves as overweight, negative scores indicate they perceive themselves as underweight, and zeros indicate that their real and ideal body shapes were the same.
A second measure was the appearance evaluation subscale of the Multidimensional Body–Self Relations Questionnaire (MBSQR; Cash, Reference Cash1994, Reference Cash2000), a self-report assessment of personal body image. The MBSQR was normed on a large, national sample (Cash, Winstead, & Janda, Reference Cash, Winstead and Janda1986). The measure has good internal consistency, with Cronbach alphas that range from 0.70 to 0.91 for males and 0.73 to 0.90 for females (Cash, Reference Cash1994). The appearance evaluation subscale measures self-perceived evaluation of physical appearance (e.g., “I like the way I look without my clothes on”). In the current study, this subscale had a Cronbach α of 0.82.
Third was the physical appearance subscale of the Self-Perception Profile for Adolescents (SPPA; Harter, Reference Harter1988). Each item asks students to choose which of two short statements about adolescents is true for them. Respondents then indicate if each selected statement is “really true” or “sort of true” about them. A sample item is “Some teenagers are not happy with the way they look” versus “Other teenagers are happy with the way they look.” In the current study, Cronbach α was 0.73.
These three measures correlated .42 to .52 with one another. Principal axis factor analysis revealed that the measures loaded .60 to .78 onto a common factor. To create a more reliable measure of body image, we standardized and averaged these three scales to form a single composite measure.
Eating attitudes
The Eating Attitudes Test (EAT-26) is an abbreviated form of the EAT-40, developed by Garner and Garfinkel in Reference Garner and Garfinkel1979 to measure self-reported deviant eating attitudes and behaviors. Both versions are widely used, and the .98 correlation between the two suggests they are nearly interchangeable (Garner, Olmsted, Bohr, & Garfinkel, Reference Garner, Olmsted, Bohr and Garfinkel1982). The EAT-26 comprises three subscales: food preoccupation and oral control, dieting, and bulimia. For the purposes of this study, a total score was calculated. Items are ranked on a 6-point Likert-type scales (1–6), reflecting the frequency with which respondents have problematic, eating-related thoughts and behavior. Research suggests a total score of 20 and over suggests a clinically detectable level of disordered eating attitudes and behaviors (Garner et al., Reference Garner, Olmsted, Bohr and Garfinkel1982). In the current study, full-scale reliability was high (Cronbach α = 0.89).
Normative weight change
We assigned expected weight and BMI change scores to each individual, based upon the norms published in the US Growth Charts from the National Center for Health Statistics, Centers for Disease Control and Prevention (http://www.cdc.gov/nchs/about/major/nhanes/growthcharts/datafiles.htm). We computed an expected difference score based upon each participant's gender and age. We used interval interpolation when participant ages fell between the tabled values.
Procedure
We first sought and received institutional review board and school board approval for our study. In accordance with our agreement with school administrators, we conducted two waves of data collection: the first near the beginning of the school year and the second 4 months later. We administered questionnaires one classroom at a time to students with signed parental consent forms. At Wave 1, research assistants provided an overview of the study procedures and obtained signed student assent forms. Participants then completed a questionnaire battery containing the CDI, CES-DC, CWQ, and SABS. After questionnaire completion, we asked students to remove their socks and shoes so we could obtain physical measures of height, weight, and body fat. Results of their measurements were not disclosed to the participants. At Wave 2, researchers reexplained the study procedures and reassented the participants. Participants completed a second battery that contained all the Wave 1 questionnaires plus the SABD, MBSQR-appearance evaluation, SPPA-physical appearance, and retrospective SABS. After questionnaire completion, students followed the same procedures as above for the Wave 2 physical measures of height, weight, and body fat. After completion of the study, all participants received a $10 gift certificate to a local movie theater.
Results
Preliminary analyses: Descriptive statistics and factor analyses
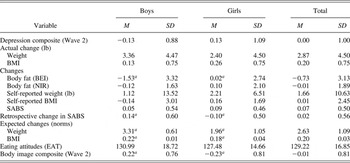
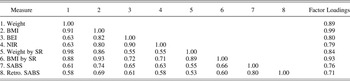
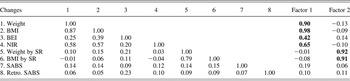
Means and standard deviations, broken down by school and sex of participant are summarized in Table 1. Correlations among the objective and subjective measures of weight, body mass, body fat, and body shape at Wave 1 appear in Table 2. All correlations were relatively large, ranging from .53 to .93. Factor analysis of these measures revealed a single strong factor with loadings ranging from 0.72 to 0.99 (see right column of Table 2), suggesting further evidence of a shared component between the variables. When we used these same measures to estimate change, however, a more complicated pattern arose. Table 3 contains correlations among change estimations based on these same eight physical measures. These correlations ranged from −.04 to .87 (with 25 out of 28 being less than .30). Oblique principal axis factor analysis revealed two factors (correlated .26 with each other). As shown on the right side of Table 3, the four objective measures loaded onto the first factor, the self-report measures of weight and BMI loaded onto the second factor, and the two SABS measures of change did not load onto either factor. The large disparities among these measures of change should be kept in mind throughout the following tests of our hypotheses.
Descriptive statistics for key study variables

Note: BMI, body mass index; BEI, bioelectrical impedance; NIR, near infrared; SABS, silhouette assessment of body shape; EAT, Eating Attitudes Test.
aThe gender difference in means was significant at p < .01.
Correlations and factor loadings for objective and subjective physical measures

Note: BMI, body mass index; BEI, bioelectrical impedance; NIR, near infrared; SR, self-report; SABS, silhouette assessment of body shape.
Correlations and factor loadings for objective and subjective measures of physical change

Note: Correlations > .18 were significant at p < .01. BMI, body mass index; BEI, bioelectrical impedance; NIR, near infrared; SR, self-report; SABS, silhouette assessment of body shape.
Are depressive symptoms correlated with weight change in adolescents?
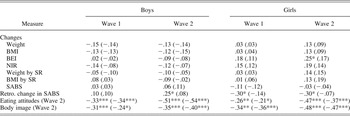
Table 4 presents the correlations between all measures of physical change with our depression composite at Wave 1 and Wave 2, broken down by gender. These correlations were small and largely nonsignificant. Only 4 out of 32 were statistically significant, and three of these involved the retrospective measure of body shape change, which was unrelated to all other measures of physical change. The only other significant correlation was for girls at Wave 2; girls who reported more depression at Wave 2 showed increases in body fat between Waves 1 and 2 on the BEI measure.
Pearson product moment and (Spearman rho) correlations of self-reported depression at Waves 1 and 2 with measures of physical change and related constructs

Note: BMI, body mass index; BEI, bioelectrical impedance; NIR, near infrared; SR, self-report; SABS, silhouette assessment of body shape.
*p < .05. **p < .01. ***p < .001.
Is the relation of depression to weight change moderated by age or gender?
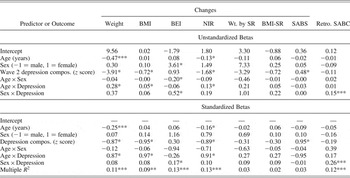
To address this question, we conducted a series of linear multiple regressions. In each, we regressed one measure of physical change onto our depression composite from Wave 2, age, gender, all two-way interactions, and the three-way interaction (Table 5). We focused on Wave 2 depression because this is more reflective of typical clinical diagnostic procedures, in which clinicians assess “current” depression by inquiring about symptoms such as weight change over the preceding weeks or months (conceptually similar to Wave 2 minus Wave 1 weight change; see DSM-IV-TR; APA, 2000). In every analysis, the three-way interaction was not significant; consequently, we deleted it from the model. The following results emerged from models that included all three main effects and all three two-way interactions.
Unstandardized and standardized beta weights from the regression of physical change measures onto age, sex, and depression and their interactions

Note: BMI, body mass index; BEI, bioelectrical impedance; NIR, near infrared; SR, self-report; SABS, silhouette assessment of body shape.
*p < .05. **p < .01. ***p < .001.
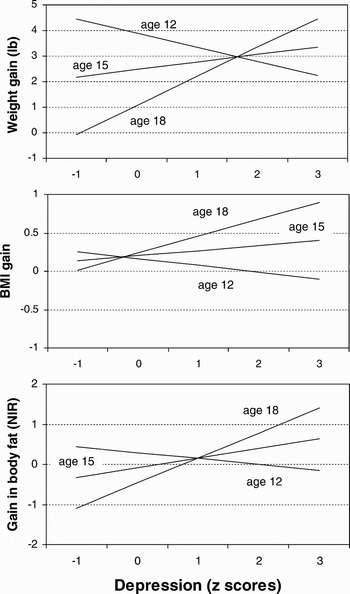
Of the eight regressions, five had significant multiple R 2s. Follow-up examination of the individual beta weights revealed two distinct patterns. The first pattern consisted of a significant Age × Depression interaction in relation to three of the four objective measures of physical change (actual weight change, change in BMI, and change in body fat measured by the NIR). In each of these interactions (depicted in Figure 1) depression scores were related to weight gain for older adolescents and weight loss for younger adolescents (i.e., they were negatively related to weight gain). Follow-up simple slope analyses revealed that the slopes for 18-year-olds were significant for all three physical outcome measures (ps < .01). For 12-year-olds, only the slope for weight change was significant (p < .02).
The relation of self-reported depression to three objective measures of physical growth: interactions with age; BMI, body mass index; NIR, near infrared.

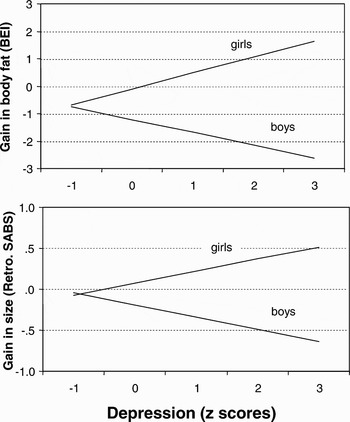
The second pattern consisted of a Sex × Depression interaction in relation to the BEI measure of body fat and the retrospective measure of body shape change on the SABS. In these interactions (depicted in Figure 2), depression scores showed a positive relation to physical gains for girls but a negative relation for boys (or, said differently, depression was related to weight gain for girls and weight loss for boys). Follow-up analyses of simple slopes for the BEI data revealed that the relation of depression scores to change in body fat was significant for girls (p < .018) but not for boys (p > .30). Identical analyses for the retrospective SABS data revealed that the relation of depression scores to perceived change in size was significant for both girls (p < .005) and for boys (p < .006), but in opposite directions. More depressed girls perceived themselves as having gained weight and registered as having actually gained in body fat on the BEI (but not on other objective measures of physical change). More depressed boys perceived themselves as having lost weight, a condition not supported by the BEI index of body fat (or any of the other physical measures).
The relation of self-reported depression to one objective and one subjective measure of physical growth: interactions with gender; BEI, bioelectrical impedance; SABS, silhouette assessment of body shape.

Do these relations persist after controlling for normative physical growth?
During adolescence, normative physical growth varies by gender and age. According to the US Growth Charts published by the National Center for Health Statistics, 12-, 15-, and 18-year-old boys at the 50th percentile would be expected to gain 1.66 kg (3.65 lb), 1.64 kg (3.62 lb), and 0.70 kg (1.54 lb), respectively. Expected gains for girls at the same ages are 1.44 kg (3.18 lb), 0.70 kg (1.54 lb), and 0.36 kg (0.80 lb). Growth rates in BMI have different trajectories. Consequently, we reanalyzed our data, controlling for the amount of growth expected for boys and girls according to their age in months. Specifically, we subtracted expected growth from observed growth for each boy and girl, such that the dependent variable became the individual's physical growth over and above the typical growth expected for someone of their age and gender. As US norms are not available for NIR, BEI, or subjective measures, we only reanalyzed our weight and BMI data. The pattern of results was essentially identical to our previous analysis of unadjusted weight and BMI. In both cases, the Age × Depression effect remained significant, closely resembling the pattern already depicted in Figure 1.
Are these relations explained by individual differences in eating attitudes and behaviors, or body image?
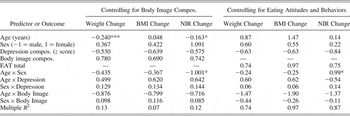
As shown in Table 1, substantial gender differences emerged in body image (d = 0.58). As shown in Table 4, our measure of body image and our measure of eating attitudes and behaviors were significantly correlated with self-reported depressive symptoms, such that higher depression scores were associated with less healthy eating attitudes and behaviors and worse body image. Consequently, we repeated all eight original regressions two times, controlling for either the EAT or the body image composite (as well as their interactions with age and sex). To check for colinearity among our variables we first correlated the EAT and the body image composite with each of our weight/body fat change scores. Correlations ranged between r = −.001 and −.129, none of which approached significance. In both sets of our linear regression reanalysis, three things were true. First, all previously nonsignificant effects remained nonsignificant. Second, the previously significant Age × Depression interactions for weight change, BMI change, and NIR body fat change became nonsignificant (see Table 6). That is, controlling for either variable eliminated the crossover interactions depicted in Figure 1. Furthermore, follow-up simple slope analyses revealed that the slopes for 12-, 15-, and 18-year-olds were all nonsignificant for all three physical outcome measures (ps < .10). Third, the previously significant Sex × Depression interactions for the BEI measure of body fat and the retrospective SABS remained significant (see Table 6). These interactions closely resembled those previously depicted in Figure 2. That is, depression scores were positively related to increases in BEI and perceived body fat for females; however, for males these relations were either negative (for retrospective SABS) or nonsignificant (for the BEI).
Standardized beta weights from the regression of physical change measures onto age, sex, and depression and their interactions

Note: BMI, body mass index; NIR, near infrared; EAT, Eating Attitudes Test.
*p < .05. ***p < .001.
Discussion
This is the first longitudinal study to examine the relation of depressive symptoms to actual (not just self-reported) weight change in adolescents. The pattern of results varied considerably with the method for measuring weight change. Overall, three major findings emerged from this research. First, the relation of adolescent depressive symptoms to change in objective, physical measures of weight gain was stronger for older adolescents than younger adolescents. Second, these age-related associations between depressive symptoms and objective measures of weight change persisted when we controlled for age and gender normative weight change, but dropped to nonsignificant levels when we controlled for body image or eating related attitudes and behaviors. Third, the relation of depressive symptoms to two other measures of weight change (one objective and one subjective) was stronger for females than males. Although these relations involved less valid measures of physical change, they remained significant even after controlling for body image and eating-related attitudes and behaviors. Implications of these findings are that (a) the use of weight change as a symptom of depression in adolescents is complicated by age, body image, and eating-related attitudes and behavior, and may not represent a very straightforward symptom of depression during adolescence; and (b) future studies should utilize objective measures of weight change, not self-report measures, as we continue to examine the complexities of the relation between depression and weight change in adolescents. We expand upon these findings and their implications below.
Our first finding was that the relation of adolescent depressive symptoms to physical measures of change in weight, body mass, and body fat is moderated by age. Among younger adolescents, these relations were either nonsignificant (in the case of body mass and body fat) or negative (in the case of weight). The negative relation signifies that greater depression was related to weight loss in younger adolescents, in a manner consistent with criteria for a major depressive episode (APA, 2000). Among older adolescents, however, a positive relation emerged between depressive symptoms and our physical measures of weight change. That is, higher levels of depression were associated with recent increases in weight, body mass, and body fat, a pattern characteristic of what the DSM-IV-TR calls atypical depression (APA, 2000). Both of these results persisted even after controlling for the normative amount of physical growth expected, given each individual's age and gender.
Our second finding, however, called the first into question; all of the previously described Age × Depression interactions diminished to nonsignificant levels when we controlled for individual differences in body image or eating-related attitudes and behaviors. To clarify, controlling for either one of these variables was sufficient to make the relation between our measures of depression and weight change nonsignificant. On a cautionary note, however, one cannot assume this nonsignificance implies a zero residual effect, despite the diminished relation between these variables. Furthermore, body image and eating-related attitudes and behaviors were significantly correlated with depression. This pattern of results suggests that the relation of depression to weight and body fat loss and gain in adolescence may be explained by various third variables such as eating-related attitudes and body image. Furthermore, body image and eating-related attitudes and behaviors may be more broadly symptomatic or characteristic of adolescent depression than is either weight loss or weight gain.
From relatively early in development, children are exposed to societal ideals for male and female body shapes (Ambrosi-Randic, Reference Ambrosi-Randic2000). Socialization processes almost inevitably result in some internalization of these ideals (Musher-Eizenman, Holub, Edwards-Leeper, Persson, & Goldstein, Reference Musher-Eizenman, Holub, Edwards-Leeper, Persson and Goldstein2003). Well-elaborated, hoped-for (thin), and feared (fat) possible selves begin to develop (Markus & Nurius, Reference Markus and Nurius1986). Research suggests that adolescents who feel pressure to be thin from their peers are more likely to feel dissatisfied with their bodies (Presnell, Bearman, & Stice, Reference Presnell, Bearman and Stice2004). Preadolescent boys and girls, who harbor a degree of body dissatisfaction, can at least look forward to adolescence as a time when natural developmental processes may transform their bodies into something closer to their hoped-for possible selves. Although body dissatisfaction can certainly exist in childhood, its relation to depression may be attenuated by a degree of hopefulness that typical physical maturation will eventuate in a physical appearance that is closer to one's physical ideals.
For some adolescents, however, the physical changes that accompany adolescence may not be commensurate with their hoped-for possible selves. Increased body fat may be especially distressing to adolescents who harbor well-elaborated, feared possibilities of themselves as fat, unattractive, unpopular, lonely, and so forth. Markus and Nurius (Reference Markus and Nurius1986) argue that the activation of such possible selves can be highly motivational. Dieting behavior and potentially problematic eating-related attitudes can emerge. Stice and Bearman (Reference Stice and Bearman2001) suggest that dieting may even mediate part of the relation between body dissatisfaction and depression because of the affective distress that often accompanies dieting failure (Koenig & Wasserman, Reference Koenig and Wasserman1995; Miller, Reference Miller1999; Stice et al., Reference Stice, Cameron, Killen, Hayward and Barr1999). Research also suggests that the relation between body dissatisfaction and depression may intensify with age (Eisenberg, Neumark-Sztainer & Paxton, Reference Eisenberg, Neumark-Sztainer and Paxton2006; Presnell et al., Reference Presnell, Bearman and Stice2004; cf. Paxton et al., Reference Paxton, Eisenberg and Neumark-Sztainer2006). Collectively, these findings suggest the psychology of body dissatisfaction may vary with age. What youth think and do about being over- (or under-) weight may change with pubertal status, with problematic attitudes toward food and unsuccessful weight control efforts being more proximally linked to adolescent depression than are weight gain or weight loss per se.
Our final finding was a gender difference. The relation of self-reported depression to an electrical impedance measure of body fat change and a retrospective self-report measure of perceived shape change was positive for females, but nonsignificant (or negative) for males. Even though these results withstood the effects of covarying body image and eating-related attitudes and behaviors, three facts lead us to interpret these results with a skeptical eye. First, they were not replicated by any of the six other objective and subjective measures of physical growth. Second, low correlations of the electrical impedance measure with our other objective measures suggested that it was the weakest of our four objective measures. Third, the retrospective self-report measure of change only correlated significantly with the electrical impedance measure of change, and that correlation was quite small. These findings are surprising given the relatively large correlations among the static (nonchange) versions of these measures. We tentatively speculate that the sensitivity of the electrical impedance measure to hydration may be partially to blame. At Time 2, individuals who were more hydrated or retaining more water would likely score higher on the electrical impedance measure and might also self-report feeling heavier than usual. Such time to time variation in water retention and discomfort may be more common in postmenarcheal females than same-age males. As such feelings can be related to mood, we posit that the current Gender × Depression effect on these measures may be due to monthly variations in mood and water retention, not depression and change in body fat (Chaturvedi, Chandra, Gururaj, Pandian, & Beena, Reference Chaturvedi, Chandra, Gururaj, Pandian and Beena1995; Englander-Golden, Whitmore, & Dienstbier, Reference Englander-Golden, Whitmore and Dienstbier1978; Fisher, Trieller, & Napolitano, Reference Fisher, Trieller and Napolitano1989; Lahmeyer, Miller, & DeLeon-Jones, Reference Lahmeyer, Miller and DeLeon-Jones1982). We hasten to add that these interpretations are completely post hoc. The underlying results require replication, and the hypothetical explanations for them must be tested.
Several shortcomings of the current study suggest avenues for future research. First, our focus on a community sample of adolescents was both a strength and a weakness of the current study. The advantages were (a) that we could obtain objective measures of weight change over the time interval about which most studies (and most clinicians) only obtain retrospective self-reported weight change, and (b) that we did not have to worry as much about comorbid disorders such as bulimia and anorexia that often complicate research with clinically depressed adolescent populations. We defend the decision to use subjects from the community by noting that correlations between symptoms and dimensional depression are typically quite consistent with correlations observed between symptoms and depressive disorder (Georgiades, Lewinsohn, Monroe, & Seeley, Reference Georgiades, Lewinsohn, Monroe and Seeley2006; Kessler, Zhao, Blazer, & Swartz, Reference Kessler, Zhao, Blazer and Swartz1997). A major disadvantage of using a nonclinical sample, however, is that weight gain and weight loss take time and may be evident only in people with more severe or more protracted episodes of depression. Future research could address the generalizability of our results to more severely depressed populations by monitoring weight change in adolescents who are at risk for depression (perhaps because of family history or presence of some depressive diathesis).
Second, the current study focused on adolescents (ages 11–19) and found some evidence of age-related difference in the relation between depression scores and objective measures of weight change. This relation brings into question the role of other important variables associated with age and development that may moderate the link between weight change and depression, including personality and biological variables, which deserve further study (Maxwell & Cole, in press). Other obvious next steps are to examine similar relations in both younger and older populations. In this paper, we have proposed a developmental model in which the psychology of body dissatisfaction varies with age, such that the relation of weight change to depression is more likely to be confounded by weight control and problematic attitudes toward food during adolescence, which can actually contribute to depression. This model raises many developmental questions, all of which warrant future research: (a) do children and adolescents differ in the ways that they think about or cope with body dissatisfaction? (b) Are these child and adolescent coping strategies differentially effective at least insofar as depression is concerned? (c) Should clinicians encourage different cognitive and behavioral strategies for dealing with weight and depression problems depending upon the age of the client?
Third, the current study leaves us wondering about our measures of weight change. Self-report measures of recent weight change are efficient and easily obtained, suggesting that research will continue to use them in the future. Furthermore, it is typically impossible for the clinician who suspects depression in a client to obtain objective measures of weight change over the last month or two. With the very weak correspondence between our objective and subjective measures of weight change, however, we have to ask what it is that self-report measures actually assess. Do they reflect some degree of actual weight change, or might they simply be indirect measures of body image, self-esteem, or depression-related cognitive distortion? The answers to these questions have implications for both clinical research and practice.