1 Reform of the tax on reversions of excess pension assets
In August 2006, the Congress passed, and President Bush signed, the Pension Protection Act (PPA). This new law addressed almost all aspects of practice affecting defined benefit (DB) pension plans, except for the penalty tax on excess asset reversions. Policy logic suggests, however, that the reversion tax also be considered as part of any broad reform.
The PPA requires DB plan sponsors to tend to any underfunding more quickly, steadily and completely than ever before.Footnote 1 The new requirements are expected to reduce losses of accrued benefits to plan participants and losses to the Pension Benefit Guaranty Corporation (PBGC) for guaranteed benefits from underfunded plans of failed sponsors. Stated another way, the new law holds plan sponsors more accountable for their obligations to pension participants. That being the case, the setting of compatible incentives would call for allowing plan sponsors to draw upon – after paying appropriate taxes – excess pension assets when plan obligations are adequately secured. Otherwise, the cost of sponsoring DB plans will be unnecessarily high. Moreover, as many plans become better funded, and indeed under most common investment policies, overfunded, excess assets will build up but be locked in the plans.Footnote 2,Footnote 3 The federal government in particular may lose the considerable revenues it could otherwise collect if taxes were paid on asset reversions.
This study establishes a theoretical model to reflect corporate behavior and simulates the dynamics of DB pension assets and liabilities. It quantifies the possible consequences to stakeholders if a lower excise tax is imposed on reversions of excess pension assets in the PPA era. The analysis shows that a more moderate excise tax rate together with a reasonable funding threshold for asset reversions would not only enable sponsors to spend the excess funds on other corporate needs, thereby lowering the cost of sponsorship of DB plans, but also would open a considerable revenue source for the government, with only a small increase in bankruptcy cost for the PBGC. Plan participants could also gain in an alternative reform, which would require a partial transfer of excess assets to them along with a still-lower reversion tax rate. These findings also hold for plan sponsors with various degrees of risk tolerance or only making the PPA-required minimum contributions, which is a likely strategy for some sponsors who anticipate no gain currently from accumulating excess assets in their DB plans.
2 Current law on the taxation of excess asset reversions
Generally, under current law, employers may withdraw assets from a pension plan only after terminating the plan, which requires the sponsor to satisfy all liabilities and vest all accrued benefits fully and immediately (one exception is explained below). Reversing the favorable tax treatment accorded to employer contributions, these withdrawals are subject to corporate income taxes (currently the federal income tax rate is 35% and some states charge their own corporate income taxes). The federal government also imposes an excise tax, partly to recover the tax-free buildup accumulated through investment returns on plan assets. This excise tax, however, is also a penalty tax, as explained in the next section, reflecting the historical view that excess asset reversions from pensions to plan sponsors were wrong and subject to corporate abuse.
The excise tax rate is 50%. It drops to 20% if the sponsor allocates a portion of the reversion to plan participants, either by benefit improvements immediately before plan termination or by funding new benefits under another tax-qualified retirement plan, or if the plan sponsor is in bankruptcy proceeding. Assets transferred to participants in another plan must equal at least 25% of the potential reversion. The qualified replacement plan must cover at least 95% of the active participants in the terminated plan who remain employed with the sponsor. If the replacement plan is a defined contribution (DC) plan, the transferred assets must be allocated within 7 years and are subject to the Internal Revenue Service (IRS) dollar limits on DC plan contributions. If the sponsor allocates assets to participants by increasing benefits before plan termination, it must spend at least 20% of the reversion value on the benefit improvements. This must be done on a pro rata basis for all active and most inactive participants.
In any case, whether the excise tax rate is 50 or 20%, the plan sponsor realizes very little net gain from an excess asset reversion after paying corporate income taxes, any transfers to participants and other transaction and termination expenses.Footnote 4 Not surprisingly, such transactions have ceased to occur.Footnote 5
In one notable exception to the prohibition against asset reversions from an active pension plan, sponsors may transfer pension plan assets on a tax-free basis to a retiree medical account that is set up as a separate account of the plan. Under section 420 of the Code, as amended by the PPA, an employer may transfer excess pension assets to retiree medical accounts to fund the expected cost of retiree medical benefits for the transfer period of the current year and up to 9 (and at least 1) future year(s). The law defines excess pension assets as assets in excess of 120% of the target liability for funding purposes; moreover, the sponsor must maintain this funding status during the transfer period. In a qualified transfer, benefits accrued under the pension plan must be fully and immediately vested and the employer must meet a standard of no reduction in the average amount of employer cost for retiree health benefits for current year and the following 4 years. Alternatively, the law allows a more limited year-by-year asset transfer for plans that are at least 125% funded (this alternative does not require a particular sustained funding status for the pension plan beyond normal compliance with the funding rules; it does, however, require a 5-year maintenance-of-effort for the retiree medical plan).
3 History of the excise tax
In the early 1980s, interest rates were unusually high, thus increasing corporate borrowing costs and decreasing pension liabilities, which are the discounted present value of accrued benefits. This, in concert with a strong stock market, pushed many plans well beyond full funding. Some plan sponsors responded by terminating their plans, retrieving the excess pension assets (after paying corporate income tax) and setting up replacement retirement plans. A few of these sponsors and plan terminations were involved in highly publicized ‘corporate raider’ takeovers.
In 1984, the federal pension regulatory agencies required sponsors of terminating plans to buy immediate or deferred life annuities from insurance companies for plan benefits to protect employees from market fluctuations.Footnote 6 The Tax Reform Act of 1986 levied a 10% excise tax on excess asset reversions. But reversions continued, with controversy, so Congress stepped up the tax rate to 15% in 1988 and to 50% in 1990.
Although the link in the public mind between reversion and unpopular takeover and leveraged buyout activity was one reason for the increasingly punitive excise tax, proponents cited two other, more benefit-related, reasons for the increases. First, they claimed that reducing the cushion of excess assets would make benefits less secure, exposing both plan participants and the PBGC to larger losses. Although this claim may have had some validity when funding rules were weaker, its advocates did not counter-propose to allow reversions if funding was above a highly conservative level of, say, 150% of plan liability.
Second, supporters of harsher reversion penalties insisted that any excess assets either be reserved for benefit improvements or be paid directly to plan participants. This ‘tails I win, heads you lose’ attitude may have made strategic sense for long-term labor–management relations, given the stigma once attached to terminating or freezing a DB plan. That stigma, however, has since disappeared, as it has become common for even highly profitable sponsors to freeze their DB plans. Moreover, this attitude, embodied in legislation, does not endear DB plans to their sponsors and, it may be argued, leads ironically to lower funding and, likely, to declining DB plan sponsorship. Ippolito (Reference Ippolito2001) has shown empirically that the higher excise taxes on asset reversions played a significant role in reducing pension overfunding through the 1990s; this reduction, in turn, left plans exposed to the decline in discount rates and equity values in the early 2000s.
Nevertheless, the political arguments against asset reversions are powerful and were used successfully in the past to beat back attempts to pass reforms. They held sway in 1996 against a proposal to lower the excise tax to 6.5% and to allow reversions, even without plan termination, if funding was at 125% of liability. The risk of an adverse political reaction also convinced the Bush Administration to leave a change of the tax on excess asset reversions out of its comprehensive 2005 pension reform proposal.
4 Determination of ‘fair’ value for the excise tax
As noted above, some share of the excise tax fairly recaptures the portion of the reverted pension assets that arises from preferential tax treatment. The General Accounting Office (GAO, 1989) randomly selected and reviewed 18 out of a universe of 202 reversions for $1 million or more that terminated or announced their intention to terminate in 1988. It constructed a simulation model to calculate an appropriately offsetting excise tax rate for each case. The rate was determined as the one that would have left sponsors no better off financially than if the surplus assets had earned the pension fund's pretax rate of return through some alternative, non-tax-favored non-pension use. The GAO considered various assumptions for the sponsor's marginal corporate income tax rate necessary for the calculation, including the statutory and the (lower) average effective corporate tax rates.
The GAO reported that the excise taxes required to recapture the tax benefits from excess pension assets ranged from −7 to 84%, with medians (depending on the specific corporate income tax rate used) at 24 or 29%. The highest excise tax rates were for plans primarily invested in bonds, which are highly taxed in non-pension corporate accounts, and the lowest were for plans primarily invested in equities. Presumably, with tax rates on equity investments lowered since 2003, and most pension plans predominately invested in equities, equivalent ‘fair’ tax rates would be lower nowadays. Of course, the fair tax rate would be altered upward slightly if plans follow the more recent trend to lower equity investment.
Although not reported by the GAO, it is possible to calculate an average tax rate, weighted by plan excess assets in the 18 cases, under the GAO's 1989 assumptions. Employing the effective corporate income tax rate in the calculation, the resulting fair excise tax rate, on a weighted average basis, is 19%. The weighted average is a more appropriate estimate of the tax revenue lost to the favorable tax treatment accorded to pensions, so 19% is more reasonable to use as the fair rate.
5 Comparison to Canada
A comparable situation to the United States exists in Canada. If a sponsor wants to terminate (‘wind up’) its pension plan, it must, at least in Ontario and some other provinces, receive the consent of plan participants on the disposition of excess assets. This is done through negotiations, arbitration or court proceedings. In practical terms, the outcome is the imposition of ‘tax’ from the viewpoint of the plan sponsor. Moreover, owing to the Monsanto decision by the Supreme Court of Canada in 2004, the requirements for consent, etc. apply even in the case of a partial wind up, where only a portion of the work force is laid off (see Watson Wyatt Worldwide (2004) for more details).
6 Funding prospect of post-PPA pension plans
There are three major forces that will drive the improvement in the funding status of DB plans going forward. The first and most fundamental one is the new PPA funding rules. The PPA 7-year amortization schedule (or faster 6-year schedule for some severely underfunded plans) together with the normal cost contribution and limited use of credit balances mandates sponsors to contribute funds as necessary, and effectively form a lower support for the funding ratio as long as the sponsors are in business operation. Moreover, because contribution limits have been liberalized by the PPA, plan sponsors may well choose to set a higher funding target owing to a precautionary purpose and thus contribute more than this PPA-required minimum. The second force is the investment return. Many plans hold a substantial fraction of their assets in a growth investment portfolio, which implies opportunities to realize the equity premium, while the downside risk, from the perspective of plan participants, is mitigated by the new PPA funding rules. This investment-led asset buildup may take place for ongoing plans and, especially, for frozen or shrinking pension plans with no benefit accrual, because in many of these cases the growth of assets is likely to exceed that of liabilities and hence helps build excess assets. The third force is the asymmetry regarding asset disposals between underfunding and overfunding under the current law. That is, plan sponsors have to contribute whenever there is a funding shortfall, but excess assets will remain locked in the plan and thus continue to compound if the punitive reversion taxes under current law and the administrative costs of plan terminations continue.
7 Reform proposals
The proposals for reform of the excise tax regime examined here key off parameters in current law, as any legislative proposals likely would. They recognize the improved funding rules and current pension environment, including plan freezes, the dearth of new DB plans and fewer significant benefit improvements. The first proposal has a lower excise tax rate at 20% and would allow excess asset reversions for plans funded at least at 120% of their liabilities. As in current law, sponsors would have to fully vest accrued benefits, though they would not have to terminate their plans.Footnote 7 The proposal's intent is to lower the cost of sponsoring a DB plan and raise revenue for federal government, while securing plan participants' benefits.
Alternatively, we model two other proposals. One would require a funded status of at least 125%; the other would impose a 15% excise tax and require a 10% transfer to participants. Also, the main proposal and the two alternatives go with a lower excise tax rate – 15% – on asset reversions in bankruptcy, instead of the 20% under current law.
In the final report (2007) of the ‘Conversation on Coverage’ organized by the Pension Rights Center, the working group on DB plans recommended a new type of hybrid plan. As part of this suggestion, the group advocated for a ‘Side-Car Trust’ to increase funding flexibility, which would allow for employer withdrawals subject to income tax and a 12% excise tax, as long as the plan is at least 110% funded. Although there are some other slight differences in conditions and terms from the proposal examined here, it is worth noting that the Conversation on Coverage group is more generous to plan sponsors.
8 Methodology for analysis of the proposalFootnote 8
We first lay out the dynamics of pension assets. Let A t denote the market value of pension assets in year t, R t gross return on investment, P t annual benefit payout, and X t contributions to pension plans if X t>0 or assets reverted back to plan sponsors if X t<0. Then pension assets evolve according to equation (1) below:

For simplicity, assets are assumed to be invested in two classes: equities with fraction αt and bonds with (1−αt), and hence, R t+1=αtR t+1e+(1−αt)R t+1b, where the gross returns of equity and bonds, R te and R tb, respectively, are assumed to be log normally distributed.
The dynamics of pension liabilities are expressed in equation (2) below:

where L t denotes the pension liabilities accrued as of year t. The liabilities are generally measured as the net present value (NPV) of future benefit payouts and they accrue interest at discount rate r td. As the discount rate has a significant impact on the NPV calculation, the term −Δr t+1d is used to reflect the impact of its changes multiplied by the liability duration D. A small percentage swing in the discount rate often results in a large increase or decrease in liabilities because the duration is typically long. The parameter φt indicates the growth rate of pension liabilities that are associated with the normal cost or annual gross benefit accrual.
To compare the reform proposal with the current law, we establish metrics to measure sponsors payoff from funding status outcomes and contribution/reversion decisions. This analysis assumes that plan sponsors benefit from higher rather than lower funding levels, which is consistent with the observation that sponsors generally care about their company image, in both financial and labor markets, and they value ease in workforce–management relations. In addition, under the PPA, sponsors of well-funded pension plans gain considerably more flexibility in funding and benefit policy changes compared to sponsors of ‘at-risk’ poorly funded plans. In the model, plan sponsors try to improve current funding status, when necessary, also considering expected future funding outcomes given the uncertainty of investment returns and liability valuations.
Specifically, let s t=A t/L t be the funding ratio. The sponsor's payoff U t from the funding status can be defined in a recursive pattern in equation (3) below:

where η is elasticity of intertemporal substitution (EIS) – a smaller value implies a stronger desire for smooth rather than large and volatile year-to-year changes in funding ratios, ρ is the coefficient of relative risk aversion (RRA), which indicates a sponsor's reluctance to take risks regarding future uncertain funding outcomes, β is the rate at which sponsors discount future expected payoffs, and E t is the expectation operator over future payoffs. This class of functional forms was first introduced by Epstein and Zin (Reference Epstein and Zin1989) and is used widely in academic research in financial economics.Footnote 9
A well-defined maximization problem generally requires a budget constraint. It is, however, a formidable task to model the complex corporate revenue-generating process and the optimal revenue split between a pension plan and operating capital needs. We therefore take a shortcut. We assume that corporations have unlimited capacity to make contributions as needed, but that contributions are not without cost. That is, contributions yield negative payoff to sponsors, while assets reverted give a positive payoff.
Consistent with current law, the model incorporates the asymmetrical taxation of contributions and asset reversions. Specifically, contributions are tax-deductible at the corporate income tax rate. Reversions are subject to the excise tax in addition to the income tax. Let z t be contributions or reversions net of all taxes applicable, expressed as a fraction of liabilities. The payoff function of contributions/reversions is defined below:

We impose restrictions γ1<1 and γ2>1 for the following reasons: (1) the marginal gain from asset reversions is generally diminishing, hence, γ1<1; (2) the marginal cost of contributions is increasing, hence, γ2<1, which implies that a steady flow of moderate contributions is more desirable than a bumpy flow. These two conditions ensure that the payoff function in (4) is globally concave over all values of contributions and reversions. This technical subtlety has an important implication here: plan sponsors are committed to pension liabilities and have no intention of abandoning an underfunded pension plan, i.e., exercising the pension put option (Sharpe, Reference Sharpe1976). That is, they remain risk-averse and continue to try to remedy any underfunding, rather than switch to a risk-tolerant behavior and bet on high asset returns, as would be otherwise implied by γ2<1.
This commitment assumption entails little loss of generality. First, the betting behavior, if considered as an option by some financially distressed plans prior to any reversion tax reform, would unlikely be triggered or intensified by such a reform because the reform only releases excess assets when the pension plan is overfunded. Second, there is mixed or even opposite empirical evidence for this theoretically plausible ‘put’ behavior. For instance, a recent study by Rauh (Reference Rauh2007) finds that poorly funded DB plans tend to follow a more conservative investment portfolio while the well-funded plans invest more heavily in equities. This phenomenon is presumably due to the ‘risk management’ strategy – plan sponsors, who face mandatory pension contribution obligations imposed by laws and therefore have risk of incurring pension-induced financial distress in non-pension operations, may well have the incentive to limit risk taking in pension plans.
The plan sponsor's problem in each period is to choose the optimal contribution or reversion so as to maximize the total payoff defined as the sum of equations (3) and (4), i.e., the objective function in equation (5) below:

As no analytical solution to the model exists, numerical methods are used. The computation begins by discretizing the continuous-state variables (assets and liabilities). The maximization problem is then solved from the last period backward to the first period for all possible combinations of state grid points and realizations of random variables (equity-bond returns and pension discount rates). Given the optimal decision rules recorded along this backward process, a large number of Monte Carlo simulations are finally carried out to generate the best actions (contribution or reversion) for sponsors from the first period forward to the last period of the analysis.
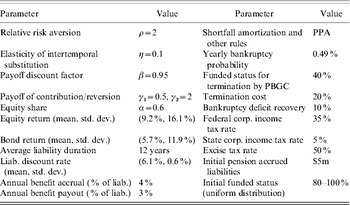
Before displaying results, a further explanation of the specific parameter values listed in Table 1 is appropriate here. The value of relative risk aversion ρ=2 is borrowed from the household investment and consumption literature, but its value is at the lower end of the range because corporations are generally more risk-tolerant than individuals. Plan sponsors desire a smooth change in funding status, with η=0.1, that is, they try to fill any funding gap, often contributing more than the minimum required contribution to that end, but do so gradually. The discount rate for future payoff in equation (3) is set equal to the rate of liability interest accrual, i.e., β=0.95, being the reciprocal of average gross bond return. The payoff parameters (γ1=0.5 and γ2=2) in equation (4) are set to mimic the behavior of a responsible sponsor, as stated above.
Benchmark Assumptions

Source: Authors' assumptions based on data, literature and current law.
In our base case, we assume that the plan sponsor invests plan assets in a consistent and constant proportionality of 60% equities and 40% bonds. Although plans do verge from this average mix, over time and across plan situations, it is nonetheless a good approximation of the central tendency of most pension funds in most time periods. Both academics and consultants have urged plan sponsors generally to move toward a liability-directed investment strategy, which generally means more and longer-term bonds, but many plan sponsors feel strongly that they want to capture the equity premium. Indeed, even the strongest academic advocates of ‘immunization’ acknowledge that if a pension plan, sponsored by a healthy profitable risk-tolerant employer, is an ongoing, growing, and long-term retirement vehicle, then higher return and risk investments like equities can be part of the fund mix. Nevertheless, in our simulations below we also consider alternative investment approaches with higher proportions in lower return and risk investments like bonds, either on a dynamic or static basis.
The distributions of nominal yearly equity return (mean 9.2% and standard deviation 16.1%) and bond return (mean 5.7% and standard deviation 11.9%) are based on Watson Wyatt January 2007 US Asset Return Assumptions, which are in turn derived through a blend of economic theory, historical analysis and the views of investment managers. The distribution of pension liability discount rates (mean 6.1% and standard deviation 0.6%) is estimated on composite corporate bond rates from 2001 to 2007 drawn from the IRS data. The duration of liabilities (12 years), the nominal annual benefit accrual rate (4% of liabilities) and the annual benefit payout (3% of liabilities) are largely consistent with many US pension plans.
The model incorporates the new funding rules imposed by the PPA. Specifically, sponsors of plans that are at least 70% funded have 7 years to amortize any shortfalls. Less well-funded plans must amortize shortfalls at a faster pace – 6 years in the model. If the funding ratio drops below 60%, the plan will be frozen and benefit accrual will cease. If the value of plan assets reaches the sum of liabilities plus normal cost, the amortization base automatically resets to zero. Under the PPA, the minimum required contribution is the shortfall amortization charge plus the target normal cost (that is, the value of benefits accrued during the year).Footnote 10 Plan sponsors may contribute more than the minimum contribution, up to an additional funding cushion of 50% of liabilities. This range of contributions is fully tax-deductible, and we assume corporations always have the capacity to make contributions unless they are in bankruptcy.
We also assume that sponsors of both well- and underfunded plans face an exogenous bankruptcy shock of 0.49% probability per annum, which is based on Moodys global analysis of the default probability for issues of corporate bonds rated Baa for 1920–2005. In bankruptcy, plan assets and liabilities are transferred to the PBGC, which bankrolls the gap between assets and 120% of liabilities if the plan lacks sufficient assets. The extra 20% cost is for ‘pop-up’ benefits and administrative costs in a terminating plan situation. The PBGC usually recovers an average of 10% of the deficit from the bankrupt sponsor's corporate assets, so we make that assumption. We assume that plans whose funding falls below 40% undergo a forced termination by the PBGC, and the PBGC is responsible for funding the plan up to 120% of liabilities, using the same procedure as in bankruptcy.Footnote 11
Under current law, asset reversions are subject to possible alternatives, as stated above. Rather than coding all the regulatory details in the model, we assume that reversions in the benchmark must pay 50% excise tax and the federal and state corporate income taxes, at 35 and 5%, respectively. Miscellaneous market and administrative costs associated with a plan termination amount to another 20%. This approach, though slightly sketchy, is consistent with the reality that plan sponsors currently realize very little from a reversion. These extra costs cease to be applicable in the reform proposals, because they would neither require plan termination nor restrict the use of assets reverted.
9 Results from simulations
Without loss of generality, we consider a single pension plan with initial liabilities of $5 million and a wide range of initial funding statuses: the market value of plan assets being 80–100% of liabilities, uniformly distributed. We run 10,000 simulations, each corresponding to a 40-year path of stochastic outcomes of assets and liabilities. For the practical policy interest, we limit the statistics shown to the first 20 years of the analysis. The results on the single plan may be aggregated, with further modest assumptions, to yield economy-wide meanings. We report the effect of the proposals versus current law.
We report separately the results for ‘payoff-maximizing’ plans, which make optimal contributions or reversions, when applicable, to maximize the objective function (5), and the results for ‘contribution-minimizing’ plans, which make only the PPA-required minimum contributions in the case of underfunding and still optimize the excess asset reversions in the case of overfunding. We then further explore alternative situations by changing some of the key assumptions. Sensitivity tests are conducted to check our assumptions of parameter values.
9.1 Results for payoff-maximizing plans
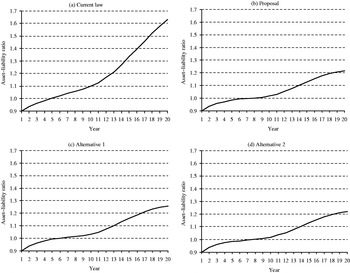
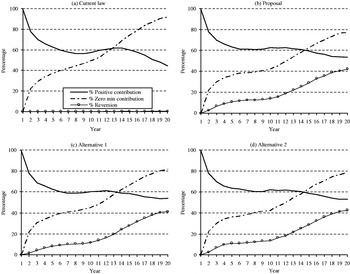
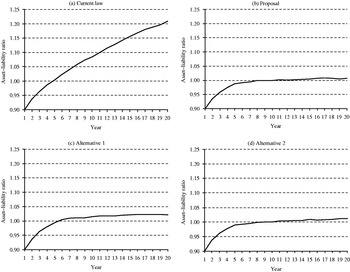
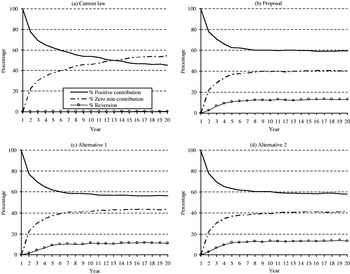
We first report the benchmark results for payoff-maximizing pension plans under current law. The simulations show that the average asset–liability ratio will likely rise to above 1.6 in 20 years (Figure 1a). Several factors drive this steady improvement: (1) the PPA's 7-year amortization schedule (or faster 6-year schedule for some underfunded plans) together with the normal cost contribution mandates that force sponsors to contribute funds as necessary and effectively forms a lower support for the funding distribution–indeed, the PPA-required minimum contributions alone would push the funding ratio to over 1.2 in 20 years (Figure 3); (2) the plan sponsor values a healthy funding status and hence will contribute more than the PPA-required minimum – Figure 2a shows the percentage of scenarios in the 10,000 simulations in which positive contributions are made (solid line), along with the percentage of scenarios in which no contributions are required at all (dashed line); (3) the constant 60/40 split between equity and bond investments implies opportunities to realize the equity premium; and (4) excess assets remain locked in the plan due to the punitive reversion taxes and thus returns continue to compound – the only excess asset reversions occur in bankruptcy (circled line in Figure 2a).
Average funding ratios – payoff-maximizing plans Source: Authors' simulations.

Distributions of contributions/reversions – payoff-maximizing plans Source: Authors' simulations.

The reform proposal allows the sponsor to withdraw excess assets if plan funding tops 120% of liabilities. This would lower the average funding ratio, but still slightly above 1.2, in 20 years (Figure 1b) – because it would be in the interest of plan sponsors to withdraw excess assets when the payoff is positive net of the lower-than-before reversion tax. In Figure 2b, the dashed line indicates the percentage of fully or over-funded outcomes in all the simulations. Approximately half of those outcomes are associated with excess asset reversions, as indicated by the circled line in the figure.
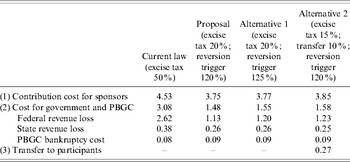
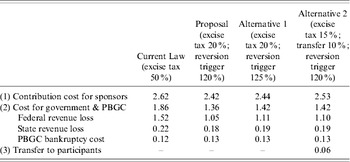
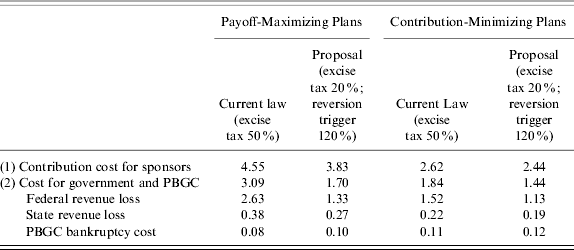
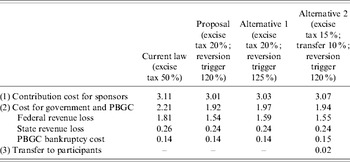
At first glance, the lower funding ratios might suggest that the reform is not a good idea. This impression is soon dispelled, however, by examining the redistribution of the excess funds. Table 2 reports the breakdown of costs or benefits among plan sponsors, the government, the PBGC and plan participants, with all numbers calculated as present discounted values over 20 years and averaged over the 10,000 simulations.
Redistribution of excess assets – payoff-maximizing plans ($millions, PDV)

Source: Authors' simulations.
The net contribution cost for a plan sponsor equals all contributions after income tax deduction minus all reversions net of income and excise taxes.Footnote 12 This cost reflects the true financing burden for DB plan sponsors, taking into account mandatory obligations and potential benefits. The simulations show that the net contribution cost for sponsors averages roughly $4.5 million under current law ($7.7 million before tax deduction), while asset reversions under the proposal help whittle the cost to roughly $3.8 million (albeit larger gross contributions – $8.5 million – before tax deductions and reversions).
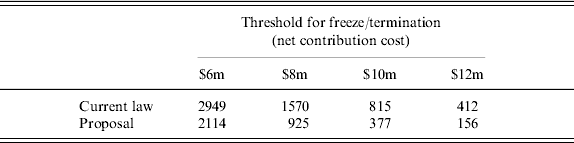
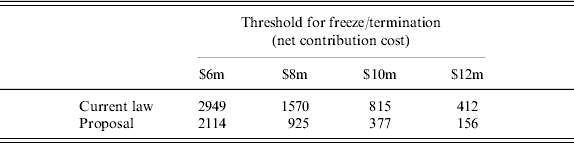
An alternative angle to look at the impact of the cost reduction is the number of possible plan freezes or terminations implied by the net contribution cost. It is probably reasonable to expect that a plan sponsor would be more likely to freeze or terminate its plan if the sponsoring cost exceeds a certain threshold acceptable to the sponsor. As shown in Table 3, such likelihood would be significantly reduced under the reform proposal. Take the $8 million threshold as an example; while about 1,570 out of 10,000 plans may be frozen or terminated under current law, the number would be reduced to about 925 plans under the proposal because the sponsoring costs are mitigated significantly by excess asset reversions.
Number of possible plan freezes/terminations – payoff-maximizing plans (out of 10,000 simulations)
Source: Authors' simulations.
The government loses tax revenue on plan contributions and recovers it partially or completely through income and excise taxes on reversions. In Table 2, the net costs under current law are roughly $2.6 million for the federal government and $0.4 million for state governments. Under the proposal, the net costs would be about $1.1 million for the federal government and $0.3 million for state governments. Allowing asset reversions would divert more revenue to the government.Footnote 13
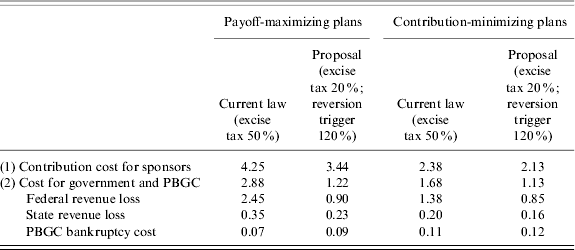
The proposed reform would imply slightly higher contingent liabilities to the PBGC: average plan termination costs associated with bankruptcies or forced terminations would be approximately $0.09 million under the proposal, compared with roughly $0.08 million under current law. (It is, however, worth noting that if plan sponsors expect no gain from overfunding and so choose to contribute only the minimum required, the average bankruptcy cost would go even higher – about $0.12 million (Table 5).) The total loss for the government and the PBGC would be $1.5 million under the proposal, less than half of the $3.1 million under current law. In short, the proposal would turn out to be a Pareto improvement if the government and the PBGC were treated as an integrated entity; all stakeholders gain from this change.Footnote 14 In the least, the proposal would be a Kaldor–Hicks efficiency improvement if one argues that the PBGC technically does not have full-faith-and-credit of the federal government and thus should be considered separately.Footnote 15
Redistribution of excess assets – payoff-maximizing plans ($millions, PDV)

Source: Authors' simulations.
Redistribution of excess assets – contribution-minimizing plans ($millions, PDV)

Source: Authors' simulations.
We also considered a higher funding trigger under Alternative 1–125% – for any asset reversion. Compared with the above proposal, this would yield higher asset–liability ratios for most years (Figure 1c), with the gain ranging between 0 and 5 percentage points on average; correspondingly, the fraction of plans overfunded is slightly higher and the fraction of them exercising reversions is slightly lower (Figure 2c). This, however, does not translate to significantly lower potential bankruptcy cost for the PBGC (column 3 in Table 2). Comparatively, this alternative implies higher contribution cost for sponsors ($3.8 million) and a lower tax recovery for the government (i.e., a larger revenue loss $1.55 million, federal plus state), both mainly due to smaller and fewer asset reversions.
Under Alternative 2, we considered an excise tax rate of 15% combined with a 10% transfer of excess assets to plan participants. The average funding status would be almost identical to the trajectory under the first proposal (Figure 1d). Plan participants would gain from this redistribution arrangement – an approximately $0.3 million transfer out of the excess funds being reverted (column 4 in Table 2). The participants' gain is diverted in part from the sponsor's benefit and in part from the government's potential revenue, and, as a result, the net contribution cost for the former and the revenue loss for the latter would be greater than under the other proposal. This alternative proposal would not alter the PBGC's expected average bankruptcy cost.
9.2 Robustness check for parameter assumptions
Before we move on to illustrate the results from alternative scenarios, we check the robustness of results by changing the parameter values in the objective function, mainly RRA (ρ) and EIS (η), the two most influential parameters.
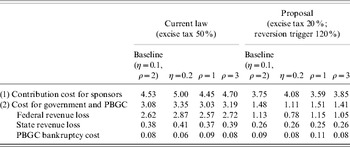
As mandated by the PPA, plan sponsors must contribute at least the amortization charge plus normal cost (the case of contribution-minimizing is particularly analyzed below). Some plans may prefer to contribute more than the minimum to fill the funding gap more quickly. A higher EIS (η) indicates a desire for faster pace of voluntary amortization. We alter η to 0.2, a value higher than the benchmark η=0.1. Larger contributions, together with the usual 60/40 portfolio, help plan assets easily reach and exceed the value of liabilities, which in turn implies much lower average potential costs for the PBGC – $0.06 million under current law and $0.08 million under the proposal (Table 4). The funding threshold for reversion would guide plan assets to settle at around 120% of liabilities under the proposal and alternative 2, and at 125% of liabilities under alternative 1. The reform proposal in this situation would also give the federal government a greater gain – a $2.1 million revenue recovery versus the $1.5 million in Table 2 (similarly for state governments, albeit in smaller amounts).
A lower (higher) RRA (ρ) indicates that plan sponsors are less (more) cautious about their funding status. We alter ρ to 1 and 3, separately, different from the benchmark ρ=2. As shown in Table 4, in the almost risk neutral case (ρ=1), plan sponsors contribute less ($4.45 million) than the more cautious sponsors. The revenue losses for the federal and state governments are correspondingly lower, and lower contributions translate into slightly higher risk for the PBGC ($0.09 million). The reform proposal improves on current system, similar to the baseline simulations. On the other hand, when sponsors are more cautious, with ρ=3, they are more likely to create excess assets in their DB plans (a larger contribution cost of $4.70 million). They are also likely to make a somewhat smaller reversion of excess assets (an average net contribution cost of $3.85 million after reversions), when allowed, so as to keep the DB funding in a safe range. Compared to the current tax system, the reform proposal releases excess assets to sponsors and realizes tax revenue recovery for the government.
These experiments confirm that our results are not particularly sensitive to parameter values. The objective function assumed does not artificially reward overfunding or create needs for excess asset reversion. In fact, with the benchmark assumptions of η=0.1 and ρ=2, we effectively model corporate sponsors that have relatively low risk aversion (but are still risk averse) and desire a gradual schedule of contributions. After the assurance of appropriate parameter values, we next examine alternative scenarios.
9.3 Results for contribution-minimizing plans
Some sponsors choose to contribute only the minimum required to their plans, either because finances are tight or because they ascribe less value to full funding than we assume optimizing plan sponsors do. We therefore explore the effects of reform proposals on these contribution-minimizing plans.
Technically, this scenario also serves as the most rigorous sensitivity test for our model because: (i) plan sponsors' minimum contributions are solely governed by the PPA, independent of the parameter values in equations (3)–(5). And (ii), with substantially slower pace of pension asset buildup and thus fewer opportunities for excess asset reversions, the potential payoff from reversions to the sponsors and revenue for the government would not be overestimated.
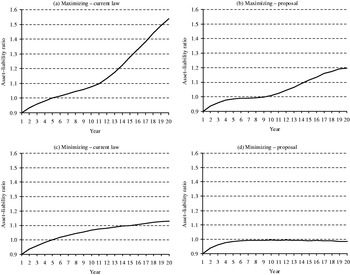
Even making minimum contributions, plans with a 60/40 equity/bond asset mix will eventually become overfunded, albeit at a slower pace, as in Figure 3a. This basically rejects the possibility that past overfunding could be gradually withdrawn in years through reduced contributions, which would otherwise mitigate the need for a reform on reversion tax in the PPA-era. This slower funding route implies that fewer plans would be well-funded (dashed lines in Figure 4) and thus fewer reversions would occur. It is unambiguous, however, that the reversion tax reform proposals would benefit the plan sponsors for a lower net contribution cost, the government for a lower tax revenue loss and the plan participants for real transfers, albeit in smaller amounts (Table 5). As before, a lower excise tax would unlock excess assets for sponsors, which implies a somewhat smaller asset cushion for adverse shocks and a slightly higher bankruptcy cost for the PBGC, but the average funding status would remain above 100% (Figures 3b–d).
Average funding ratios – contribution-minimizing plans Source: Authors' simulations.

Distributions of contributions/reversions – contribution-minimizing plans Source: Authors' simulations.

9.4 Results for plans with varying asset allocations
Some economic theories and actuarial literature suggest that the sponsors of well-funded pension plans may be better off if they lower their risk by adopting a more conservative investment portfolio that more closely matches plan assets with liabilities. The rationale is that risk-taking can be put to better use in more rewarding corporate functions than in pension plans. This argument is particularly convincing under current law, because the punitive reversion taxes yield little symmetric reward for taking on pension risk. We therefore conduct an experiment to examine the possible impact of the reform proposal for pension plans that adopt this investment strategy. Specifically, we assume that plans start with the 60/40 asset split between equities and bonds, but then irrevocably switch to a 20/80 split once plan funding status reaches 130%.
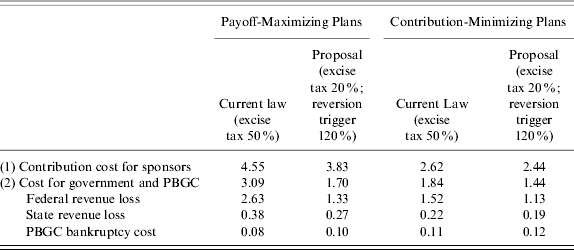
With asset allocations modified at high funding levels, the strategy apparently limits the upward potential for asset returns. In 20 years, the funding levels under current law are projected to be around 150% for payoff-maximizing plans (Figure 5a) and 115% for contribution-minimizing plans (Figure 5c). At the same time, the switch to a conservative portfolio reduces the volatility of the market value of pension assets, which implies fewer or smaller funding shortfalls. As a result of these two offsetting forces, the net contribution cost for plan sponsors and tax deduction cost for the government are only marginally different than the results of a constant 60/40 asset split (column 1 in Table 6 vs. column 1 in Table 2). This difference is more negligible for the contribution-minimizing plans (column 3 in Table 6 vs. column 1 in Table 5).
Average funding ratios – varying asset allocations Source: Authors' simulations.

Redistribution of excess assets – varying asset allocations ($millions, PDV)
Source: Authors' simulations.
On the other hand, with lower investment returns, the potential efficiency improvement also would be lower from the proposed reform. That is, the reform would still benefit all stakeholders, but there would be fewer asset reversions for plan sponsors (column 2 in Table 6 vs. column 2 in Table 2) and less tax recovery for the government (column 4 in Table 6 vs. column 2 in Table 5).
9.5 More alternative situations
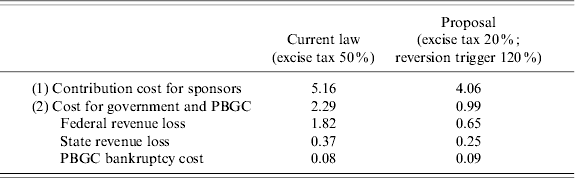
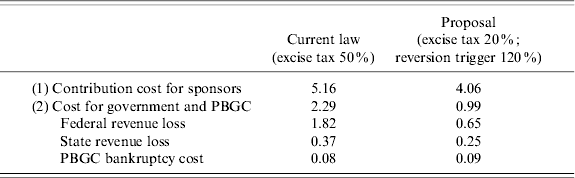
Many plan sponsors realize an effective corporate income tax rate lower than 35%, owing to various tax credits and deductions. As an approximation, we apply a 25% effective federal corporate income tax rate to the payoff-maximizing plans, without changing the 5% state tax.Footnote 16 A lower effective tax rate implies fewer tax benefits on contributions, i.e., higher net contribution cost. As a result, the asset release from a reversion is more beneficial to the sponsor – the improvement margin is $1.1 million (5.16–4.06) in Table 7 compared with $0.8 million (4.53–3.75) in Table 2. On the other side of the equation, this lower effective tax rate means less revenue loss for the federal government in the first place under current law, so less revenue is recovered – a revenue gain of $1.2 million (1.82–0.65) in Table 7 versus $1.5 million (2.62–1.13) in Table 2.
Redistribution of excess assets – payoff-maximizing plans with effective federal corporate income tax rate of 25% ($millions, PDV)
Source: Authors' simulations.
Clearly, asset returns play a significant role because they affect the amount of assets available for reversion, thereby altering the effect of tax reforms. Moreover, asset allocations in some pension plans may deviate from the 60/40 split between equities and bonds from the very beginning, in contrast to the strategy of changing the asset allocation after the plan becomes well-funded.
We consider a conservative portfolio with a 20% equity/80% bonds asset allocation, along with the PPA-required minimum contributions. The reversion tax reform has the least impact in this situation. This portfolio would yield an asset–liability ratio around 1.1 in 20 years, absent reversions under current law, and around 1 under the proposal and the two alternatives for the same time horizon (figures not shown). Unsurprisingly, the potential benefit of reversion tax reforms shrinks substantially for each stakeholder, but the comparison still supports the previous finding that the reform reduces the inefficiency (Table 8).
Redistribution of excess assets – contribution-minimizing plans with conservative investment portfolio (20% equity and 80% bonds, $millions, PDV)

Source: Authors' simulations.
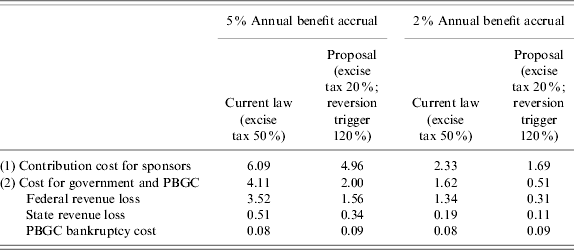
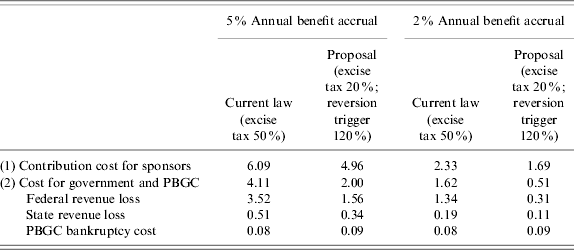
Some plans may face a higher normal cost, so we also compare the proposal with current law for sponsors with a 5% gross annual benefit accrual. The asset portfolio is the common 60/40/equity–bond split. Clearly, faster-growing liabilities signify a greater need for continuous contributions, more income tax deductions on these contributions and less room for asset reversion, other things equal. In other words, plan sponsors now face a larger contribution cost and the government a larger revenue loss. Despite these quantitative differences, the tax reform would provide comparable gains to those in the other situations – a $1.1 million gain for the sponsors and a $2.1 million loss reduction for the government and the PBGC together (columns 1 and 2 in Table 9). Some other plans, particularly those frozen or shrinking plans, on the contrary, may face a lower normal cost. We consider a 2% annual benefit accrual and compare the proposal again with current law. Given this slower pace of liability accumulation, sponsors generally face a lower contribution burden and the government loses less tax revenue in the first place under current law. Nevertheless, the efficiency improvement implied by the proposal remains significant – a $0.6 million gain for the sponsors and a $1.1 million loss reduction for the government and the PBGC together (columns 3 and 4 in Table 9).
Redistribution of excess assets – payoff-maximizing plans ($millions, PDV)
Source: Authors' simulations.
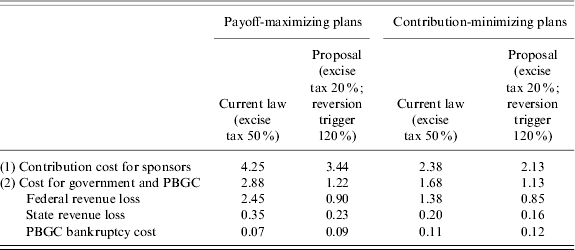
Many DB plans are improving financially, as observed recently. To reflect this trend, we also use a distribution of initial funding status that is shifted right towards a well- and over-funded range with plan assets being 90–110% of liabilities. Other parameter assumptions remain the same as in the benchmark. Table 10 shows that the costs would be lower for all stakeholders both under current law and the proposal, given the much improved funding status. In this alternative situation, plans are in the first place better positioned to reach the funding threshold for excess asset reversion. Correspondingly, the reform proposal would give plan sponsors a greater reduction in contribution cost (4.25–3.44=$0.81 million vs. $0.78 million in Table 2) and the federal government a greater revenue recovery (2.45-0.90=$1.55 million vs. $1.49 million in Table 2), without imposing greater risk on the PBGC.
Redistribution of excess assets – initial funding 90–110% ($millions, PDV)
Source: Authors' simulations.
Taken together, the results in the various situations convey the same key message: with pension plans now supported and guarded by the PPA, a lower reversion tax may introduce a slightly higher bankruptcy risk to the PBGC, but that would be overshadowed by the gains for plan sponsors, participants, and the government and the PBGC in combination.
10 Conclusions
With the passage of the PPA, DB pension plan sponsors are more accountable for their funding obligations. The minimum contributions mandated by the PPA will boost plan funding. A cautious plan sponsor with a concern for its reputation may choose to contribute more than this minimum, which, along with common investment policies, will likely make its plan overfunded. In this well-funded plan universe, it becomes necessary to consider the best way to utilize excess assets in overfunded plans.
Lowering the excise tax rate and establishing a reasonable funding threshold for asset reversions would not only free up excess funds for other corporate needs, thereby lowering the cost of DB plan sponsorship, but also open a considerable revenue source for the government, with only a modest increase in bankruptcy cost projected for the PBGC. Alternatively, a lower reversion tax combined with a partial transfer of excess assets to plan participants would also improve the current system, providing benefits to all stakeholders. As excess assets become more accessible to plan sponsors and the cost of plan sponsorship decreases, fewer voluntary plan freezes or terminations are expected to occur. In short, with restored symmetric and positive incentives for plan sponsors, the reversion tax reform may help encourage rather than erode the establishment and maintenance of DB pension plans.